DEVELOPMENTAL DYNAMICS 236:1790 –1805, 2007
SPECIAL ISSUE RESEARCH ARTICLE
A Web-Based Interactive Developmental Table for the Ascidian Ciona intestinalis, Including 3D Real-Image Embryo Reconstructions: I. From Fertilized Egg to Hatching Larva Kohji Hotta,1* Kenta Mitsuhara,2 Hiroki Takahashi,3 Kazuo Inaba,4 Kotaro Oka,1 Takashi Gojobori,2 and Kazuho Ikeo2
The ascidian chordate Ciona intestinalis is an established model organism frequently exploited to examine cellular development and a rapidly emerging model organism with a strong potential for developmental systems biology studies. However, there is no standardized developmental table for this organism. In this study, we made the standard web-based image resource called FABA: Four-dimensional Ascidian Body Atlas including ascidian’s three-dimensional (3D) and cross-sectional images through the developmental time course. These images were reconstructed from more than 3,000 high-resolution real images collected by confocal laser scanning microscopy (CLSM) at newly defined 26 distinct developmental stages (stages 1–26) from fertilized egg to hatching larva, which were grouped into six periods named the zygote, cleavage, gastrula, neurula, tailbud, and larva periods. Our data set will be helpful in standardizing developmental stages for morphology comparison as well as for providing the guideline for several functional studies of a body plan in chordate. Developmental Dynamics 236:1790 –1805, 2007. © 2007 Wiley-Liss, Inc. Key words: Ascidian; developmental stage; 3D; Ciona; morphology; database; spatio-temporal; time-lapse; CLSM; body atlas Accepted 16 April 2007
INTRODUCTION The spatio-temporal information at the single cell level is essential for an understanding of the organization of higher levels of morphology, such as tissue, organ and the organism as a whole. For example, in the convergent extension movement, the whole body shape is determined by the overall polarity of each cell. To represent spatial information,
three-dimensional (3D) images are often reconstructed as in recent studies from developmental biology (Rembold et al., 2006; Tassy et al., 2006) as well as from neurobiology (Lein et al., 2007). Using high-resolution 3D images, the whole embryo structure can be analyzed in single cell detail. Moreover, these 3D images provide information of internal cellular arrangements as well as that of the outer
surface, because 3D images are reconstructed from multiple cross-sectional images. However, due to increasing cell numbers that diminish transparency, it rapidly becomes difficult to map the 3D whole embryo at a single cell level. Early embryos of the ascidian Ciona intestinalis (C. intestinalis) are wellsuited for such a 3D image-based analyses. They are relatively trans-
The Supplementary Material referred to in this article can be viewed at www.interscience.wiley.com/jpages/1058-8388/suppmat. 1 Department of Bioscience and Informatics, Faculty of Science and Technology, Keio University, Yokohama, Japan 2 Center for Information Biology, National Institute of Genetics, Shizuoka, Japan 3 Department of Morphogenesis, National Institute for Basic Biology, Aichi, Japan 4 Shimoda Marine Reearch Center, Graduate School of Life and Environmental Science, University of Tsukuba, Shizuoka, Japan Grant sponsor: JSPS; Grant number: 18770207; Grant sponsor: BIRD of Japan Science and Technology Agency (JST); Grant sponsor: MEXT. *Correspondence to: Kohji Hotta, Department of Biosciences and Informatics, Faculty of Science and Technology, Keio University, Kouhoku-ku, Yokohama 223-8522, Japan. E-mail:
[email protected] DOI 10.1002/dvdy.21188 Published online 6 June 2007 in Wiley InterScience (www.interscience.wiley.com).
© 2007 Wiley-Liss, Inc.
3D IMAGING OF C. INTESTINALIS EMBRYO DEVELOPMENT 1791
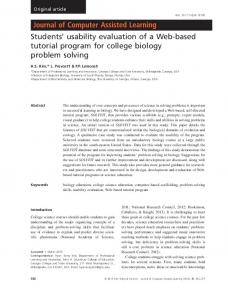
Fig. 1. Construction of ascidian 3D image database. A: Median sectioning image in stage 23 embryo (late tailbud I). Scale bars ⫽ 100 m. Anterior or dorsal side is at the top and the right of the image, respectively. The arrow indicates each of cells in a given tissue. Numbers colored in yellow indicate notochord cells that consist of 40 total. Alexa 546 phalloidine (Molecular Probes) was used for staining embryos. As the staining targets actin filaments, the cortical part of a cell is primarily stained. B: Three-dimensional image reconstructed in the stage 23 embryo. Left is anterior head part. C: Schematic images of construction of ABA.
parent with an overall diameter of only 200 m, making it possible to observe a whole larval body at the single cell level by light microscopy. In addition, their tadpole-like larva consists of ⬃2,600 cells. When fully developed, the ascidian larva contains only six major tissue types: nervous tissue, notochord, muscle, ectoderm, endoderm, and mesenchyme (Fig. 1A). These features are shared with higher vertebrates and can be cataloged by cell number. The notochord is composed of only 40 cells, the mus-
cle has 36 cells, and the central nervous system (CNS) is comprised of 350 cells, of which 100 are neurons (Nicol and Meinertzhagen, 1991; Satoh, 1994). Thus, the ascidian is an excellent model for studying the spatial organization of developing chordate embryos. Because ascidians develop as a typical mosaic of cells, there have been several reviews on its early embryonic patterns. Cell fate has been precisely described with detailed sketches (Conklin, 1905), and these cell lineages
have been confirmed by horseradish peroxidase staining (Nishida and Satoh, 1983, 1985; Nishida, 1987). In the ascidian Halrocincia roretzi, the spatial relationship among each blastomere is also well documented by scanning electron microscopy (Satoh, 1978). From these lines of study, cell lineages in ascidian embryo development are thoroughly described from fertilized egg until the larval stage. To represent temporal information of ascidian embryo development, there are several descriptions from fixed-temperature studies (Whittaker, 1977; Nicol and Meinertzhagen, 1988). However, the definition of embryonic stages is particularly crucial and differs among laboratories: identical stages of embryo development are often identified by different terms. One significant reason for this discrepancy is the lack of any unifying criteria for canonical nomenclatures of embryonic staging. Nomenclatures so far have been based on limited information of apparent morphology such that a specific morphological stage might be ambiguously defined. To make more precise definitions for embryonic stages, greater detailing of temporally diverse images is necessary, which should include morphological information on the interior cells of embryos as well as of that on the exterior surface cells. Since the developmental process is influenced by temperature, the relationship between incubation temperature and the progress of development is also essential for determining the staging criteria and needs to be normalized. Therefore, the purpose of this study is to provide a standardized resource of both spatial as well as temporal information by describing the 3D morphological stages and the cross-sectional images from the C. intestinalis embryo. To do so, over 3,000 high-resolution confocal laser scanning microscopy (CLSM) images were sequentially collected from Ciona embryos that developed at fixed temperature (18°C). As the developmental time at one stage varies across different temperatures (see Supplemental Fig. 1, which ca be viewed at www.interscience. wiley.com/jpages/1058-8388/supp mat), another simple staging criteria that is not influenced by temperature
1792 HOTTA ET AL.
TABLE 1. Stages of Early Embryonic Development in Ciona Intestinalis Measurement of embryos
Hotta’s Stage
Characteristics
I. Zygote period (0-0.9hr) St. 1 One cell Zygote, fertilized egg II. Cleavage period (0.9-4.5hr) St. 2 2-cell Two cell-stage embryo St. 3 4-cell Four cell-stage embryo St. 4 8-cell Eight cell-stage embryo St. 5a early 16-cell Early sixteen-cell stage embryo St. 5b late 16-cell Late sixteen-cell stage embryo St. 6a early 32 cell Early thirty two-cell stage embryo St. 6b late 32 cell Late thirty two-cell stage embryo St. 7 44-cell Fourty four-cell stage embryo. The vegetal side of the embryo is very round. St. 8 64-cell Sixty four-cell stage embryo. Embryo has a square shape seen form the top, with bulging B7.4 cells. St. 9 76-cell Seventy six cell stage embryo. The vegetal side of the embryo is very flat. III. Gastrula Period (4.5-6.3hr) St. 10 110-cell, initial Gastrulation starts with the apical gastrula constriction of A7.1 blastomeres. St. 11 early gastrula The ntochord has invaginated. The vegetal side of the embryo has a horseshoe shape. St. 12 mid gastrula Six-row neural plate stage. The blastopore is still central and open. St. 13 late gastrula The blastopore is in posterior position and nearly closed. The embryo elongates anteriorly. The neural plate has more than 6 rows and the A-line neural rows (I and II) start to curve (neurulation begin). The large b6.5 progeny are coming together at the midline. IV. Neurula Period (6.3-8.5hr) St. 14 early neurula A-line neural plate forms a gutter lined by b6.5 descendants. The embryo has a diamond shape. The gutter is not closed. St. 15 mid neurula The neural tube has formed on most of its length. The embryo has an oval shape. The a-line neural plate also forms a gutter. St. 16 late neurula The neural tube starts to form in the posterior territories. The embryo elongates. V. Tailbud Period (8.5-17.5hr) St. 17 initial tailbud I First indication of a separation between tail and trunk territories. The tail is not bent and has the same length as the trunk. Any notochord cells not finished intercalation. St. 18 initial tailbud II The tail is clearly separated from the trunk. Tail and trunk have same length. Neuropore still open, a-line neurulation.
Head length (m)
Tail length (m)
Ratio tail/head
T
% hatch
24min (0.4hpf)
3%
55min (0.9hpf) 1hr 27min (1.45hpf) 1hr 54min (1.9hpf) 2hr 21min (2.35hpf) 2hr 39min (2.65hpf) 3hr (3hpf) 3hr 12min (3.2hpf) 3hr 21min (3.35hpf)
6% 8% 11% 13% 15% 17% 18% 19%
4hr (4hpf)
23%
4hr 12min (4.2hpf)
24%
4hr 33min (4.5hpf)
26%
4hr 54min (4.9hpf)
28%
5hr 39min (5.65hpf)
32%
5hr 55min (5.9hpf)
34%
6hr 21min (6.35hpf)
36%
6hr 48min (6.8hpf)
39%
83.1
83.0
1.0
7hr 24min (7.4hpf)
42%
85.3
84.2
1.0
8hr 27min (8.45hpf)
48%
89.9
87.8
1.0
8hr 50min (8.8hpf)
50%
97.6
111.9
1.1
3D IMAGING OF C. INTESTINALIS EMBRYO DEVELOPMENT 1793
TABLE 1. (Continued) Measurement of embryos
Hotta’s Stage St. 19
Characteristics
early tailbud I
The tail bends about 40°and is slightly longer than the trunk. A few anterior most notochord cells begin to intercalate and linear. St. 20 early tailbud II Neuropore closed, tail bent by 60°, neurulation complete. St. 21 mid tailbud I Tail 1 1/2 times longer than trunk and curve ventrally (90°). Intercalation of notochord cells just finished. St. 22 mid tailbud II The body adopts a half circle shape. Tail twice as long as trunk. St. 23 late tailbud I Initiation of the pigmentation of the otolith. Tail strongly curved with tip close to the anterior end of the trunk. St. 24 late tailbud II Notochord vacuolation begins, palps start to be visible at the front end of the embryo. Tail straightens. St. 25 late tailbud III Ocellus melanization. All notochord cells have vacuoles. Tail bent dorsally. VI. Larva Period (17.5hr-) St. 26 hatching larva Hatching. head adopts an elongated rectangular shape.
T
% hatch
Head length (m)
Tail length (m)
Ratio tail/head
9hr 19min (9.3hpf)
53%
103.0
120.3
1.2
9hr 30min (9.5hpf)
54%
112.0
146.7
1.3
10hr 2min (10hpf)
57%
114.3
180.7
1.6
10hr 54min (10.9hpf)
62%
118.0
221.2
1.9
11hr 54min (11.9hpf)
68%
118.9
255.1
2.1
13hr 27min (13.5hpf)
77%
130.8
442.6
3.4
15hr 54min (15.9hpf)
91%
143.7
558.6
3.9
17hr 30min (17.5hpf)
100%
159.3
661.6
4.2
From the left column, “Hotta’s stage” is the staging criteria defined in this manuscript. A total of 26 stages are divided into six periods. Parentheses in each period mean the start-time and end-time of each period at 18°C. “Characteristics” is mainly based on the observation under dissecting microscopy. “Measurement of embryos”: T, Time after fertilization (average at 18°C, n⫽3), % hatch ⫽ rate of T (min) / 1050 (min), head length, tail length and ratio of tail / head length.
but rather is transposable and based solely on morphology is required. Therefore, we introduce development progress here as “% hatched,” defined as the ratio percentage of time postfertilization when all embryos have reached the hatching stage (where 100% hatched is reached in 17.5 hr at a fixed temperature of 18°C). These new staging criteria are now defined and directly linked with each image (Table 1, Supplemental Fig. 2). Under these criteria, the spatio-temporal developmental patterns of embryos are accurately represented with the realimage reconstructed 3D whole embryos along with the normalized point in development progress. We present this web-based image resource as the Four-dimensional Ascidian Body Atlas FABA (http://chordate.bpni.bio.keio.ac.jp/faba/top.html), which we believe will be advantageous not only for researchers who are inter-
ested in ascidian development but also for a general understanding of embryonic organization at the single cell level.
RESULTS Imaging and Database Construction Time-lapse images were acquired every 3 min post-fertilization at 18°C. The fertilization occurred simultaneously and the cleavages were uniformly synchronized (data not shown). At 18°C, chorionated embryos hatch into developing larvae at 17.5 hr postfertilization (Supplemental Movie 1). Fixed embryos were then obtained, including cleavage, gastrulation, neurulation, formation of tailbud stage embryos, and the hatching larva. Based on newly defined staging criteria (Table 1), a total of 26 distinct representative embryos were chosen for imag-
ing by CLSM. Images that showed a little deviation in developmental stages compared with those of majority of embryos were not collected. For a given developmental stage, we collected the majority as the representative embryo (Fig. 2, Supplemental Fig. 2). Alexa 546 phalloidine was used to visualize the position of cell membranes by staining cortical actin filaments. The fluorescent intensity of cytosolic actin staining is different among cells and embryonic stages (for example, see Fig. 4H”). Therefore, this difference was useful for distinguishing the cell types in the developing embryos. All 3D images are reconstructed from the corresponding 100 sectioning images (LSM image browser, Zeiss, Germany). Figure 1B shows one example of 3D images from a stage 23 embryo (late tailbud I, 68% hatch), in which the shape and ar-
1794 HOTTA ET AL.
rangement of the individual cells are clearly observed. The image is comparable with the initial observation of ascidian embryos by SEM (Satoh, 1978), but the present image contains information of both intracellular structures, such as nuclei and the centrosome attracting body (CAB), along with internal sectioned images. Sectioned images provide very useful information on the internal cell arrangement of the embryo (Fig. 1A). Each tissue is distinguished from each other at the single cell level (Fig. 1A, arrows). The morphology, localization, and arrangement of each cell are also well characterized. In particular, 40 notochord cells could be accurately counted (Fig. 1A, yellow colored numbers). To facilitate the visualization of both cross-sectional images and 3D images, these images were exported as a series of jpeg files, and they were converted into Flash (Adobe, San Jose, CA) files (Fig. 1C). The Flash plug-in can be easily installed into any web-browser. Each flash file includes image information on the spatio-temporal cell arrangement and was connected under the web-based database with the information of developmental stage, such as new developmental nomenclature, hour post-fertilization (hpf), % hatch, cell lineage, and scale (Figs. 1C, 3). These Flash files were integrated into the web-based database “FABA,” so that one can refer to every 15° angle of the 3D images along with the Y-axis interactively and to every z-section image via the internet (Fig. 4, http://chordate.bpni.bio.keio. ac.jp/faba/top.html). One of the unique features of the FABA is the ability to display images interactively. When a given developmental stage was selected from the developmental table (Fig. 3A) or the cell lineage table (Fig. 3B), 3D- and Z-section images of the whole-body embryo could be easily viewed at a selected stage (see Fig. 3C,D). With the section slider in “zsection module,” every sectioning image could be displayed between selected focus ranges (Fig. 3C). With the “rotation module,” every 15° angle of the 3D images along with Y-axis could be animated in the 3-D module (Fig. 3D).
Developmental Staging of C. intestinalis We newly defined 26 stages for the embryonic and larval development of ascidian, Ciona intestinalis, in Table 1. These developmental stages began with fertilization and ended with hatching out from the chorion. Moreover, the numbering of the staging system was based on the staging system used for zebrafish and medaka (Kimmel et al., 1995; Iwamatsu, 2004). Table 1 also shows the time point relative to the developmental stages at 18°C, and a new criteria described the important features of embryo, %hatch, and the embryonic size (i.e., the lengths of tail and head). Though embryos are dechorionated, hatching time was examined by coincubation with chorionated embryos. Embryonic development was subdivided into six periods (Table 1): zygote (Fig. 4), cleavage (Fig. 5), gastrula (Fig. 6A–D), neurula (Fig. 6E–G), tailbud (Fig. 7), and larva (Fig. 8). Until stage 10, the staging criteria depend both on the shape as well as the number of cells. After stage 10, to give stage names that are clearly understandable, criteria are mainly based on the shape and length, which are observed through a dissecting microscope under low magnification (Supplemental Fig. 1). These criteria are simple but provide suitable landmarks. For example, as a landmark of stage 20, an angular tail bend of 60° is selected. This tail bend is also an indicator of neuropore closure (Fig. 7C,C⬘ arrowhead). At stage 21, the notochord intercalation finished. This stage landmark is identified by a 1 90° tail bend (or tail 1 2 times longer than the trunk, Table 1). Staging information is converted to “standard developmental time,” as designated by the letter “h,” and defined as normalized hours fertilization at 18°C. Previously reported optimal temperatures of incubation for C. intestinalis staging has varied from 16° to 20°C (16°C, Nicol and Meinertzhagen, 1988; 18°C, Whittaker, 1977; 18 – 20°C, Conklin, 1905; 20°C, Chiba et al., 2004). This difference in developmental rate between other temperatures is shown in Supplemental Figure 1. The hatching time after fertilization consequently varied from 13.5 hr at 22°C, 15.6 hr at 20°C, 17.5
hr at 18°C, and 22.0 hr at 16°C (Supplemental Fig. 2). It may be useful in temperature-dependent studies to bring embryos to two different stages at the same time. Furthermore, we measured the tail and trunk length at each stage after stage 15 (Table 1).
Zygote Period (0 – 0.9 hr post-fertilization at 18°C, stage 1) The zygote period (0 – 0.9 hr after fertilization at 18°C) consisted of a single stage, stage 1, extending from the fertilisation event up to the end of the first mitotic cycle. Figure 4A, A’ shows an embryo close to the first mitotic division of the egg (approximately 0.4 hpf at 18°C by timelapse movie, Supplemental Movie 1). Figure 4B (the 3D reconstructed image) and B’ (optical section) show the end of the stage (0.8 hpf), when cytokinesis is underway, but the two daughter cells have not yet fully separated.
Cleavage Period (0.9 – 4.5 hr, stages 2 to 9) The cleavage period (0.9 – 4.5 hr postfertilization at 18°C) consisted of eight stages, stages 2–9 (Fig. 5). The cleavage period was characterized by a series of mitotic divisions that resulted in the formation of many blastomeres. During these stages, the embryos are bilaterally symmetrical. In the cleavage period, the criteria depend not only on the number of cells and but also on the shape of embryo. Because the early cleavage of blastomeres at the 16-cell stage or 32-cell stage embryo dynamically changes the shape by compaction, we further divided the 16-cell and 32-cell stages into two substages (16-cell stage: stage 5a and stage 5b; 32-cell stage: stage 6a and stage 6b, respectively). Stage 2: Two-cell embryo (0.9 hr, Fig. 5A, A’). The first cleavage plane separates the left and right halves of the embryo. Stage 3: Four-cell embryo (1.45 hr; Fig. 5B–C’). The second cleavage plane separates the anterior from the posterior halves of the embryos. Just after cleavage, the embryos are very loosely organized (Fig. 5B, B’) and then compact towards the end of the stage (Fig. 5C, C’). In Stage 3 (4-cell
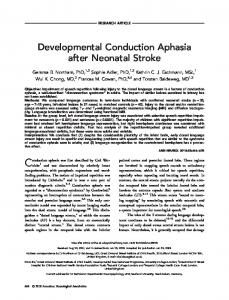
Fig. 2. Three-dimensional reconstructed images of the C. intestinalis embryo in the developmental time course after fertilization. Fertilized eggs were dechorionated and were incubated at 18°C. Staining of each embryo was performed by Alexa fluor phalloidin 546 (Molecular Probes). The top of each embryo is the anterior side except for the embryos from stage 24 whose left side shows the anterior. Stage 1 in zygote period. Stages 2–9 in cleavage period. Stages 10 –13 in gastrula period. Stages 14 –16 in neurula period. Stages 17–25 in the tailbud period. Stage 26 in larva period. See the criteria for each stage in Table 1. Scale bar ⫽ 50 m.
1796 HOTTA ET AL.
Fig. 3. Screenshot of the ABA database. A: “Developmental Table” refers to the two-dimensional images from a fertilized egg to the hatched larva as viewed by CLSM and Nomarski. B: Information on “Cell Lineages.” C: Information about section images. D: Information about 3D images. To use the database, please refer to the website: http://chordate.bpni.bio.keio.ac.jp/faba/top.html
stage), the staining could detect CAB structure (Fig. 5C: vegetal view of the 3D reconstructed image, Fig. 5C’: posterior view of the 3D reconstructed image, Fig. 5C”: the section image of Fig. 5C) (Hibino et al., 1998; Iseto and Nishida, 1999). Stage 4: Eight-cell embryo (1.9 hr;
Fig. 5D, D’). The third cleavage plane separates animal from vegetal territories. At this stage, the four founder lineages are defined: a, animal anterior; b, animal posterior; A, vegetal anterior; B, vegetal posterior. It is possible to identify each blastomere in living embryos, according to their size
(B-line is biggest) and spatial arrangement. The embryos compact towards the end of the stage (not shown). Stage 5: Sixteen-cell embryo (2.35 hr; Fig. 5E–F”). All animal and vegetal cells have undergone a fourth cleavage. The first sign of a clear antero-posterior polarity in the shape of
3D IMAGING OF C. INTESTINALIS EMBRYO DEVELOPMENT 1797
Fig. 4. Zygote period. Stage 1 (one-cell; 0 – 0.9 hr post-fertilization at 18°C): A,B: The process of one cell showing the approaching division of the egg. A’,B’: The cross-section of A, B, respectively. In addition to the cortical actin filaments beneath the cell membranes (arrows), the staining could detect the cytosolic actin filaments surrounding the nuclei (arrowheads). Scale bar ⫽ 50 m.
embryo, resulting from the action of the CAB: the B5.2 blastomere is significantly smaller than the others. A quantification of the size difference between B5.1 and B5.2 is provided in Tassy et al. (2006). This stage is split into early, uncompacted 16-cell stage (Stage 5a, Fig. 5E–E”) and late, compacted, 16-cell stage (Stage 5b, Fig. 5F–F”). Stage 6: Thirty-two-cell embryo (3.1 hr, Fig. 5G–H”). All blastomeres have undergone a fifth cleavage, which occurs earlier in the vegetal than animal lineages. Division of B5.2 is again markedly asymmetric due to the action of the CAB, leading to a small posterior B6.3 cell. This stage is split into early 32-cell (stage 6a; Fig. 5G– G”), which is quasi spherical, and late (stage 6b; Fig. 5H–H”), which is flatter and in which the large B6.2 cell is bulging out. Stage 7: Forty-four-cell embryo (3.35 hr; Fig. 5I–I’). All vegetal blastomeres have undergone an additional
(sixth) cleavage. Vegetal blastomeres are bulging out. The very small B7.6 blastomere is a landmark of the posterior end of the embryo. Stage 8: Sixty-four-cell stage (4 hr; Fig. 5J–J’). The animal blastomeres have now also undergone a sixth cleavage. Seen from the animal pole, the embryo has a rather square shape with A7.8 and B7.4 blastomeres bulging out. Stage 9: Seventy-six-cell stage (4.2 hr; Fig. 5K–K’). Divisions become asymmetric in the vegetal hemisphere. The embryo flattens on its vegetal side, in preparation for gastrulation. Vegetal cells are very tall and columnar.
Gastrula Period (4.5– 6.3 hr, stages 10 to 13) Stages 10 –13 is defined by the epibolic movements of ectodermal cells and by the migrations (invagination and in-
volvement) of endodermal and mesodermal cells inside the embryo (Fig. 6A–D). These stages correspond to the canonical nomenclatures of “gastrula.” Stage 10: One hundred ten– cell stage, initial gastrula (4.5 hr; Fig. 6A– A”), gastrulation starts with the apical constriction of A7.1 blastomeres. Stage 11: Early gastrula (4.9 hr, Fig. 6B–B”), the notochord has invaginated. The vegetal side of the embryo takes a horseshoe shape (Fig. 6B). Stage 12: Mid-gastrula, six-row neural plate stage (5.65 hr, Fig. 6C– C”), the blastopore is still central and open. The neural plate is flat and constituted by six rows of 6 cells (3 rows of a-line cells and 3 rows of A-line cells) that form a characteristically regular structure. Stage 13: Late gastrula (5.9 hr, Fig. 5D–D”), the blastopore is in the posterior position and is nearly closed. The embryo elongates anteriorly. The neural plate has more than 6 rows and the A-line neural rows (I and II) begin to curve (the start of neurulation). The large b6.5 progeny arrive together at the midline.
Neurula Period (6.3– 8.5 hr, stages 14 to 16) The neurula period (Table 1, Figs. 2, Fig. 6E–E”, F–F”, G–G”) is defined from stage 14 to 16. Stage 14: Early neurula (6.35 hr, Fig. 6E), the A-line neural plate forms a neural fold lined by the b6.5 descendants (Fig. 6E). The embryo has a diamond shape and makes the most acute angle in the head among the neurula period (Fig. 6E, Supplemental Fig.1). The neural fold is not closed (Fig. 6E). Stage 15: Mid-neurula (6.8 hr, Fig. 6F), the neural tube has formed along most of its length (Fig. 6F”). The embryo has an oval shape. The A-line neural plate also forms a neural fold (Fig. 6F”). Stage 16: Late neurula (7.4 hr, Fig. 6G), the neural tube closure starts to form in the posterior territories (Fig. 6G, arrowhead). The notochord precursor is converging and intercalating, and the embryo elongates (Fig. 6G–G”; Table 1, slightly longer than the length of a stage 15 embryo: ⫹4 m).
1798 HOTTA ET AL.
Fig. 5. Cleavage period. Stage 2 (A, A’, two-cell stage, 0.9 hpf at 18°C), stage 3 (vegetal view of initiation of four-cell, B, B’; vegetal view of late four-cell, C; view from posterior, C’), stage 4 (D, D’), stage 5a (E, E’, E”), stage 5b (F, F’, F”), stage 6a (G, G’, G”), stage 6b (H, H’, H”), stage 7 (I, I’), stage 8 (J, J’), and stage 9 (K, K’) are shown. Three-dimensional images (A, B, C, C’, D, E, F, G, H, I, J, K) and cross-section images (A’, B’, C”, D’, E”, F”, G”, H”). CAB structure is observed. In addition to the cortical actin filaments beneath the cell membranes (white arrows), the staining could detect cytosolic actin filaments surrounding the nuclei (white arrowheads). D, D’: Stage 4 (8-cell stage). Two-headed arrows indicate the pair of daughter cells. The number of cell-lineages are drawn on each blastomere. Scale bar ⫽ 50 m. CAB, centrosome attracting body; p.b., polar body.
3D IMAGING OF C. INTESTINALIS EMBRYO DEVELOPMENT 1799
Tailbud Period (8.5–17.5 hr, stages 17 to 25) The tailbud period (Table 1, Supplemental Fig. 2, Fig. 7) is defined from stage 17–25. The tailbud period could be subdivided into four canonical stages, initial tailbud, early tailbud, mid-tailbud, and late tailbud stages. However, this subdivision is broad. So except for the late tailbud stages, all tailbud stages will have only two sub-stages that mark the initiation and end of the stage. In all cases, the initiation of the stage has clear landmark. Stage 17: Initial tailbud I (8.45 hr, Fig. 7A–A’), there is the first indication of a separation between tail and trunk territories (Fig. 7A, white arrows). The tail is not bent and has the same length as the trunk (Table 1). The neural tube closure in the posterior territory finished and the neuropore move more anterior (Fig. 7A, arrowhead). The notochord cells are arranged in two inter-digitating rows but the notochord cells have not finished intercalation (Fig. 7A’). Stage 18: Initial tailbud II (8.8 hr, Fig. 7B–B’), the tail is clearly separated from the trunk. Tail and trunk have same length (Table 1). The neuropore is still opened and the A-line neurulation is observed (Fig. 7B,B’). The tail also begins to bend. Stage 19: Early tailbud I (9.3 hr, Fig. 7C–C’), the tail bends by approximately 40° and is approximately 20 m longer than the trunk (Table 1). The intercalation of a few anterior-most notochord cells finishes and the neuropore just closes (Fig. 7C’ arrowhead). Stage 20: Early tailbud II (9.5 hr, Fig. 7D–D’), the tail bends by 60°. In this stage, the neuropore has closed and neurulation is complete (Fig. 7D’). Stage 21: Mid-tailbud I (10 hr, Fig. 7E-E’), the tail is 1 21 times longer than the trunk (Table 1) and curves ventrally by 90°. Intercalation of the notochord cells is completed (Fig. 7E’). Stage 22: Mid-tailbud II (10.9 hr, Fig. 7F–F’), the body adopts a halfcircle shape, and the tail length is twice as long as yjr trunk (Table 1). Stage 23: Late tailbud I (11.9 hr, Fig. 7G–G’), the initiation of the pigmentation of the otolith under a dissecting microscope can be observed (Supplemental Fig. 1). The tail is
acutely curved with the tip close to the anterior end of the trunk. Stage 24: Late tailbud II (13.5 hr, Fig. 7H–H”), the notochord vacuolation begins partially (Fig. 7H”) and palps formation is intiated by a thickening and bulging of the anteriormost trunk epidermis (Fig. 7H’). The tail straightens in its anterior part. Ratio of the thickness of the notochord cells along the DV and AP axis is about 1.2 Stage 25: Late tailbud III (15.9 hr, Fig. 7I–I’), ocellus melanization is observed (Supplemental Fig. 2). The cilia elongation from caudal epidermal neuron begins (Fig. 7I, arrowheads). All notochord cells have vacuoles (Fig. 7I’). The tail is bent dorsally.
Larva Period (17.5 hr) Stage 26: Hatching larva (17.5 hr, Fig. 8), the head adopts an elongated rectangular shape (Supplemental Fig. 2; Fig. 8). Cilia of caudal epidermal sensory neuron are growing (Fig. 8, arrowhead). These cilia project into the fin tunic (data not shown; Pasini et al., 2006). Such structures are found also in the head (Fig. 8, asterisk; Hotta, unpublished data). Considered with its region, the structure indicated by the asterisk in Figure 8 appears to be dendrite from the epidermal sensory neuron, apical trunk epidermal neuron (ATEN; Imai and Meinertzhagen, 2007), and the palp neuron in the larva head. A pair of atrial primordia is well observed (Fig. 8A”).
DISCUSSION In this study, we newly defined staging of early embryonic development of the ascidian, C. intestinalis, and this new staging is connected with the images of embryos by CLSM and timelapse information, when constructing a database. There are four notable points regarding our description of the developmental stages observed in C. intestinalis: (1) We comprehensively define the stages of early embryonic development from fertilization to hatching larva. For the standardization of each stage, time-lapse imaging was performed at a stable temperature. Then developmental progress in each stage was precisely defined. The new criteria were defined by a description of morphology, hpf (hour post-fer-
tilization at 18°C) and % hatch (Table 1). (2) We assigned numerical stages as in staging of medaka fish (Iwamatsu, 2004) rather than named stages, which made it easier to remember and recognize the sequence of development. Stages 1–9 are based on the cell number and shape, and stages 10 –14 are based on external characteristics. In stages 15–26, embryo length is also taken into account (Table 1). This number of stages, however, might be insufficient to elucidate more detailed sequential development events. In such cases, this system could be further divided into more detailed substages. For example, at stage 1, morphological changes occur just before the segregation to the two-cell stage (Fig. 4B). In such case, one can see the time-lapse movie prepared (see the website, FABA; Supplemental Movie 1) and can assign “stage 1, 0.8 hpf,” by incorporating time-lapse or tail/head length data. (3) The stages are based on morphological features, identified by examining embryos and larvae with a low-resolution dissecting stereo-microscope (Table 1). However, corresponding high-resolution images collected by CLSM are connected with these stages, so that we can also identify the detailed inner embryo structure as well as outer surface of the embryo structure at any given stage. (4) Information on each developmental stage and referred image is readily available via the Internet and easily accessible with any standard web browser. This database is called the FABA (Four-dimensional Ascidian Body Atlas) and contains information for both z-slice sections and 3D reconstruction images at each time point along the developmental course of the ascidian C. intestinalis. Thus, we believe that the FABA database can be used as a standard reference. It would be one of the best resources of developmental biology and serve further functional studies on the basal chordates. For collecting each data set, we used only fixed samples. We once tried 3D-reconstruction from timelapse images of live embryos by using CLSM. However, time-lapse recording of live embryos not only caused artificial deformation of embryos, but also resulted in the collec-
1800 HOTTA ET AL.
tion of low-quality embryo images. Conversely, fixed embryos provide many imaging advantages. They offer stable and reproducible images, and they can be processed to be rendered transparent so that high-resolution images of embryos can be acquired (Fig. 2). The images in this study will help in the understanding of morphological changes of each cell during the developmental time course (Fig. 2 and Supplemental Fig. 2). Our study clarified previously indistinguishable structures of larva by CLSM with actin staining. In the larva, a pair of atrial primordia, distribution of different type of epidermal cells (Fig. 1B), dendritic structures both from caudal epidermal sensory neurons (Pasini et al., 2006), and head parts are clearly visible (Fig. 8). Our study demonstrates that these previously indistinguishable structures are also dynamically changing in their morphology during development (Fig. 8). Especially, CAB and cilia structures projecting from epidermal sensory neurons are surprisingly evident (Fig. 5C–C⬙, Fig. 8, arrowhead and asterisk). However, we should mention that dechorionation may have had a mild effect on the developmental potential of the embryos imaged in this study at the late tailbud stage. So, in the subsequent version of our FABA database, we expect that chorionated, later stages of development of C. intestinalis, such as the process of epidermal sensory neuron development and metamorphosis, could be analyzed with the same procedure. Our database implicates the importance of morphology from several developmental tissues in many other organisms besides ascidians. By combining the information on the localization of a specific protein, it becomes possible to relate the mechanism of the formation of spatiotemporal axis to the cell– cell interaction in developmental tissues at the molecular level. Fine comparison in cell and tissue differentiation or organization between the wild type embryo and knock-down mutant embryos (Hotta et al., 2007) is also possible. Thus, the 3D images in this FABA database should provide a solid foundation for further studies of developmental biology. In C. intestinalis, there are many databases
Fig. 6. Gastrula and neurula period. Stage 10 (A–A”), stage 11 (B–B”), stage 12 (C–C”), stage 13 (D–D”), stage 14 (E–E”), stage 15 (F–F”), stage 16 (G–G”). Dorsal view of three-dimensional images (A–G), 50% section images (A’–G’), and longitudinal section images (A”–G”). Dashed lines in A”–G” indicate the position of the section. Black arrowheads indicate the anterior edge of neural tube closure. Scale bar ⫽ 50 m. b.p., blastopore; n.p., neural plate; epi, epidermis; en, endoderm; mu, muscle; noto, notochord, n.t., neural tube.
containing gene (Ghost, http://ghost. zool.kyoto-u.ac.jp/indexr1.html) and protein (CIPRO, http://cipro.ibio.jp/) expression profiles. It would be very useful if the same embryos were shown in FABA real-image reconstructions and integrated with the “virtual” embryo in 3DVE in the ANISEED database (http://crfb. univ-mrs.fr/aniseed/). By integrating
our FABA reference atlas with such ascidian databases as ANISEED and the Ciona protein database CIPRO, we are able to make the genome-wide 3D atlas of gene/protein expression in C. intestinalis at early developing stages, and this kind of data collection would shed a powerful new light on the molecular mechanisms in chordate development.
3D IMAGING OF C. INTESTINALIS EMBRYO DEVELOPMENT 1801
Fig. 6. (Continued).
1802 HOTTA ET AL.
EXPERIMENTAL PROCEDURES Biological Materials and Preparation of Embryos Ciona intestinalis adults were obtained from the Gamagohri or Yokohama areas, Japan. In this study, we used eggs in winter (February to March). Eggs and sperm were obtained surgically from the gonoduct. After insemination, eggs were dechorionated as described previously (Hotta et al., 1999). Dechorionated fertilized eggs were maintained in agarose-coated dishes with Millipore-filtered seawater (MFSW) containing 50 g/ml streptomycin sulfate. To keep the temperature stable, we used a peltier-type incubator (CN-25B, Mitsubishi, Japan) without any vibration by a compressor to prevent embryo fusion. Embryos developed hatched larva approximately 18 hr after insemination.
Time-Lapse Imaging By using a peltier-based thermo-controller ThermoPlate MATS-500 (Tokai Hit), which was placed on the microscope stage (Olympus SZX16), the temperature was stabilized and maintained. All temperature was measured by a ThermoProbe (IT-18, Bio Research Center), which was controlled by PowerLab (ADI instrument). The embryo placed on the thermo-plate was maintained for 20 hr to stabilize temperature at 16°, 18°, 20°, and 22°C, respectively, to acquire images. By using a digital camera (Olympus SP-350) mounted on the microscope, images were acquired every 3 min (Supplemental Movie 1).
Histochemistry and Confocal Microscopy Fixed embryos were prepared from fertilized eggs up to hatched larva. Embryos were fixed for 15 or 30 min at room temperature in 4% EM grade paraformaldehyde (nacalai tesque code 00380) in MOPS buffer (0.1 M 3-(NMorpholino) propanesulfonic acid), adjusted to pH 7.5. Embryos were then washed three times with phosphatebuffered saline (PBS) and incubated in Alexa-546 phalloidin (Molecular Probes, Eugene OR) in PBS containing 0.01% Triton X-100 (PBST) either over-
Fig. 7. Tailbud period. Stage 17 (A, A’), stage 18 (B, B’), stage 19 (C, C’), stage 20 (D, D’), stage 21 (E, E’), stage 22 (F, F’), stage 23 (G, G’), stage 24 (H, H’), stage 25 (I, I’). Three-dimensional images (A– I) and cross-section images (A’–G’, G”, H’, H”, I’). Dorsal view (A and B) and lateral view (C–I). Anterior is left in all panels. Phalloidin staining highlight the F-actin aggregates in the B8.11 cells (F’, G’). G’ is a different focus section of image with shown in G”. Arrow indicates the position of pigment cells. Arrowheads indicate the cilia of epidermal sensory neurons. Magnification of the area boxed in H’ is shown in H”. b.p., blastopore; n.p., neuropore; epi, epidermis; ec, endodermal cavity; en, endoderm; es, endodermal strand; b, brain; mu, muscle; g, germ line cells; noto, notochord; n.t., neural tube; ec, endodermal cavity; t.epi.m-l.r, tail epidermis medio-lateral row; t.epi.m.r, tail epidermis medial row; t.epi.l.r, tail epidermis lateral row; va, vacuole; p, palps. In I, embryo direction is shown by A: anterior, P: posterior, D: dorsal, V: ventral. Scale bar ⫽ 50 m.
night at 4°C or at room temperature for 1–2 hr. Embryos were then rinsed for 3 min in PBS, attached to glass slide dishes, dehydrated through an isopropanol series, and finally cleared using Murray clear, a 2:1 mixture of benzyl benzoate and benzyl alcohol.
Image Collection We collected images with a CLSM on a Zeiss LSM510 META with 40⫻ oil objective. To reconstruct the 3D images, 100 cross-section images from top to bottom per sample were acquired. In
3D IMAGING OF C. INTESTINALIS EMBRYO DEVELOPMENT 1803
Fig. 7. (Continued).
1804 HOTTA ET AL.
and discussion about the staging of C. intestinalis, S. Oda for technical support in time-lapse imaging, M. Aoki, M. Takahashi, R. Takano, and Y. Tanouchi for help on database construction, and P. Lemaire and J. S. Hwang for their critical reading of this manuscript. K.H. was supported by JSPS (18770207). This work was also supported by a grant-in-aid from MEXT. At the same time as our study, a study aimed at the stagings of tailbud embryos was performed by J. S. Joly’s group. A table with data compatible to our staging is shown in Supplemental Table 1.
REFERENCES
Fig. 8. Larva period. Stage 26 (at 17.5 hpf), Arrowheads indicate cilia from tail epidermal sensory neurons. Arrow indicates the position of pigment cells. Asterisk indicates cilia from epidermal sensory neuron in head. n.p., neuropore; epi, epidermis; en, endoderm; es, endodermal strand; b, brain; mu, muscle; g, germ line cells; noto, notochord, n.t., neural tube; ec, endodermal cavity; t.epi.m-l.r, tail epidermis medio-lateral row; t.epi.m.r, tail epidermis medial row; t.epi.l.r, tail epidermis lateral row; va, vacuole; pa, palps; at, atrial primordia. A: anterior, P: posterior, D: dorsal, V: ventral. Scale bar ⫽ 50 m.
total, over 3,500 Z-slice images corresponding to 35 developmental embryos were obtained, which allowed for overlapped developmental stages. The focus interval depends on the sample (from 0.5 to 1.2 m). Figure 1A shows an example for optical sections. The resulting stacks were then exported to a raw image series or to the
3D image data for database integration (Fig. 1C).
ACKNOWLEDGMENTS We are grateful to NIBB and NIG for facilitating parts of this work there. We thank P. Lemaire, J.S. Joly, and H. Nishida for their critical comments
Chiba S, Sasaki A, Nakayama A, Takamura K, Satoh N. 2004. Development of Ciona intestinalis juveniles (through 2nd ascidian stage). Zool Sci 21:285–298. Conklin E. 1905. The organization and celllineage of the Ascidian egg. J Acad Sci Philadelphia 1–119. Hibino T, Nishikata T, Nishida H. 1998. Centrosome-attracting body: a novel structure closely related to unequal cleavages in the ascidian embryo. Dev Growth Differ 40:85–95. Hotta K, Takahashi H, Erives A, Levine M, Satoh N. 1999. Temporal expression patterns of 39 Brachyury-downstream genes associated with notochord formation in the Ciona intestinalis embryo. Dev Growth Differ 41:657–664. Hotta K, Yamada S, Ueno N, Satoh N, Takahashi H. 2007. Brachyury-downstream notochord genes and convergent extension in Ciona intestinalis embryos. Dev Growth Differ (in press). Imai JH, Meinertzhagen IA. 2007. Neurons of the ascidian larval nervous system in Ciona intestinalis: II. Peripheral nervous system. J Comp Neurol 501:335– 352. Iseto T, Nishida H. 1999. Ultrastructural studies on the centrosome-attracting body: electron-dense matrix and its role in unequal cleavages in ascidian embryos. Dev Growth Differ 41:601–609. Iwamatsu T. 2004. Stages of normal development in the medaka Oryzias latipes. Mech Dev 121:605–618. Kimmel CB, Ballard WW, Kimmel SR, Ullmann B, Schilling TF. 1995. Stages of embryonic development of the zebrafish. Dev Dyn 203:253–310. Lein ES, Hawrylycz MJ, Ao N, Ayres M, Bensinger A, Bernard A, Boe AF, Boguski MS, Brockway KS, Byrnes EJ, Chen L, Chen L, Chen TM, Chin MC, Chong J, Crook BE, Czaplinska A, Dang CN, Datta S, Dee NR, Desaki AL, Desta T, Diep E, Dolbeare TA, Donelan MJ, Dong HW, Dougherty JG, Duncan BJ, Ebbert AJ, Eichele G, Estin LK, Faber C, Facer BA, Fields R, Fischer SR, Fliss TP, Frensley C, Gates SN, Glattfelder KJ,
3D IMAGING OF C. INTESTINALIS EMBRYO DEVELOPMENT 1805
Halverson KR, Hart MR, Hohmann JG, Howell MP, Jeung DP, Johnson RA, Karr PT, Kawal R, Kidney JM, Knapik RH, Kuan CL, Lake JH, Laramee AR, Larsen KD, Lau C, Lemon TA, Liang AJ, Liu Y, Luong LT, Michaels J, Morgan JJ, Morgan RJ, Mortrud MT, Mosqueda NF, Ng LL, Ng R, Orta GJ, Overly CC, Pak TH, Parry SE, Pathak SD, Pearson OC, Puchalski RB, Riley ZL, Rockett HR, Rowland SA, Royall JJ, Ruiz MJ, Sarno NR, Schaffnit K, Shapovalova NV, Sivisay T, Slaughterbeck CR, Smith SC, Smith KA, Smith BI, Sodt AJ, Stewart NN, Stumpf KR, Sunkin SM, Sutram M, Tam A, Teemer CD, Thaller C, Thompson CL, Varnam LR, Visel A, Whitlock RM, Wohnoutka PE, Wolkey CK, Wong VY, Wood M, Yaylaoglu MB, Young RC, Youngstrom BL, Yuan XF, Zhang B, Zwingman TA, Jones AR. 2007. Genomewide atlas of gene expression in the adult mouse brain. Nature 445:168 –176.
Nicol D, Meinertzhagen IA. 1988. Development of the central nervous system of the larva of the ascidian, Ciona intestinalis L. I. The early lineages of the neural plate. Dev Biol 130:721–736. Nicol D, Meinertzhagen IA. 1991. Cell counts and maps in the larval central nervous system of the ascidian Ciona intestinalis (L.). J Comp Neurol 309:415–429. Nishida H. 1987. Cell lineage analysis in ascidian embryos by intracellular injection of a tracer enzyme. III. Up to the tissue restricted stage. Dev Biol 121:526 – 541. Nishida H, Satoh N. 1983. Cell lineage analysis in ascidian embryos by intracellular injection of a tracer enzyme. I. Up to the eight-cell stage. Dev Biol 99:382–394. Nishida H, Satoh N. 1985. Cell lineage analysis in ascidian embryos by intracellular injection of a tracer enzyme. II. The 16and 32-cell stages. Dev Biol 110:440 –454. Pasini A, Amiel A, Rothbacher U, Roure A, Lemaire P, Darras S. 2006. Formation of
the ascidian epidermal sensory neurons: insights into the origin of the chordate peripheral nervous system. PLoS Biol 4:e225. Rembold M, Loosli F, Adams RJ, Wittbrodt J. 2006. Individual cell migration serves as the driving force for optic vesicle evagination. Science 313:1130 –1134. Satoh N. 1978. Cellular morphology and architecture during early morphogenesis of the ascidian egg: an SEM study. Biol Bull 155:608 –614. Satoh N. 1994. Developmental biology of ascidians. Cambridge: Cambridge University Press. Tassy O, Daian F, Hudson C, Bertrand V, Lemaire P. 2006. A quantitative approach to the study of cell shapes and interactions during early chordate embryogenesis. Curr Biol 16:345–358. Whittaker JR. 1977. Segregation during cleavage of a factor determining endodermal alkaline phosphatase development in ascidian embryos. J Exp Zool 202:139–153.