A Web-based Performance Monitoring System for e-Government Services Simon Fong, Ho Si Meng Department of Computer and Information Science University of Macau Av. Padre Tomás Pereira, Tapai, Macao SAR +853 3974473
[email protected] ABSTRACT An e-Government portal represents not only a reputable public image of the sovereignty of a region, it is responsible for serving many users from local citizens and beyond, in a reliable way. The requirement for robustness of e-Government portal becomes relatively stringent. In view of this, it would be very useful to have an independent server that serves as a 24/7 watch-guard to monitor the performance of the service portal. In this paper, we proposed a Web-based performance monitoring system (WMS) for checking the health status and some extras, of the service portal in real-time. Some basic server statuses are usually provided by the web hosting company at which the service portal is hosted. Usually they are simple statistics such as the number of hits and server loads over a selected period of time. Further details regarding the performance of the portal however may not be available or they come in expensive prices. This chargeable service is either by some third-party proprietary commercial software tools on the market or by provision of external analytic jobs of consultancy. In contrast, the advantages of WMS are additional performance checks and open source in Java for easy future development. It features web usage mining from web log files in addition to the computation of statistics offered by the hosting company. A higher level of analytic insights can be obtained too when the two combined. The functions of WMS include (1) Web Log Analysis, (2) Web Usability Analysis, (3) Website Performance Benchmarking, (4) Web Link Validation, and (5) Performance Reporting. WMS can be used as a generic monitoring tool for virtually all kinds of e-business models. Specifically, we discuss the context of applications of WMS to eGovernment performance models.
Categories and Subject Descriptors K.4.1-3 [Computing Milieux]: Computers and Society – public policy, social issues, organizational impacts; C.4. [Computer Systems Organization]: Performance of Systems – measurement Techniques.
Permission to make digital or hard copies of all or part of this work for personal or classroom use is granted without fee provided that copies are not made or distributed for profit or commercial advantage and that copies bear this notice and the full citation on the first page. To copy otherwise, to republish, to post on servers or to redistribute to lists, requires prior specific permission and/or a fee.
General Terms Management, Measurement, Standardization, Verification.
Performance,
Human
Factors,
Keywords e-Government, Performance Measurement, Web Monitoring
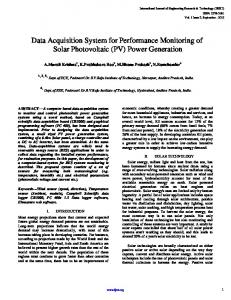
1. INTRODUCTION The initiatives of e-Government have swung into almost full actions in digitizing documents and implementing online government services in many countries in the past decades. The developments and reviews of the progresses are going in parallel in most of the e-Government strategies. On one hand, government departments and public sector agencies are seeking opportunities at their best to leverage power of internet for timely dissemination of information and provision of interactive services for citizens online. At the same time, they will have to ensure the online services are delivered accurately, efficiently, cost-effectively and robustly. Therefore it has always been a widely asked question on e-Government performance measurement: what are the best practice, appropriate models, tools and techniques for measuring, monitoring and maximizing the efficiency and effectiveness of the e-Government services? Over the years, agencies may have lacked the ability to measure whether or not their investments in eGovernment are delivering tangible returns such as cost reductions or increased efficiency and productivity. The demand for agencies to develop and implement more robust methods, processes and performance indicators for measuring the effectiveness and efficiency of their e-Government initiatives is on the rise. According to [1], monitoring is one of the four important phases, in the life cycle of e-Government projects which is a continuous circular chain of activities. Monitoring relates to optimization of services. E-government projects can take a long time to permeate. Confidence of users to transact business through the impersonal machines comes in consistent satisfaction and in time. It needs strong day-to-day monitoring. Ensuring the services are operating at its optimal, collecting usage data are prime concerns during the monitoring phase.
ICEGOV2009, November 10-13, 2009, Bogota, Colombia Copyright 2009 ACM 978-1-60558-663-2/09/11… $5.00
Figure 1. Monitoring in the e-Government project life-cycle.
The main challenge that we argue in this paper is the need of a complete monitoring model specialized in e-services. Such model would have to be technically supported by a monitoring framework of tools and algorithms. Although there are many papers in the literature advocate of models for measuring eGovernment performance, very few is focused on a performance monitoring system that is comprised of a number of practical tools and algorithms for e-Government. The main contribution of this paper is on the web-based design of a performance monitoring system, which is called WMS. The monitoring system has virtues of open-source, interoperatable, flexible and distributed. Most importantly the system serves as an underlying platform that supports the conceptual performance monitoring models on top.
information satisfaction instrument by Ives et al. (1983) [5] and a 12- item EUCS instrument by Doll and Torkzadeh (1988) [6]. In one of the early studies, Bailey and Pearson (1983) [7] developed a tool for measuring and analyzing computer user satisfaction of 39 items. This instrument included many factors ranging from information quality, systems performance, personal relationship with electronic data processing (EDP) staff and top management involvement. It is known that user satisfaction is a subjective composite criteria that is contributed by a large and complex mix of factors. In the context of e-service, we can safely assume that user satisfaction comes from the performance of the system, at least as an important factor, which in turn is derived from both the usability offered by the system and its operational performance.
The paper is structured as follow. Section 2 surveys on some related works especially those that motivated the need for an underlying support of data collection tools to conceptual performance models. Section 3 discusses the challenges involved in measuring e-services performances, and some traditional approaches. Our proposed solution, WMS model is in Section 4 where the features and technical functions are described. Section 5 relates the functions of WMS to performance measures of the website and its services and to the overall goals. A conclusion is drawn in Section 6 with a future work.
Given on hand that we have multiple criteria for evaluating an eGovernment website; some criteria may be more important than others, and the relations among the criteria may form some kinds of hierarchy of levels. E.g., response time is result of joint efforts from the efficiency of customer service and information delivery in case of e-service. A scientific model proposed in [8] uses hierarchical structure of criteria for governmental website evaluation. The work gives us insight on how the elements of a website can be decomposed into a hierarchical structure and how formulae are used to objectively calculate the scores. The contribution is limited to only a conceptual model. Therefore we see a need for an underlying monitoring system to constantly gather the data as empirical inputs in order to implement the conceptual scientific model for practical use.
2. RELATED WORKS We surveyed reports and papers both from commercial and academics, have not found any product or software system in open source, specifically for the purpose of evaluating e-Government websites performances in a distributed and automated way with a set of comprehensive features as listed in Section 4. The closest commercial software found is IBM Rational AppScan1 (formerly Watchfire) that was originally built for addressing web application security threats. AppScan scans applications, identifies vulnerabilities, and generates fix recommendations to ease remediation. This commercial tool is specialized at locating technical loopholes heuristically over a web application. It was designed in checking the technical correctness of a program, mainly on the security areas. A recent study by Li et al [2] however has found that eGovernment performance embraces issues from social dimensions, design philosophy and other non-technical aspects. Li et al, has justified that administrative culture is correlated to performance of E-Government. This finding indicates that performance is directly contributed by the services both online and offline. Though we may not be able to closely monitor the staff team's daily performance, essentially we must monitor closely of the services or the outcomes that are produced by the team. In addition to performance that is derived from quality of services, we have other non-technical aspects of measure such as User satisfaction that can be viewed as a result of good service performance cultivated consistently over a period of time. In [3], the author stated that User satisfaction has received considerable attention of researchers since the 1980s as an important proxy measure of information systems success [4]. Several models for measuring user satisfaction were developed, including the user 1
http://www-01.ibm.com/software/awdtools/appscan/
In [9], the paper has explored three interrelated questions on website effectiveness: how should it be measured; what determines it, and what effect does website effectiveness have on other important organizational activities such as overall service quality. We have confirmed that effectiveness is a relative measure determined by the referents used and the perspective of the observer. From this work, we are motivated to design a technical approach to measure website effectiveness by collecting real time data. Hence the design of WMS is made, that can be used to support a performance evaluation model where the criteria can be organized hierarchically. Thus, effectiveness can be represented as a composite form of indicator built upon multiple performance indicators at a lower level. In the social context, a paper [10] was to discuss the consequences of performance monitoring technology on public service accountability; a central but neglected issue for eGovernment. Petrakaki et al drew upon the critical literature on public service ethics in order to argue that performance monitoring technologies are likely to burden public officials’ discretion, disorient their actions and condition irresponsible practices. They argued that the performance monitoring system loaded the staff with a further concern that of being continuously monitored, measured and compared, which they took into consideration in their everyday judgment of how to act. As public service delivery is inseparable from discretion using and eGoverning is directed towards accountability, e-Governors need to conceptualize and deploy technologies in a way that do not become another concern for officials to be taken into consideration and reproduced in their practices. Hence a subtle method for collecting usage data from the e-service and website remotely, as a noninvasive approach that may relieve this problem. Our WMS was built with this in mind.
Of all the works reviewed in the literature, it is found that a technical and automated system to constantly collect usage data, convert them into performance indicators which in turn to be used in assessing e-Government performance has not been done yet. The closest system found from academia for this purpose is in [11] called E-GOVMeter which is a web crawler that samples pages of government website for analysis. WMS is designed as a system that collects most if not all the data from the server, both from the static types of data, like web structures, layout, web contents etc and from the dynamic types of data taken from operational activities. Data mining is an additional feature to WMS that widens the scope of performance indicators by providing web analytics results from the web log data.
3. E-SERVICES MEASURE An e-Government service, or simply e-service, is defined as an application, or series of applications, on the Internet that provides a specific service to citizens or businesses. The applications are either interactive or transaction based. Sometimes they can be both. From the eye of an observer, this is seen as information is collected or provided by the customer and a service is then delivered (a transaction is completed). The goal of an e-service is to provide a start-to-finish solution to the customer. As an example, a citizen is filing an income tax provides all necessary information, payment is collected, and the government delivers the service including all necessary information and receipt to the customer. Additional examples are: • e-service that allows customers to enter search criteria and then receive information from those systems; • Acquiring a permit or license by making payment online; • Purchasing goods and paying for them using an online shopping cart; • Any service that accepts an electronic payment using the payment portal.
regarded as measurement on a regular basis of the results (outcomes) and efficiency of services or programs. One may take note that the following list [12] is a classical success performance measures for traditional services provided through off-line platforms. These measures however form the basis, from which we can extend for e-services. • Input measures — the resources put into e-Government efforts such as costs and amount of time associated with staff, development, contractors, and maintenance; • Output measures — those immediate actions resulting from eGovernment efforts such as number of hits, downloads, amount of time users spend on a site, number of transactions completed, dollar amounts processed through each site, and tracking of customer requests/complaints/questions • Short-term outcomes — outcomes that are expected to lead to a desired end. These outcomes include accessibility of services, accuracy of information provided, adoption rates within specified user groups, ease of use, level of citizen satisfaction, usefulness, number of agencies participating, etc. Most of these outcomes are measured by customer surveys/feedback. • Long-term outcomes — the consequences of the program or those “end results that are sought.” These outcomes include cost savings from e-Government, staff time savings from eGovernment, and trust in government by citizens as measured by surveys. The outcomes can be more precisely translated into Response Time, Adoption Rate, Customer Satisfaction and Efficiency. All these measures can be readily gauged statistically by our proposed WMS system, except perhaps the Input measure. Response time is generally measured as the average amount of waiting time required to complete consulting a customer service representative; time taken to complete a transaction; clicks and latency spent to achieve a specific task.
Information services available on the Internet such as agency websites, downloadable forms and or documents, and search engines used primarily for the purpose of finding web content are services usually not standardized through some central authority. Standardization may be the way to go for now and in the future as one of the e-Government initiatives. The current technology platforms for supporting e-Government services are heterogeneous in nature. For an e-service to function, agencies must have a database with Internet capabilities. Each agency has its own processes and methods for developing informational eservices as well as transactional e-services.
Adoption rate is calculated by dividing the number of users or transactions completed online by the total number of customers that were served in all platforms or by other means, for a given time period.
Adoption rate is a prime performance indicator for measuring eservice. E-Government management considers an e-service successful by measuring its adoption rate. The adoption rate is the percentage of people using the e-service versus the total amount of people that use a particular government service from all service delivery methods. Other e-service success factors include revenue generated versus total production and maintenance costs, awards or national recognition, and citizen or business compliments.
Efficiency is the unit-cost ratio that is the relationship between the amount of input and the amount of output or outcome of a service. Examples are the cost of providing each service per user electronically compared to traditional methods. Efficiency is also often looked at on a cost per transaction basis. Efficiency can come in the form of improved data entry accuracy when a customer is the one entering their information into a database instead of a third party entering the data for them. If data errors are tracked, then the number of errors from the traditional service delivery can be compared to the electronic service delivery.
Public sector performance measures are typically quantitative ways of determining the resources that spend into providing services (input measures), the immediate results of those services (output measures), and the longer-term results of providing those services (outcome measures). Performance measurement can be
Customer satisfaction is the level of satisfaction with the service by the end user. Another aspect to customer satisfaction is whether there is an increase in customer service because of the eGovernment service, such as the customer being able to interact 7 days a week, 24 hours a day. Customer satisfaction is something that can be benchmarked and then trends tracked through time, although the most direct measure is by questionnaire survey.
The data for the performance measures of e-services, pertaining to the above four criteria would be supplied by Analytic Metrics (from the website) and the operational activities of the web server.
4. PROPOSED SOLUTION The proposed solution we provided is a collection of software modules that would constantly and in real-time monitor the eGovernment website in target. The data collected would be used for analysis; the analytic results would be generated as a report as well as exported to a performance evaluation system for further computation of performance indicators. It is called Web-based Monitoring Server (WMS). It helps to facilitate automated data collection for ensuring the website is in optimal operating status and for performance evaluation.
individual people – the famous “segment of one”. It provides opportunity to identify and target citizens with different needs with recommendations and better interactions. Some sample screen-shots of statistics output by the module is shown below.
Monitoring refers to the systematic collection of information to provide indications of how a program or service is performing. In this case here, the data are statues of an e-Government website on which e-services are running to interact with citizens and to handle their requests round the clock. WMS has four main modules that monitor different aspects of activities or statues of the website. They are (1) Web Log Analysis, (2) Web Usability Analysis, (3) Website Performance Benchmarking and (4) Web Link Validation. An overview of WMS in relation to the website under monitoring is depicted in Figure 2. The functionalities of each module is explained below.
Figure 3. Statistics of Web log analysis From the IP addresses of the log files and from his login accounts (which reveals its residential addresses), the module can display both propensity of the e-Government service users by regional and international. A sample is shown below: Figure 2. Web-based Monitoring Server
4.1 Web Log Analysis This module intakes web logs from the e-Government portal server and provides web statistics. Some examples are as follow: the number of visits for every page on the site, such as the top 10 popular pages. Page view trends – the hour, day, month with the most traffic to the web site. Path analysis – where visitors entered and their navigation through site from entry. Activity - visits and hits during specified times, days, duration. There are two level of analysis, one is being the straight counting for collecting the statistics of the measures, like those just mentioned. The other level is on using data mining techniques, which are known as Web Usage Mining to discover patterns from mining through large sets of history web access logs and transaction logs stored over a long period. Web usage mining techniques are applied to identify frequent item-sets, sequential patterns, clusters of related pages and association rules. The results provide useful usage profiles and insights on the behavior of the web users. The Web Log Analysis module reveals layers of information about the demand of services and contents on the web site, and the user behavior from their navigation patterns. The data collected from web sites present enormous potential for improving customer satisfaction. Personalised messages can be delivered to
Figure 4. Geographical distribution of web users
The modules are written in Java under J2EE environment2 that ensures open source, favoring flexible and easy future extensions. Our design follows the Java industry standard for implementing enterprise-class service-oriented architecture (SOA) and nextgeneration web applications. For instance, under the data mining domain, there are a number of popular and well-proven useful algorithms for discovering useful patterns. Instead of adopting any proprietary software programs which operate like a black box, we opt to implement them in Java open platform. The codes and the functions can be added or dropped as needed. This suits an application scenario where web contents and even features are complex and they dynamically evolve. A service portal of e-Government represents such scenario. In the Java Datamining package, base class is available, namely “Package javax.datamining.base” for deriving open source classes for implementing each of the data mining algorithms. An overview of the Java datamining base class is shown below in figure 5, from which popular classification, clustering and association rules tools can be inherited.
The analysis of the usage traces is commonly known as usability testing tool (Utt). Utt has its merits on working over the portal server and producing results in real-time. The online measurement is on continuous basis, whereas off-line questionnaire survey is done ad-hoc. The frequency may be up to annually such that the timeliness of the results may get compromised by a long latency in between the surveys. The objective of the web usability analysis is to test the usability and ergonomic features of the e-Government web site. Our module is implemented in two parts. One part is that we measure by relating to web log analysis which gives us insights on web user navigation patterns. The successful routes and the failed routes by which users traversed in order to get something done online, tell us about how the users are using the portal services. The other part is implemented as an Utt that is specialized for providing usability testing of websites. It allows analysts from eGovernment departments to create synthetic usability test scenario with a test case builder tool. The test scenario which are specified as testing cases, in script files are run automatically at specific times of a day. The results such as web page clicked, links clicked, time between each mouse click and total time required to complete each task, is saved in a journal file. The Utt module then analyse the journal file to find potential ‘deadlocks’ in usability of the website. For example, if a pattern of user traversing the links is detected to be circular, before reaching a goal, it may mean the user is repeatedly trying to complete a task. And if a certain portion of such patterns are observed, it may reveal a problem in the usability. This may imply some problems with the web design.
Figure 5. Package javax.datamining.base - BuildSettings
4.2 Web Usability Analysis This module measures the web usability for e-Government portal. In human-computer interaction, usability usually refers to the elegance and clarity with which the interaction with a computer program or a web site is designed. An e-Government portal is a combination of both. The e-services that are provided to the public through the portal are needed to be assured highly ‘usable’. Usability can be quantified by user-centric measures. A service's usability is high if users achieve their goals/perform their tasks in little time, do so with a low error rate, and experience high subjective satisfaction. User centric measures are usually carried out by subjective questionnaire surveys. Although some may argue that survey technique is most effective method in measuring usability, an alternative method exists that works by a web based real-time monitoring system to collect the usage traces for analysis. 2
http://java.sun.com/javaee/index.jsp
Figure 6. Format of usability test cases script files and sample The main idea of testing a web site is basically running a bunch of pre-defined tasks written in script files on a web site by a number of users and checking the time that was required to complete each of these tasks by each of the users.
4.3 Website Performance Benchmarking One of the functions of this module is stress testing. It estimates a web server performance in order to find if the server can serve sufficiently high workload. The stress tester executes benchmarks based on both Time and Request for example allowing simulation of 1000+ clients per machine. Such test can be performed at two levels: server level and individual resource level such as loading of a picture, a file, a full set of contents or dynamic data pulled from a database.
The other main function of the web benchmarking module is to monitor application performance and ensure the e-service applications are running at an acceptable level. In particular, it monitors the availability and performance of web pages of the eGovernment portal. Our monitor checks if the website pages and other resources are accessible using HTTP and HTTPS requests, from end-user perspective. When they become not so accessible, performance drops perhaps with delay in delivery, notifications are sent to the webmaster and corrective actions can be triggered. Common problems are connectivity problems, slow page load time, or content errors. A performance threshold for a web page or for access to any resource can be set, e.g. if the page load time is more than 7 seconds, some alert email or SMS sends out before it affects end users.
5. DISCUSSION In this section we discuss how the functions of WMS relate to performance measures of an e-Government portal website and its services and to the overall success goals. A portal is considered as an entry point for the different services that government agencies provide. The authors in [13] state that a web portal serves as the integrated gateway into the state government website and provides visitors with a single point of contact for online service delivery within a nation. According to this broad definition of portal, a portal is characterized by a range of complex e-services whose contents and application mechanisms may be managed by different agencies in a heterogeneous environment. Therefore performances of different sections of an e-Government portal vary. Furthermore, the challenge of measuring the “success” of an e-Government portal is complicated by a spectrum of multi-perspectives. Technical performance of a website server alone is not the only factor contributing to success of an eGovernment portal. The study in [14] found evidence of the influence of different organizational, institutional, and contextual factors on the success of e-government via an empirical investigation. As a traditional practice, e-government websites are evaluated regularly by consulting companies, international organizations and academic researchers using a variety of subjective measures [15] because of the complex and diversified nature of a service-oriented portal. In addition to subjective evaluations, we aim to improve on these evaluations by using a range of techniques from webmetric and automated performance monitoring tools.
High level e-Government Performance Evaluation Measure
Figure 7. Benchmarking the performance at sever level
4.4 Web Link Validation This module is implemented as a web crawler that traverses through every link of the website searching for broken links. This link validator automates the process of testing web site for broken elements that include broken links even those in JavaScript and Flash windows, orphaned files, and retarded pages. e-Government portal has a large set of complex e-services by many agencies. News and contents are dynamically and regularly updated by webmasters who are prone to incur human errors.
Web-based Performance Monitoring Server Performance report dated June 2009 Target
Score
Performance description
1
Web usage statistics and mining patterns
1
Web usability analysis
1
Web benchmarking analysis
1
Web Validation analysis
1
Application server
1
Proxy server
Analysts
E-Government Portal And e-service applications
WMS server
WWW
Analytic server
Monitor
Use services users Monitor Data Data
Application servers Server farm Web server
Figure 8. Snapshot of web link validation module
Figure 9. How WMS relate to high level performance evaluation
Next question is how such automated monitoring tools, WMS, can be integrated into a management-oriented performance framework that covers measures of successes of goals from different perspectives? Earlier on, the authors in [16] proposed a quantitative metric which is automatically calculated from reports of automatic evaluation tools. The performance report generated by WMS could be processed by an additional automatic evaluation tool (on key performance indicators, e.g. balanced scorecards) which calculates the impact of each criterion from the results of the WMS reports. This could be a feasible extension for WMS to incorporate automatic metrics calculation with respect to web performance indicators. A conceptual model is shown in Figure 9. There are a number of de-facto performance measurement models available which take views from multiple perspectives and considerations, e.g. a performance scorecard framework in [18]. These are not merely technical performance figures, but key performance indicators at a high level. One report called “Performance Measurement of Federal Agency Websites Web Metrics Committee of the Web Content Management Working Group, April 10, 2005” [17] by the US government agency describes a possible approach for federal agencies to develop a basic performance measurement framework for collecting and using web metrics to support their agencies’ specific missions. The goal of such a framework is to provide a holistic approach to website evaluation and assessment that integrates evaluation activities into agencies’ broader management processes. Thus, web metrics and other evaluation techniques are not considered an end unto themselves, but rather these support the “bigger picture” of agency mission, decision making, planning, and user services. The framework comprises of four main goals and a number of key metrics, and performance measures. A simplified version is shown in the table below. Essentially the key metrics can be supplied by the output of WMS who serves as a non-stop monitoring station to support a higher-level performance evaluation framework. The relations of WMS to e-services and in turn, to the “Goals” which are interpreted as qualitative measures in [17] are shown in figure 10. It shows how WMS can fit into an overall evaluation model.
Table 1. Framework for the Performance Measurement of US Federal Agency Websites Goals Reach: Key audience members recognize and are familiar with an agency’s online services.
Ratio of unique to repeat customers increases by X percent. X percent of users report having visited the website in the last week/month/year.
Relevance: Online services provide key audiences with content, services, and information tailored to their specific needs.
Number of press inquiries on topic Y increases by X percentage after press release. Number of publication downloads increases by X% per month/year. Agency website ranks in top 10 Google/Yahoo/etc search results when X is entered as keyword. Number of links-in improves by X% per month/year. Agency’s traffic exceeds that of comparator sites by X%.
Packaging: Information is provided in consistent and usable formats
X% of agency-controlled web pages use standard template. X% of agency-controlled web pages display standard branding. X% of agency web developers use content management system to create/publish content.
Access and Collaboration: Agency expertise is made available to and used by key audiences
6. CONCLUSION Performance measurement is important to e-Government efforts so that governments can track what is working and what is not and assure citizens that government’s time and funds are being well invested. Recently sector agencies reviewed their e-Government services programmes and make use of the best practice models, and techniques for measuring and monitoring their efficiency and effectiveness. There exist many webmaster tools in the market that may perform the same functions. But they are mostly proprietary solutions with limited functionalities. E.g. webhosting companies usually would provide monthly web statistics reports. In this paper, we proposed WMS which is remote, distributed and operate as a silent client tool that monitors 24/7 as a watch-guard. The output of WMS can possibly be fed as input to other agency evaluation frameworks as a whole solution. As for future work, performance indices can be assigned in the evaluation of results from WMS performance reports. A common framework for computing e-Government websites indices has been proposed [19]. By merging WMS with some e-Government index benchmarking tools it will be useful for policy makers to gauge on the success of e-Government websites and the e-services.
Performance Measures Number of user sessions increases by X% per month/year.
Quality: Agency reputation of quality is reinforced through the design, usability, and functionality of the web site.
All emails to the webmaster receive standard response within X hours. All technical inquiries to the webmaster receive detailed response within X days. All subject-oriented emails to the webmaster are routed to topical expert within X hours. Agency’s user success rate exceeds X% in usability testing. Agency’s user success rate improves by X% in annual usability testing. Broken links do not exceed X% of all links. Percentage of broken links declines by X% quarter over quarter. Server downtime does not exceed X% per month.
Operations: Online services run efficiently, smoothly and are well integrated with others
Measures of e-Services as in Figure 9.
Source: The Economic Research Service in U.S. Department of Agriculture
7. REFERENCES [1] Lea, E., Auditing e-Government Life-cycle risks and setting up a database, INTOSAI Working Group on IT Audit, 2003, 8-19. [2] Li, F., Qi, z.y., Ma, T., Effect of Administrative Culture on Performance of E-Government, In Proceedings of International Conference on Wireless Communications, Networking and Mobile Computing, (WiCom 2007), 2007, 3569-3572. [3] Tadros, I., Hammami, S., Al-Zoubi, K., Government Resources Planning and user satisfaction for Jordan egovernment, In Proceedings of 3rd International Conference on Information and Communication Technologies: From Theory to Applications, (ICTTA 2008), April 2008, 1-7. [4] Benson, D.H. A Field Study of End-User Computing: Findings and Issues, MIS Quarterly (7:4), Dec. 1983, 35-45. [5] Ives, B., Olson, M. H., Baroudi, J. L., The measurement of user information satisfaction, Communications of the ACM, 26, 10, 785-793. [6] Doll, W. J. and Torkzadeh, G., The Measurement of EndUser Computing Satisfaction, MIS Quarterly, (12:2), June, 1988, 259–274. [7] Bailey, J. E. and Pearson, S. W, Developing a tool for measuring and analyzing computer satisfaction, Communications of the ACM, (26), 785-793. [8] Fei, J., Yao, R.M., Yu, L.H., Fuzzy Analytic Hierarchy Process Application to E-government Performance Evaluation, In Proceedings of Fifth International Conference on Fuzzy Systems and Knowledge Discovery, (FSKD 2008), Volume 3, Oct. 18-20, 2008, 376-380. [9] Welch, E.W., Pandey, S., Multiple Measures of Website Effectiveness and their Association with Service Quality in Health and Human Service Agencies, In Proceedings of the 40th Hawaii International Conference on System Sciences, 2007, Jan. 2007, 107-107. [10] Petrakaki, D.I., Hayes, N., Introna, L.D., Performance Monitoring and Accountability through Technology: Egovernment in Greece, In Proceedings of the 41st Hawaii
International Conference on System Sciences, Jan. 7-10, 2008, 208-208. [11] Freire, A.P., Bittar, T.J., Fortes, R.P.M., An Approach Based on Metrics for Monitoring Web Accessibility in Brazilian Municipalities Web Sites, In Proceedings of Proceedings of the 2008 ACM symposium on Applied computing, (SAC 2008), March 16-20, 2008, Fortaleza, Brazil, 2421-2425. [12] Genie N. L. Stowers, N.L.G., Measuring the Performance of E-Government, IBM Center for The Business of Government, E-Government Series, March 2004, 1-53. [13] Gant, D. B., Gant, J. P., & Johnson, C. L, State Web Portals: Delivering and Financing E-Service. Arlington, VA, The PricewaterhouseCoopers Endowment for The Business of Government, 2002. [14] Gil-Garcˆqa, J.R., Exploring the Success Factors of State Website Functionality: an empirical investigation, In Proceedings of the 2005 national conference on Digital government research, ACM Press, Atlanta, Georgia, May 2005, 121-130. [15] Petricek, V., Escher, T., Cox, I.J., Margetts, H., The Web Structure of E-Government - Developing a Methodology for Quantitative Evaluation, In Proceedings of the 15th international conference on World Wide Web, ACM Press, Edinburgh, Scotland, 669-678. [16] Vigil, M., et. al., Quantitative Metrics for Measuring Web Accessibility, In Proceedings of the 2007 international cross-disciplinary conference on Web accessibility (W4A), ACM Press, Banff, Canada, 2007, 99-107. [17] Performance Measurement of Federal Agency Websites, Web Metrics Committee of the Web Content Management Working Group, April 10, 2005, http://www.ers.usda.gov [18] Maureen Taylor, E-BC STRATEGIC PLAN: PERFORMANCE MEASURES, Corporate Policy and Standards, Chief Information Office, Ver. 3, US, May 2003. [19] Rorissa, A., Demissie, D., Pardo, P.A., Toward a Common Framework for Computing e-Government Index, In Proceedings of the 2nd International Conference on Theory and Practice of Electronic Governance, (ICEGOV 2008), ACM Press, Cairo, Egypt, 411-416.
Figure 10. A concept of how WMS produces web metrics and other technical measures which supports measures of e-services; The e-service metrics together with web metrics in turn contribute to the high-level goals of e-Government performance framework