An online software development environment allows data sets and analyses ... Statistical analysis of codon usage remains low may be due to lack of programs ...
International Journal of Information and Computation Technology. ISSN 0974-2239 Volume 3, Number 3 (2013), pp. 147-152 © International Research Publications House http://www. irphouse.com /ijict.htm
A Web Based Software for Synonymous Codon Usage Indices Anu Sharma1, S.B. Lal2, DC Mishra3, Sudhir Srivastava4 and Anil Rai5 Centre for Agricultural Bioinformatics, Indian Agricultural Statistics Research Institute, Library Avenue, Pusa, New Delhi- 110012, INDIA.
Abstract The genetic codes have degeneracy. Most of the amino acids are encoded by more than one codon. Codons encoding the same amino acid are called synonymous codons. The patterns of codon usage vary considerably among organisms, and also among genes from the same genome. This phenomenon is known as codon biasness. Various factors contribute to codon usage biasness like gene expression level, %G+C composition, GC skewness, transcriptional selection. These factors form a pattern called synonymous codon usage pattern which explains the causes of variations present in the genes. Several indices have been used to measure the degree of non-random usage of synonymous codons in a gene. With the exponential increase in the volume of the sequence information, detailed statistical analysis of codon usage is highly desired. Complete analysis of codon usage for gene expression studies requires using many softwares and standard statistical packages for visual representation of data. Some of packages for codon usage analysis are stand alone and are not easily accessible. So, comprehensive web based software for codon usage analysis is highly required by researchers. This paper describes a web based software for analyzing the non-random usage of synonymous codons using various indices developed by researchers. This software is developed using Java, JSP, Apache Tomcat Server and MS-Access. The software will be highly useful for biologists, statisticians and computer scientist involved in biological research. Keywords: Gene Expression Identification, Indices for Codon Usage, Synonymous Codon Usage, Software, Web.
148
Anu Sharma et al
1. Introduction The spread of Internet and the growing demand of services from the web users have changed and are still changing the way to organize the work or the study. Statistical software packages have been used for decades to perform statistical analyses. Rapid advancements on the internet technology front have expanded the potential for these packages. An online software development environment allows data sets and analyses to be shared and researchers to communicate with each other quickly and conveniently. Statistical analysis of codon usage remains low may be due to lack of programs for codon usage. Many Commercial software packages available for multivariate analysis are not specifically designed to deal with the biological problems. With the advancement in web technology, it is desired to make available these analyses on the web for quick reference. This paper describes a comprehensive web solution named, WebSynCod, for synonymous codon usage analysis for gene expression identification using client-server architecture. This system can be accessed any time from arbitrary platforms through internet. It includes online analysis using of indices of codon usage. The software has been developed using three-tier client and server architecture. This software will help researchers in carrying out analysis on web.
2. Background Codon usage indices have been extensively studied in the literature for the tabulation and investigation of codon usage. Two types of codon usage indices have been constructed one for calculating codon usage deviation and second that measure codon bias towards a subset of preferred codons. Some of the indices used for codon usage deviation are P2 (Gouy and Gautier, 1982), P (Gribskov et al., 1984), GC3 (Nichols et al. 1980), GC Skew, effective number of Codon usage (ENC, Wright, 1990), relative synonymous codon usage (Sharp et al., 1986), frequency of optimal codon (Ikemura 1981), codon bias index (Benetzen and Hall, 1982) and codon adaptation index (Sharp and Li, 1987). Vetrivel, U. et al. (2007) has developed a software named ACUA (Automated Codon Usage Tool) to perform high throughput sequence analysis aiding statistical profiling of codon usage. Gupta and Ghosh (2000) have developed a non-redundant codon usage database from the complete genomes of 17 organisms. GC percentage at the coding region as well as the three different codon positions was tabulated for each organism. Nakamura et al. (1996) had developed programs that tabulate codon usage of species directly from publically available databases. John (1999) had developed software named codonW to simplify the Multivariate analysis (correspondence analysis) of codon and amino acid usage. It also calculates standard indices of codon usage. But it does not have any in-built graphics for visual representation of results. Countcodon program is web based program to count the number of codons only (http://www.kazusa.or.jp/codon/countcodon.html).codonO(2005) was written based on the C programming language to calculate synonymous codon usage order (SCUO) for each open reading frame (ORF). It is freely available from
A Web Based Software for Synonymous Codon Usage Indices
149
http://digbio.missouri.edu/,wanx/cu/codonO/. Complete analysis of codon usage for gene expression studies requires the calculation of many indices. Some of the packages available for codon usage analysis are stand alone and are not easily accessible. So, comprehensive web based software for codon usage analysis is highly required by researchers.
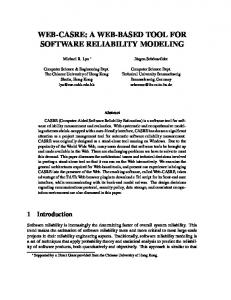
3. three-tier Architecture of Websyncod WebSYNCod is implemented as a layered structure with each layer corresponding to a different functionality. The three-tier architecture of WebSYNCod is given in Fig. 1.
Fig. 1: Three Tier Architecture of WebSYNCod. The User Interface Layer has been implemented using Hyper Text Markup Language (HTML) and JavaScript. Server Side Application Layer has been implemented using Java Server Pages (JSP). Database Layer has been implemented using MySQL.
4. Software Description The Software for Synonymous Codon Usage Analysis (WebSYNCod) has been developed for web platform and programming has been done with the JSP and Java programming language. It has been developed on Intel based computer with 166 MHzclock speed, Microsoft Windows 7 Operating System and 2.0 GB RAM. NetBeans development environment has been used as a platform for development of the software.
150
Anu Sharma et al
The Home page (Fig. 2) of the software presents the user with a brief welcome note on the software. User may create new account or may log on using the existing account.
Fig. 2: Home page of WebSYNCod. 4.1 Input data handling Sequences to be analyzed should be in a single file. A header line is defined as anyline whose first character is a right angled bracket ‘>’. There may beany number of header lines but they must precede each sequence, and the second or subsequentheader lines are ignored. Those lines whosefirst character is not‘>’ are considered to be sequence data. Sequences must be in thecorrect reading frame, and should not contain untranslated 5’ or 3’ sequence. WebSYNCod assumesthat the first character of the sequence is the first base of the first codon. The format of each line of sequence data is relaxed; sequences can be either upper or lower case characters. Input lines may be any width and contain spaces and/or numbers. Input data handlingmodule has been designed and developed for reading data for computation of WebSYNCod. Client is required to upload the input data in fasta file format or can also paste or enter the data as shown in Fig. 3.
A Web Based Software for Synonymous Codon Usage Indices
151
Fig. 3: Uploading Fasta File. 4.2 Codon Usage Indices The software provides the facility for calculation of base nucleotide composition, bases nucleotide composition at third position, GC and GC3 contents. The software also calculates Codon Adaption Index (CAI), Codon Bias Index (CBI), RSCU and frequency of optimal codons as shown in Fig. 5. Selection of some options of indices will cause the software to prompt for additional files. The indices CAI, CBI and Fop, quantify the adaptation of codon usage towards a set of optimal codons. While optimal codons are known for E.Coli and Saccharomyces cerevisiaeare in-built into software, for most species they are not known. Therefore, selecting one of these indices will cause the software to prompt for a personal choice of optimal codons.
Fig. 4: Screen Showing Codon Usage Indices.
5. Conclusion WenSYNCod provides online facility for gene expression identification using synonymous codon usage analysis after it is hosted through a web server. It can save time by doing complex calculations automatically on its own and generating results in understandable format. The software is user friendly and does not demand expertise of computer programming. User can register, login, see results and save result in Excel
152
Anu Sharma et al
file for further processing using client interface online. Administrator interface of the software helps in development and maintenance of user database.
References [1] [2] [3]
[4]
[5]
[6] [7]
[8] [9]
[10]
[11]
[12]
[13] [14]
Bennetzen, J. L., and Hall, B. D. (1982).Codon selection in yeast.Journal of BiologicalChemistry, 257, pp 3026-3031. Gouy, M., and Gautier, C. (1982).Codon usage in bacteria correlation with gene expressivity.Nucleic Acids Research, 10, pp 7055-7074. Grantham, R., Gautier, C., Gouy, M., Mercier, R. and Pave, A. (1980b).Codon catalogue usage and the genome hypothesis.Nucleic Acids Research, 8, pp 4962. Grantham, R., C. Gautier, M. Gouy, M. Jacobzone and R. Mercier, (1981). Codon catalogue usage is a genome strategy for genome expressivity. Nucleic Acids Research, 9, pp r43-r75. Gribskov, M., Devereux, J. and Burgess, R. (1984). The codon preference plot: graphic analysis of protein coding sequences and prediction of gene expression. Nucleic Acids Research, 12, pp539-549. Gupta, S. K. and Ghosh, T. C. (2000), CUCG: A non-redundant codon usage database from complete genomes, Current Science, vol. 78, no. 1. Ikemura, T. (1981a). Correlation between the abundance of Escherichia coli transfer RNAs and the occurrence of the respective codons in its protein genes: a proposal for a synonymous codon choice that is optimal for the E. coli system. Journal of Molecular Biology, 151, 389-409. John, F.P. (1999), Analysis of Codon usage, Ph.D. Thesis. Nakamura, Y., Wada, K., Wada, Y., Doi, H. and Kanaya, S. (1996). Codon usage tabulated from the international DNA sequence databases. Nucleic Acids Research, 24, pp214-215. Nichols, B., Miozzari, G., Cleemput, M. V., Bennett, G. and Yanofsky, C. (1980).Nucleotide sequence of the trpG regions of Escherichia coli, Shingelladysenteriae, salmonella typimurium and Serratiaamrcescens.Journal of Molecular Biology, 142, pp503-517. Sharp, P. M., Tuohy, T. M. F. and Mosurski, K. R. (1986). Codon usage in yeast cluster-analysis clearly differentiates highly and lowly expressed genes. Nucleic Acids Research, 14, pp5125-5143. Sharp, P. M., and Li, W. H. (1987a).The codon adaptation index - a measure of directional synonymous codon usage bias, and its potential applications.Nucleic Acids Research, 15, pp1281-1295. Vetrivel, U., Arunkumar, V. and Dorairaj, S. (2007). ACUA: A software tool for automated codon usage analysis. Bioinformation, 2(2), pp62-63. Wright, F. (1990). The effective number of codon used in a gene. Gene, 87, pp23-29.