Available Available online online at at www.sciencedirect.com www.sciencedirect.com
Procedia Engineering 00 (2011) 000–000 Procedia Engineering 14 (2011) 141–147
Procedia Engineering www.elsevier.com/locate/procedia
The Twelfth East Asia-Pacific Conference on Structural Engineering and Construction
A Web Service Framework for Measuring and Monitoring Environmental and Carbon Footprint in Construction Supply Chains J. C. Chenga 1
Department of Civil and Environmental Engineering, the Hong Kong University of Science and Technology, China
Abstract There is increasing demand for the measurement and accounting of the environmental and carbon footprint produced by corporate companies. In construction processes, environmental impacts accumulate along supply chains from raw material extraction, manufacturing, distribution, installation, maintenance, to demolition and disposal. The calculation of the environmental and carbon footprint of a construction project considers not only the emissions from contractors on site, but also those from the participating members along the supply chains. However, construction supply chains are characterized by their high fragmentation. It is not an easy task to measure and collect loosely distributed footprint data among numerous supply chain members. In addition, due to the project-based temporary nature of construction supply chains, it is unlikely for project participants to work together long enough on a project to build enough trust and to share information willingly. Therefore, a flexible, secure, and scalable support system is needed to measure and manage environmental and carbon footprint data in construction supply chains. This paper presents a web service collaborative framework for measuring, monitoring, and integrating environmental and carbon footprint data in construction supply chains. Web services technology is used because its “plug-and-play” capability allows flexible and quick system reconfiguration, which is desirable for communication and collaboration in construction supply chains. In the framework, each process element and footprint calculation is represented and delivered as individual web service units, which can be reused and integrated over standard web service protocols. This paper also presents an illustrative example to demonstrate the implementation of the web service framework.
© 2011 Published by Elsevier Ltd Keywords: Web services technology, environmental and carbon footprint, performance monitoring, construction supply chains.
a
Corresponding author: E-mail address:
[email protected]
1877–7058 © 2011 Published by Elsevier Ltd. doi:10.1016/j.proeng.2011.07.016
142 2
1.
Author name/ Procedia / Procedia Engineering (2011) 000–000 J.C. Cheng Engineering 1400 (2011) 141–147
Introduction
There is increasing demand for the measurement and accounting of the environmental and carbon footprint produced by corporate companies. Different methods to reduce the emissions of pollutants have been proposed in various countries. In June 2009, for example, the US House of Representatives passed the American Clean Energy and Security Act which is also referred as the cap and trade bill. Ecotax and carbon tax are also suggested to promote activities with low environmental impacts. These emission reduction methods require accurate measurement and accounting of the environmental and carbon footprint of different industrial activities. In construction activities, environmental impacts accumulate along supply chains from raw material extraction, manufacturing, distribution, installation, maintenance, to demolition and disposal. The calculation of the environmental and carbon footprint of a construction project considers not only the emissions from contractors on site, but also those from the participating members along the supply chains. Therefore, a holistic cradle-to-grave view of supply chain processes is needed when measuring and monitoring the green performance of construction activities. In the construction industry, various researchers have developed conceptual frameworks and systems for performance measurement and monitoring. Kagioglou, Cooper, and Aouad (2001) presented a conceptual framework for project performance measurement based on the balanced scorecard (BSC), which was introduced by Kaplan and Norton (1992); the framework measures performance from four perspectives: financial, customer, internal business processes, and learning and growth. Also based on BSC perspectives, the framework developed by Yu et al. (2007) measures performance at the company level instead of at the project level. Cheung, Suen, and Cheung (2004) presented a web-based construction project performance monitoring system (PPMS) which leverages the Internet and database technologies. Most of these research efforts on the performance management in construction focus on performances at the project level. Study on the performance management of construction supply chains is relatively lacking. Building a supply chain performance monitoring system is a non-trivial task because it involves understanding and integration across organizational boundaries. Integration and collaboration are particularly challenging in the construction industry because information is often scattered among highly fragmented project participants. In addition, the relationship between members in construction supply chains is project-based and fast changing. Project participants often do not work together long enough on a project to build enough trust and to share information willingly. Current solutions for crossorganizational integration and collaboration also are not flexible enough to adapt frequent changes. Utilizing the Internet as the communication network, the web services technology has emerged as a promising tool to integrate distributed information sources and software functionalities in a flexible, scalable, and reusable manner. This paper presents a web service collaborative framework for measuring, monitoring, and integrating environmental and carbon footprint data in construction supply chains. An illustrative example of the framework is also discussed in the paper. 2.
Prototype Web Service Framework for Green Performance Monitoring Of Construction Supply Chains
Web services technology is used because its “plug-and-play” capability allows flexible and quick system reconfiguration, which is desirable for the integration and collaboration of fragmented construction supply chain members. Distributed information sources and software functionalities can be encapsulated and delivered as discrete web service units, which can be located and invoked using well established Internet protocols and machine readable representations. Users can easily combine and
J.C. Cheng / Procedia Engineering 14 (2011) 141–147 Author name / Procedia Engineering 00 (2011) 000–000
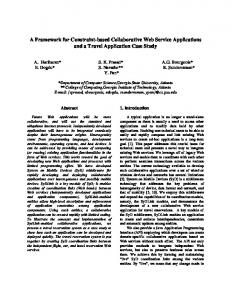
customize web service units into complex web service units to perform different tasks. Web service units can also be reused in different processes to minimize implementation efforts. Web services are selfcontained in that the application using the web services does not need to depend on anything other than the services themselves. They are also self-describing in that all the information on how to use the services can be obtained from the services themselves. This section describes a prototype web service framework that the author designed and developed for measuring and monitoring environmental and carbon footprint in construction supply chains. The system architecture of the prototype framework is shown in Figure 1. In the framework, each process element and footprint calculation is represented and delivered as individual reusable web service units. These web service units were deployed in SC Collaborator (Cheng 2009), which is a web service system framework for construction supply chain collaboration and management. The SC Collaborator system consists of an access control engine, a database support, a communication layer, a portal interface layer, a business application layer, and an extensible computing layer. The major components of the prototype green performance monitoring framework are discussed in the following subsections. 2.1 Portlet-based user interface The SC Collaborator system leverages web portal technology to provide a secure and customizable user interface. It can ensure that the right information is exposed and delivered to the right people at the right time. Through the web portal platform, distributed information and applications become available in a single point of access regardless of their location or storage mechanism. A portal platform consists of a unified user interface and a number of application portlet units, which are managed and accessed via the portal user interface. In each individual application portlet unit, web service units are connected, integrated and orchestrated into various workflows to perform different business tasks. Web service units can be reused in different workflows or reused multiple times in the same workflow. In addition, modification of system functionalities becomes easy and quick as every business process is divided into separate atomic reusable web service components. In SC Collaborator, web service composition and orchestration are performed using open source technology Apache ODE (Apache Software Foundation 2008) and open web service standard Business Process Execution Language (BPEL) (OASIS 2007). SC Collaborator System
App 3
App 2 Wrapper
Footprint Footprint Calculator 1 Calculator 1 Wrapper
App 1
Wrapper Web services Wrapper WSDLWeb services Web services WSDL
WSDL
SOAP
Wrapper
Web service
Supporting Web Service Units
Web service
WSDL
WSDL
Data Collector Wrapper
Web service SOAP
WSDL
BPEL BPEL
Application Portlet Unit Portlet gateway
Application Portlet Unit Portlet gateway
SC Collaborator User Interface
BPEL
Portlet Integration
Application Portlet Unit
Portlet gateway
Centralized System Management and User Interface
Figure 1: System architecture of the prototype web service performance monitoring framework.
143
3
144
J.C. Cheng / Procedia Engineering 14 (2011) 141–147 Author name / Procedia Engineering 00 (2011) 000–000
4
2.3 Process web service units Business processes are decomposed into separate process elements, which represent particular application functions and are wrapped into reusable standardized web service units. Each web service unit is associated with a Web Service Description Language (WSDL) (W3C 2007) file, which describes the schema, functions and location of the web service unit. The WSDL files provide the BPEL models in application portlet units with the information on how to invoke a specific function of the connected web service units. The BPEL models read the information from the WSDL files and invoke the corresponding web service units using the Simple Object Access Protocol (SOAP) (W3C 2003). 2.4 Footprint calculation web service units Emission and wastes reporting and calculation functions are also wrapped into standardized web service units. Environmental and carbon footprint can be calculated using different methods and equations. Each calculation method is deployed as a web service unit which can be selected, reused, and combined according to the users’ preferences. For example, the carbon footprint can be obtained directly from the measurement of actual carbon emissions, or indirectly from calculation based on energy consumption, fuel type and consumption, and process throughput. Using the carbon footprint model developed by Defra (2009), carbon footprint can be calculated indirectly from the energy consumption as:
= Carbon Footprint Energy consumption × Conversion factor
(1)
where the conversion factor is given in the Defra’s guidelines (Defra 2009). For example, the conversion factor for coal is 0.32937 kg CO2eq per kWh. Therefore, the carbon footprint due to the consumption of 100 kWh of energy generated by coal is calculated as 329.37 kg CO2 equivalent. Carbon footprint can also be calculated from the gas emissions to air using the Global Warming Potential (GWP) factors (IPCC 1990). GWP is a measure of the relative radioactive effect of a greenhouse gas compared to carbon dioxide, integrated over a chosen time horizon. McCarthy (2001) provides procedures for calculating the GWP factors, which are based on an assessment report released by Intergovernmental Panel on Climate Change (IPCC). Calculation of carbon footprint using GWP factors is given as:
Carbon Footprint = Gas Emission × GWP Factor
(2)
For instance, the GWP factors for methane over 20 years and over 100 years are 72 and 25, respectively. Therefore, the carbon footprints due to the emission of 8.3 kg of methane are calculated as 597.6 kg CO2 equivalent over 20 years and 207.5 kg CO2 equivalent over 100 years, respectively. 3.
Demonstrative Example of the Monitoring Framework
The footprint data reporting application portlet unit in the prototype monitoring framework is demonstrated in Figure 2, with enumerated numbers showing the steps to data reporting. To report the footprint data using the application portlet, a user needs to log in the system. The system recognizes the organization of the user and provides a customized layout and access rights. Second, the user selects a particular construction process element before reporting is enabled. Third, the user enters the green performance metrics data whichever are available. Fourth, the user clicks the “Report” button to submit the data for the back-end operations and storage. These values are stored in a centralized database and can
J.C. Cheng / Procedia Engineering 14 (2011) 141–147 Author name / Procedia Engineering 00 (2011) 000–000
be retrieved conveniently. A user can log into the system and reviews or updates these performance values. Eventually, the aggregate footprint values for a particular supply chain member or for the entire supply chain can be monitored and evaluated on a product basis. This information helps the identification of supply chain components with high footprint, planning and re-engineering of supply chain operations, and selection of supply chain members.
Figure 2: Footprint data reporting web portlet which internally calculates and records the environmental and carbon footprint in a construction supply chain.
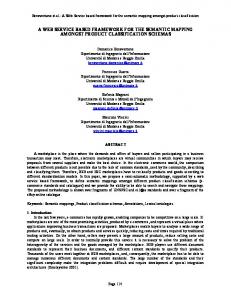
Figure 3 shows an example of monitoring and reporting the green performance of the process element “M1.3 Produce & Test” of a mill called “Mill A” in a structural steel supply chain. For a steel mill, the process “Produce & Test” refers to the production process of steel materials. The environmental footprint is calculated from the data of solid waste generated, liquid waste emitted to water systems, and gas emissions to air, which are inputted by the users on the right hand side of the portlet unit. Using Defra’s carbon footprint model and GWP factors, the carbon footprint in a particular construction process element is calculated from the data of energy consumption and gas emissions to air given by the users. The energy consumption and emissions data used in this example are calculated with reference to the European Union Lifecycle Assessment (EU LCA) Dataset, which are available at http://lca.jrc.ec.europa.eu/lcainfohub/datasetArea.vm. Using Equation (1) for each of the energy consumption data on the left hand side of the portlet and Equation (2) for each of the emissions to air data on the right hand side of the portlet, the total carbon footprint for the process element “M1.3 Produce & Test” of Mill A can be calculated and recorded.
145
5
146
J.C. Cheng / Procedia Engineering 14 (2011) 141–147 6
Author name / Procedia Engineering 00 (2011) 000–000
Figure 3: Footprint data reporting web portlet which internally calculates and records the environmental and carbon footprint in a construction supply chain.
4.
Conclusions
This paper has presented and illustrated a prototype web service framework for measuring and monitoring environmental and carbon footprint data in construction supply chains. The framework aims to provide a green performance management system that is flexible to adapt the changing environment in construction supply chains and extensible to include a wide variety of green performance metrics and calculation approaches. In the future, the author will attempt to integrate the prototype monitoring framework with performance sensors so that data collection and processing can be automated. Such an integrated system can not only minimize data input errors but also enable real-time alert and decision support for green construction supply chain management. References [1] [2] [3] [4] [5] [6]
Apache Software Foundation. Apache Orchestration Director Engine (ODE), 2008. Cheng JCP. SC Collaborator: A service oriented framework for construction supply chain collaboration and monitoring. Ph.D. thesis, Department of Civil and Environmental Engineering, Stanford University, 2009. Cheung SO, Suen HCH, and Cheung KKW. PPMS: a web-based construction project performance monitoring system. Automation in Construction, 13(3), pp. 361-376., 2004. Defra. Guidelines to Defra / DECC's GHG Conversion Factors for Company Reporting. UK Department for Environment, Food and Rural Affairs, London, 2009. The Intergovernmental Panel on Climate Change (IPCC). Climate Change: The Intergovernmental Panel on Climate Change Scientific Assessment, Cambridge University Press, Cambridge, UK, 1990. Kagioglou M, Cooper R, and Aouad G. Performance management in construction: a conceptual framework. Construction Management and Economics, 19(1), pp. 85-95, 2001.
J.C. Cheng / Procedia Engineering 14 (2011) 141–147 Author name / Procedia Engineering 00 (2011) 000–000 [7] [8] [9] [10] [11] [12]
Kaplan RS and Norton DP. The balanced scorecard: measures that drive performance. Harvard Business Review, 70(1), pp. 71-79, 1992. McCarthy JJ. Climate change 2001: impacts, adaptation, and vulnerability: contribution of Working Group II to the third assessment report of the Intergovernmental Panel on Climate Change (IPCC), Cambridge University Press, 2001. Organization for the Advancement of Structured Information Standards (OASIS). Web Services Business Process Execution Language (WS-BPEL), Version 2.0, 2007. World Wide Web Consortium (W3C). Web Services Description Language (WSDL), Version 2.0, http://www.w3.org/TR/wsdl20/, 2007. World Wide Web Consortium (W3C). Simple Object Access Protocol (SOAP), Version 1.2, http://www.w3.org/TR/soap12part1/, 2003. Yu I, Kim K, Jung Y, and Chin S. Comparable performance measurement system for construction companies. Journal of Management in Engineering, 23(3), 2007, pp. 131-139.
147
7