pean project AIM for the design of a system based on wire- less sensor networks
to ... In order to show how the proposed automation system works during the
demo .... operating system for wireless embedded devices with reduced
computation.
A Wireless Sensor Network based System for Reducing Home Energy Consumption Antimo Barbato
Luca Borsani
Antonio Capone
Politecnico di Milano Milano, Italy
Politecnico di Milano Milano, Italy
Politecnico di Milano Milano,Italy
[email protected]
[email protected]
[email protected]
ABSTRACT In this paper we present a work in progress within the European project AIM for the design of a system based on wireless sensor networks to save energy in home environments.
1.
INTRODUCTION
According to recent studies [3] energy consumptions are increasing year after year, and if effective energy saving policies will not be adopted, in 2030 they will rise by 28% on 2006 value. The residential sector, in particular, accounts for an increasing percentage of the total consumption which is now above 27.5% (source Earthtrends). These predictions have recently drawn the attention of the research community as well as of the industry world to a new generation of home automation systems for energy saving ([6], [4]). In this paper, we present an integrated system currently under development within the European project AIM [1], for profiling and reducing home energy consumption. We focus, in particular, on the key role played by wireless sensor networks to automatically control home appliances according to users habits. To create a system where user doesn’t need to waste a lot of time in complex settings of system parameters, one of the challenges of AIM project is to automate the set up of a part of these parameters with a system able to predict actual user preferences on the basis of previous observed behavior. This is the main role of the sensor network that senses physical parameters estimating user behavior for future periods and adjusting prediction in real time. On the basis of this information the AIM system is able to best schedule tasks for every appliances, for example heating the room at the desired temperature before the user come in. In order to show how the proposed automation system works during the demo session where the real home devices will not be available, we also implemented an application software that can be used to create some virtual devices (e.g. air conditioners or lighting systems) simulating the home environment.
2.
WIRELESS SENSORS FOR SMART ENERGY MANAGEMENT
In the AIM architecture, the wireless sensor network (WSN) provides the basic tools for gathering information on user behavior and his interaction with home appliances. Moreover, the WSN provides measurements of some physical parameters like temperature and light that can be used by the system to perform some automatic adjustment of the energy management system. For this purpose we implemented a hierarchical hybrid network architecture called MobiWSN
[5]. This architecture is composed by heterogeneous islands of sensor nodes (using IEEE 802.15.4 technology) with each of them created defining a tree network topology. Each island is managed by a Gateway and is able to communicate with it using a stateless protocol we called Information Exchange Protocol (IEP). The MobiWSN Gateways are interconnected using a mesh configuration to ensure reliability and resilience to failure, and can communicate with an additional node, called Manager, that is in charge of managing network creation and reconfiguration. The MobiWSN architecture, besides providing measurements of physical parameters like temperature and light, is also able to detect user presence in each room of the house. This functionality has been achieved defining a specific protocol that we called infrared-based Presence Detection System (i-PeDS), based on Passive InfraRed (PIR) sensors.
3. USER PROFILING The basic function of the user profile is the characterization of users behavior so that some settings of the energy management system can be made automatically. For this reason we used the MobiWSN architecture for monitoring environmental parameters, such as user presence, temperature and light. This information is aggregated and processed in order to create three different types of profile (user presence profile, temperature profile and light profile) that represent users habits. In the user presence profiling (the same can be said of temperature and light profiling) the sensor network collects 24 hour information (here called “daily profile”) about users presence/absence in each room of the house in a given monitoring period (i.e. week, month). At the end of the monitoring time the cross-correlation between each couple of 24 hour data presence is computed for each room of the house in order to cluster similar daily profiles. In particular, daily profiles y(t) and x(t) are said similar if: r(x, y) >
1−A [r(x, x) + r(y, y)] 2
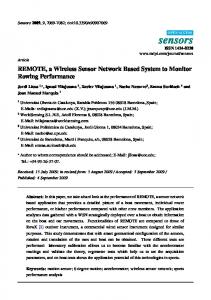
Where r(x, y) is the mean value of the cross-correlation between signals x(t) and y(t) calculated with an accepted delay of ±B (in minutes), A and B are constants (respectively equal to 0.12 and 10 in our numerical results). For each cluster the average of the daily profiles identifies a final presence profile that provides the 24 hour probability distribution of the user presence in the room the cluster is associated with (Figure 1). At the end of calculation a matrix is generated where each room is associated with a column that represents the sequence of presence profiles identified in
Final Presence Profile
User Presence Probability
1 0.8 0.6 0.4 0.2 0 0
2
4
6
8
10 12 14 Day Time [hours]
16
18
20
22
24
Figure 1: Example of final presence profile. the monitoring period. Each matrix column is statistically elaborated in order to predict the presence profile in a given day, for each room, on the basis of the observed profiles in the past days. For room i, for example, the prediction algorithm performs:
present an example of the automatic temperature management benefits. The management system allows some energy savings turning off the cooling system of the rooms that are not required to be air conditioned because the user will not enter those rooms with high probably and turning it off in the whole house if the user is not present and probably will not return for a long time. In contrast, in the “classical scenario” the cooling system is supposed to be On in all rooms and to be preprogrammed from the user to approximately follow his daily/weekly schedules. In the simulation performed, the home temperature management has reduced the working time of the cooling system by nearly 28 percent. Daily Cooling System Working Mode Cooling System is On
User Presence Cooling system working mode
63.02 minutes
253.15 minutes
User is Present
1) for each presence profile j in the selected column, the probability that it occurs after the sequence of profiles of the past M days in room i (with M = 1) is calculated; 2) if a profile j exists with such a probability higher than a threshold (experimentally set to 0.75), the algorithm stops and j is the predicted profile; otherwise M is increased by 1 and the algorithm goes back to step 1. The prediction algorithm provides presence, temperature and light profiles for each day of the year. Obviously users habits are only partially predictable. For this reason the system has to be able to detect exceptions in the user behavior and to adjust missed predictions. For this purpose we implemented a specific algorithm, called Updating Algorithm, that uses real time data provided by the sensor network to dynamically update the predicted profiles during the day.
4.
NUMERICAL RESULTS
As previously mentioned, we implemented a prototype version of the proposed sensor network architecture for energy management. However, to evaluate the performance of the user-habits prediction algorithms we have been forced to rely on simulation mainly because of the long period of time required for testing them in a real environment. The system has been tested referring to a five room house with a simulating period of 300 days, creating a realistic sequence of daily presence, light and temperature profiles. The presence prediction algorithm has been simulated in three user behavior exceptions cases: exceptions spike (there are 20 isolated exceptions in the users behavior), exceptions burst (there are 4 sequences of 4 contiguous exceptions) and behavior variation (user changes his behavior two times during the year). The results of the 300 days simulation are presented in Table 1. Exceptions Spike Exceptions Burst Behavior Variation
1 88.00% 94.00% 90.00%
2 90.33% 92.00% 91.00%
Room 3 87.67% 93.67% 90.00%
4 88.67% 91.67% 91.67%
5 87.00% 93.33% 90.67%
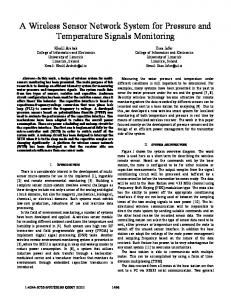
Table 1: Percentage of correctly predicted profiles for each room of the house. The presence, temperature and light profiles can be used to optimize the using time of home appliances and to minimize the home energy consumption. In Figure 2 and 3 we
Cooling system working time = 316.17 minutes User is Absent/ Cooling System is Off 0
2
4
6
8
10 12 14 16 Day Time [hours]
18
20
22
24
Figure 2: Room 3 daily cooling system working mode without home automation Daily Cooling System Workig Mode Cooling System is On
User Presence Cooling system working mode
63.21 minutes 63.15 minutes 73.13 minutes
User is Present Cooling system working time = 199.45 minutes User is Absent/ Cooling System is Off 0
2
4
6
8
10 12 14 16 Day Time [hours]
18
20
22
24
Figure 3: Room 3 daily cooling system working mode with home automation
5. DEMO APPLICATION AND SETUP In our implementation of the sensor networks described in Section 2 we use Crossbow Micaz and iMote motes [2] equipped with Crossbow MTS300 and IMB400 sensor boards that provide temperature, light and motion information. One of these sensors is connected to a PC and works as a gateway. We developed our network application under TinyOs, a free and open source component-based operating system for wireless embedded devices with reduced computation and memory capabilities. We further implemented a Java Application that we called Home Virtualization Application (HVA) with a friendly graphical user interface (Figure 4). The HVA is used to implement some virtualized devices (e.g. air conditioners, lighting systems, TV, WiFi routers) and to show how information provided by the MobiWSN platform can be used to automatically and best control home appliances according to users habits. The HVA graphical interface is structured so that data can be showed through two main panels: House panel and Room panel. The first one represents the house map and some house information while the second panel is composed by a 3D animated image associated with the selected room and four java panels:
6. CONCLUSION
Figure 4: HVA Graphical User Interface
In this paper we presented a home energy management system under development within the European project AIM. We proposed a heterogeneous hierarchical sensor network architecture to gather physical parameters and to monitor user behavior. Data collected by the sensors are used to create user profiles. Based on user profiles and real-time information provided by the system, we can predict user behavior and optimize the energy consumption automatically controlling home appliances. We proposed a new approach to implement a self adaptive prediction algorithms to set several parameters (light intensity, temperature, etc.) according to user estimated preferences. The presented solution is simpler than other profiling systems, mentioned in Section 1, which rely on complex learning techniques: just replicating a previously observed set up that satisfied the user in a similar context provides good results. We implemented a prototype version of the proposed sensor network architecture and simulated our prediction algorithms over long time periods showing their effectiveness in estimating users behaviors. In order to show how the system works even if the real home devices are not available, we also implemented an application that is used to create virtual devices. Moreover, a prototype of the whole AIM system has been realized with the collaboration of the other partners of the project and it is actually under test in different real use case scenarios.
7. REFERENCES (a)
(b)
Figure 5: HVA Devices and Presence Panels
• Information Panel: shows information (temperature, light, user presence and power consumption) provided by sensors located in the selected room; • Room Devices Panel: shows the virtualized devices located in the selected room and their status (Figure 5(a)); • Consumption Panel: represents the consumption chart of the selected room for the current day; this chart is computed using the devices status information and consumption data; • Presence Panel: represents the predicted presence profile and the daily presence profile of the selected room for the current day (Figure 5(b)). The demonstration will show how the AIM automation system uses information provided by the sensor network to automatically control home appliances. During the demonstration five sensors will be deployed in the demo room and the HVA application will be launched supposing that the monitored house is composed by one room only (the demo room itself). The conference attendees must stand in front of the PC where it’s possible to see how the virtualized devices are controlled based upon real-time data provided by the sensors (e.g when the sensors detect users presence the automation system will switch on the virtual air conditioner to bring the temperature to the desired value).
[1] Aim project. http://www.ict-aim.eu/. [2] Crossbow. http://www.xbow.com/. [3] U. S. Department of Energy. Buildings energy data book, 2008. [4] H. Hagras, V. Callaghan, M. Colley, G. Clarke, A. Pounds-Cornish, and H. Duman. Creating an ambient-intelligence environment using embedded agents. IEEE Intelligent Systems, pages 12–20, 2004. [5] A. Laurucci, S. Melzi, and M. Cesana. A reconfigurable middleware for dynamic management of heterogeneous applications in multi-gateway mobile sensor networks. Demo presented at IEEE SECON, Rome (Italy), 2009. [6] V. Singhvi, A. Krause, C. Guestrin, J. Garrett Jr, and H. Matthews. Intelligent light control using sensor networks. In Proceedings of the 3rd int. conference on Embedded networked sensor systems. ACM, 2005.