IEEE TRANSACTIONS ON INSTRUMENTATION AND MEASUREMENT, VOL. 58, NO. 5, MAY 2009
1405
A Wireless Sensor Network for Cold-Chain Monitoring Alessio Carullo, Simone Corbellini, Marco Parvis, Fellow, IEEE, and Alberto Vallan
Abstract—This paper deals with a wireless sensor network that was specifically designed to monitor temperature-sensitive products during their distribution with the aim of conforming to the cold-chain assurance requirements. The measurement problems and the constraints that have been encountered in this application are initially highlighted, and then, an architecture that takes such problems into account is proposed. The proposed architecture is based on specifically designed measuring nodes that are inserted into the products to identify their behavior under real operating conditions, e.g., during a typical distribution. Such product nodes communicate through a wireless channel with a base station, which collects and processes the data sent by all the nodes. A peculiarity of the product nodes is the low cost, which allows the information on the cold-chain integrity to be provided to the final customer. The results that refer to the functional tests of the proposed system and to the experimental tests performed on a refrigerated vehicle during a distribution are reported. Index Terms—Microcontrollers, radio communication equipment, temperature control, temperature measurement, transducers.
I. I NTRODUCTION
this chain, and the final distribution often requires the use of refrigerated vehicles. While the temperature is easily controlled and monitored in the factory plants, the refrigerated vehicles can be a crucial point in the whole chain since the products may undergo transient conditions during the loading operations or even during the whole transport process with great risk to the integrity of the goods. The refrigerated vehicles have to satisfy some thermal requirements, which are mainly related to the insulation and refrigeration capabilities, but this does not assure product integrity because of the unpredictable conditions that may occur during the transportation and that could cause a significant change in the product temperature. The only reliable way of verifying the real integrity of the cold chain consists of monitoring the temperature of the products during their distribution. However, this task is not simple since the products are often packed in small containers that cannot individually be monitored due to both the cost and the logistical problems. In this paper, the authors analyze the problems related to coldchain assurance and propose a measuring system that is suitable for this task.
M
ANY kinds of products have to be handled under controlled environmental quantities, such as temperature, humidity, vibrations, and exposure to light. Among these parameters, the temperature is usually a major concern due to its huge variety of effects. For example, if the temperature of some chilled foods exceeds specific limits, a great decrease in quality, along with an increase in the risk of food poisoning, can occur. The limits can be quite strict for chilled products with a storage temperature near 0 ◦ C, where a rise in temperature of just a few degrees could cause microbial growth. The situation is more serious in the case of pharmaceutical products since an uncontrolled change in the temperature, even for short time intervals, could cancel the effectiveness of the product or even make it dangerous. The chain that brings the temperature-sensitive products from the factory to the consumer through an uninterrupted series of steps under a controlled temperature is usually called the “cold chain.” The goods follow complex logistic paths along
Manuscript received June 27, 2008; revised October 14, 2008. First published December 22, 2008; current version published April 7, 2009. This work was supported in part by Regione Piemonte, Italy, as part of the research project B70 “Bando Ricerca scientifica Piemonte 2004.” The Associate Editor coordinating the review process for this paper was Dr. Cesare Alippi. The authors are with the Dipartimento di Elettronica, Politecnico di Torino, 10129 Torino, Italy (e-mail:
[email protected]). Color versions of one or more of the figures in this paper are available online at http://ieeexplore.ieee.org. Digital Object Identifier 10.1109/TIM.2008.2009186
II. M EASUREMENT I SSUES Most delivery companies transport temperature-sensitive goods by using specialized vehicles, such as adiabatic boxes, and by monitoring air temperature inside these vehicles by means of either data loggers or smart sensors [1], [2]. Unfortunately, in the presence of perturbations, air temperature is not representative of all the products due to the temperature gradients within the vehicle and the different thermal behaviors of the different goods, which is mainly related to their nature and packing. Examples of perturbations that the goods are subjected to during the distributions are the following: 1) loading and unloading of the goods, which are usually packed in groups, e.g., on pallets; 2) changes in the air flux due to changes in the pallet arrangement; 3) temporary interruptions of the refrigeration function; 4) the presence of a localized heat source inside the vehicle; 5) temporary opening of the vehicle doors during the unloading of the goods. An effective monitoring could, therefore, be performed by taking such phenomena into account by using a suitable thermal model. Examples of models of refrigerated vehicles are available in the literature, e.g., that obtained on scaled versions of the vehicle [3], but in this case, the identification of a model that describes the behavior of the packed goods is also required. Another way of monitoring the cold-chain integrity consists of
0018-9456/$25.00 © 2008 IEEE
1406
IEEE TRANSACTIONS ON INSTRUMENTATION AND MEASUREMENT, VOL. 58, NO. 5, MAY 2009
Fig. 1. Architecture of the system proposed for the monitoring of temperature-sensitive products inside a refrigerated vehicle.
measuring the temperature of the delivered products, although a series of constraints has to be taken into account. 1) The measuring system cannot make use of wires since each sensor should be able to move independent of the others and the system itself should not interfere with the distribution process. 2) Each sensor has to meet the requirements imposed by the local regulations in terms of uncertainty and resolution (as an example, the European standard EN 12830 [4] requires a lower uncertainty than 1 ◦ C and a resolution of 0.5 ◦ C). 3) Each sensor has to be cheap, thus making the recovery of the sensors unnecessary. If this condition is met, the sensors could also be used to provide information about the integrity of the cold chain to the final customers. 4) The measuring system has to be able to manage a dynamic configuration of the sensors since some monitored products can be unloaded from the vehicle during the delivery. 5) The measuring system must be able to quickly estimate the status of the cold chain, highlighting whether the chain is at risk or has been compromised. The definition of “chain at risk” and “compromised chain” depends on the transported goods, but regulations often consider a chain compromised if any of the goods go above a specific threshold at any time. Such constraints have stimulated the authors to consider that one solution for the considered problem could be the employment of a wireless sensor network (WSN), which employs sensor nodes that are configured to monitor the temperature of the delivered products. Several works in the literature deal with WSNs for temperature monitoring [5]–[9], but most of them rely on general-purpose commercial products that are configured to meet the requirements of the specific applications, thus not satisfying the cost constraint. Some solutions are instead based on specifically developed nodes, such as that described in [5], which employs a low-cost wireless thermocouple node. However, the shape and size of such nodes are not suitable for integration with the monitored products, and the power consumption is too high, thus leading to frequent battery changes.
Off-the-shelf products that are available for temperature monitoring (e.g., [10]–[12]) suffer from the previously mentioned problems. They are expensive general-purpose devices that are not suitable for integration with the monitored products. An interesting solution from Crossbow could be the Mica2Dot system, which is a wireless node of a circular shape with a diameter of 2.5 cm. Each node can suitably be configured by assembling a processor/radio module with different sensor and data-acquisition modules, which are designed to be stacked both above and below the processor/radio module. Apart from the need to customize the node for the specific application, the cost of a complete node and of a receiving node could reach 100 euros, and the power consumption is not optimal, as shown in the next section. Similar considerations hold for other circular-shaped mote platforms such as small autonomous network devices (SAND), which is now under development at Philips Research Laboratories [13]. For these reasons, the authors have arranged a WSN that employs specifically developed sensor nodes with the aim of minimizing both the costs and the power consumption, thus allowing long-life preconfigured devices to be obtained. These goals have been reached by integrating processing radio and measuring capabilities inside a single chip and developing an ad hoc communication protocol between the sensor nodes and the base station. III. P ROPOSED A RCHITECTURE The proposed architecture of the measuring system that is able to monitor the temperature of packed goods inside a refrigerated vehicle is shown in Fig. 1. It consists of a base station and of different measuring nodes, which communicate with the base station through a wireless connection. Two kinds of measuring nodes are employed to measure the temperature, i.e., one for the air inside the vehicle and the other for the product temperature. The latter consists of dummy products, which are identical to the real products, and equipped with a suitable number of temperature sensors. These dummy goods are inserted into the packaging among the real products. Both kinds of nodes have to embed the circuitry to condition and acquire the sensor
CARULLO et al.: WIRELESS SENSOR NETWORK FOR COLD-CHAIN MONITORING
outputs, the memory to store the performed measurements, and a transmitter to send the data to the base station. The base station is basically designed to collect the measurements from all the measuring nodes, and it should, therefore, have the memory space necessary to store all the measurements performed over a distribution. The base station is also able to interact with the nodes by updating and reconfiguring them as required. An example of the reconfiguration of the nodes is the change in the measurement frequency, which results in an increase in battery life. In addition, a data packet that summarizes the cold-chain status can periodically be sent to all the nodes, thus also providing information on the cold chain to the final customer. Furthermore, when an abnormal situation that could compromise the chain integrity arises, the base station is designed to provide an alarm signal to the central station using a cell phone. The alarm is now raised when the temperature of any of the goods approaches the regulation-imposed limit, but more complex solutions that also take the temperature trend into account can be employed. Such a solution can give a better estimation and allows a closer temperature to the allowed limit to be used, thus reducing the cost of refrigeration, but it requires a thermal model of the goods to be estimated. If one decides to perform such an estimation, the described architecture can also be employed to perform a thermal mapping of the products inside the refrigerated vehicle by simply increasing the number of sensors. A. Developed Measuring System The proposed architecture has been implemented for a specific case concerning milk distribution in plastic-bottle crates. The dummy bottles employ thermocouple sensors and make use of a specifically designed sealed “Smart Cap,” which embeds a battery, a microcontroller, and a radio transmitter. The microcontroller carries out the temperature measurements by acquiring the signal outputs of the thermocouples; these measurements are stored inside the microcontroller memory and transmitted to the base station at regular intervals. Dummy products with the same characteristics can suitably be arranged for other applications that employ different packages and for the distribution of other goods. Fig. 2 shows the basic architecture and a photograph of the Smart Cap, which has been arranged on a circular printed circuit board that has a diameter of 3 cm and a thickness of 1 cm, including the battery. The circular shape and the reduced size allow the system to directly be inserted into the plastic caps of the bottles. The circuit core is the systemon-chip CC2510F32RSPR provided by Texas Instruments, which embeds both a microcontroller unit that is similar to the 8051 integrated circuit and a 2.4-GHz radio transmitter CC2510. A circular-shaped antenna is directly printed on the circuit, avoiding the use of any parts outside the cap. Three Ttype thermocouples are employed as temperature sensors: their warm junctions are inserted into the milk, whereas the cold junctions are connected close to a digital thermometer that acts as a junction reference. The voltage outputs of the thermocouples are acquired by means of a 24-bit three-channel analog-to-
1407
Fig. 2. Low-cost Smart Cap and its architecture.
digital converter (ADC) AD7799 from Analog Devices, which embeds a low-noise programmable-gain instrumentation amplifier (PGA). The PGA has been configured with a gain factor of 16, which corresponds to an input range of about 78 mV and an overall effective resolution of about 0.02 ◦ C (17 bits). Lower resolutions are not requested since the resolution of the reference thermometer is about 0.06 ◦ C. Once the calibration error of the digital thermometer has been compensated, the overall uncertainty, which is mainly due to the thermocouple contribution, is about 0.5 ◦ C. Due to the ad hoc design of the Smart Cap and to the use of low-cost temperature sensors and widespread electronic components, the cost of the whole system could be about ten euros for a medium-scale production. The microcontroller firmware was completely developed by the authors with the aim to minimize the power consumption. The communication between the measuring nodes and the base station is based on a simple networking stack, i.e., the measuring nodes broadcast data packets, which are expected to directly be received by the base station. Multihop strategies have not been adopted since the nodes would have to be in sleeping mode for most of the time to save as much power as possible. The frequency of the radio transmissions can be configured to meet the desired real-time requirements, thus avoiding useless radio usage. The base station identifies each node through its static address; when a node has to send data, it first senses the signal strength on the channel to verify the availability of the channel itself, and then it turns on the transmitter and tries to send data to the base station broadcasting the gathered measurements. The base station, which is always listening, receives the results and sends back an acknowledgement to the transmitter to confirm the success of the communication. If the node does not receive the acknowledgement within a predefined time interval, it attempts the transmission again within a few hundreds of milliseconds. If it still fails, the node turns off the transmitter and prepares itself to resend the old data along with the new one during the next scheduled radio transmission. When the base station has to interact with a measuring node, it sets a flag in the acknowledgment packet, which asks the node to keep the radio on long enough to exchange the next command packet. Such a communication protocol, along with the described hardware structure, allows the system to achieve a very low
1408
IEEE TRANSACTIONS ON INSTRUMENTATION AND MEASUREMENT, VOL. 58, NO. 5, MAY 2009
power consumption, which assures an extremely long battery life compared with other off-the-shelf products. When the measuring nodes do not need to perform measurements or transmit results, they enter the standby mode, where not only does the processor use a low-power mode but also the analog circuitry is completely switched off. This leads to an overall standby power consumption of only 3 μW. This is considerably lower than the 45 μW required by the Mica2Dot to sustain the digital system in sleep mode. The measurement activity requires about 15 mW for half a second to acquire the temperature of the reference sensor and of the three thermocouples. The transmission of a data packet, which could contain the results of up to 30 measurement cycles, requires a power of 80 mW for about 30 ms. These power levels are also lower than those of the Mica2Dot, which reaches a power of about 165 mW when fully operational. A CR2477 button lithium battery, which is mounted onto the bottom of the Smart Cap, is employed to power the whole circuitry. When the system is active, it is able to operate for more than two years with the sample rate set to one sample per minute. In addition, the sensor can be set at “shelf mode” with no measurements and a transmission interval of 10 min, which is required so that the base station can reactivate the normal mode. In shelf mode, the theoretical battery life, not taking its self-discharge into account, is more than ten years. This allows the whole device to be sealed and stocked with its own battery already inserted and ready for use. IV. S YSTEM T ESTS Preliminary tests were performed to evaluate the effectiveness of the proposed solution. Initially, a thermal characterization of the bottle was performed. Then, the reliability of the RF communication channel between the measuring nodes and the base station was estimated in real conditions, i.e., when the nodes have to communicate through the pallets of milk that are contained inside a refrigerated vehicle. A. Bottle Thermal Characterization A preliminary thermal characterization of a bottle filled with a milk-like solution and equipped with seven thermocouples has been performed. The instrumented bottle was inserted into a climatic chamber, and a series of tests was performed. The obtained results, which are described in [14], have shown that during a negative temperature step, the fastest time constant is about 30 min, and the temperature differences between the bottom and the top of the solution may not be negligible since it may be larger than 3 ◦ C. Other measurements have been carried out after the refrigeration was turned off and the door of the climatic chamber was opened, thus simulating a condition that could happen during the unloading of a product in the absence of direct solar irradiation. In this situation, the time constants are about doubled, and during the first minutes, the product temperatures are within a few Celsius degrees, whereas the increase in the air temperature is more than 15 ◦ C. These results confirm that the air temperature is not representative of the transported
goods and that the sampling frequency can be set to a few minutes since in real operating conditions a lower air flux is expected than that of the flux inside the climatic chamber. This preliminary characterization also allowed the configuration of the instrumented bottle to be fixed. This configuration makes use of three thermocouples that are placed as shown in Fig. 4. B. Communication Channel Reliability The reliability of the communication channel between the nodes and the base station has experimentally been evaluated. The instrumented bottles were placed in different positions among the other bottles while measuring the attenuation of the RF signal that propagates through the milk pallets. For this purpose, the base station was connected to a personal computer via a universal serial bus (USB) interface, and a specific software was developed to analyze the received data packets and to estimate the received signal strength indication (RSSI), which is a measure of the received power. The preliminary tests allowed the minimum RSSI value that ensures good communication to be obtained, which is equal to −93 dBm. Values of the RSSI in the range of −64 to −80 dBm were obtained in the absence of milk pallets between the nodes and the base station and for distances in the range of 1–10 m. The RSSI value was then measured in the test configuration that is shown in Fig. 3(a), where some nodes are highlighted. In this case, with the base station placed at about 4 m from the milk pallets, the signals received from nodes 70, 73, and 76 were characterized by the RSSI values in the range of −68 to −71 dBm, whereas the RSSI value of the signal received from node 72, which is under three pallets and behind another pallet, was −79 dBm. These results, therefore, seem to show that a good communication is ensured in real operating conditions. However, further tests have shown that some problems arise when an instrumented bottle is completely surrounded by milk pallets, as in the test configuration shown in Fig. 3(b), where a measuring node was placed two layers under the top level, and the base station was at about 1 m from the node. In this situation, the RSSI value, which is equal to −64 dBm in the absence of the pallet column in front of the measuring node, becomes −89 dBm, thus indicating a nonnegligible signal attenuation due to the milk absorption of the 2.4-GHz signal. Although the monitoring of a pallet that is completely surrounded by milk bottles is not of great interest since such a pallet is subjected to lower temperature changes than the border pallets, the authors investigated the possibility of arranging an improved version of the measuring nodes, which employ the CC1110 chip. Such a device, which is pin-to-pin compatible with CC2510, employs a radio transmitter that can work in three different bands from 300 to 928 MHz, thus reducing the problem of the signal absorption, and exhibits an output power that is greater than 10 dBm with respect to the CC2510 chip. V. E XPERIMENTAL T ESTS A. Climatic Chamber Tests Once the WSN had been arranged according to the scheme described in Section III, seven product nodes were inserted into
CARULLO et al.: WIRELESS SENSOR NETWORK FOR COLD-CHAIN MONITORING
Fig. 3.
1409
Two test configurations arranged to estimate the performance of the communication channel between the measuring nodes and the base station.
Fig. 4. Temperature measurements of a product node subjected to perturbations inside a climatic chamber.
a typical crate, as shown on the left side of Fig. 1, where the blue caps identify the instrumented bottles. The product crate and one air temperature node were inserted into a climatic chamber, whereas the base station placed outside the chamber was configured to acquire one temperature measurement per minute for each measuring node. The performed tests consist of a preliminary refrigerating phase, which brings the products to a temperature of about 4 ◦ C, and then of a series of thermal perturbations. The behavior of the instrumented bottles during the refrigerating phase was similar to that obtained during the thermal characterization of a single bottle. An example of the results obtained while subjecting the product package to perturbations is shown in Fig. 4. In this case, the door of the climatic chamber was first opened for 5 min, and after the product temperatures had settled, the door was reopened for 25 min. After about 4 h, the product package was placed outside the chamber at room temperature. The graphs in Fig. 4 show the temperature of the climatic chamber (dashed line), which is marked by the letter C, the temperature of the reference junction (marked with REF), and the temperature of the three thermocouples, which are inserted into each bottle, as shown in the figure. During the first perturbation, the increase in air
Fig. 5. Temperature measurements of thermocouple 1 of seven product nodes during a thermal transient. The dashed line represents the temperature of the air inside the climatic chamber.
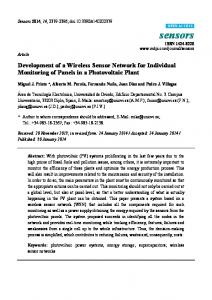
temperature was about 5 ◦ C, whereas the product temperature changes by less than 0.5 ◦ C. During the second perturbations, the product temperature did not exceed 6 ◦ C for air temperatures that rose to 15 ◦ C. In this case, a larger time constant than 1 h has also been estimated. This test provides further important information, which is highlighted in Fig. 5, where the temperatures of the TC1 thermocouple of the seven product nodes are shown. The obtained results show that the nodes with the lowest time constants are those in the crate corners that are directly exposed to the air flux. This indicates that an effective monitoring of the milk crates can be performed by employing two product nodes placed in opposite corners of each crate. B. Field Tests The last kind of test was performed on a refrigerated vehicle during a real distribution. For this purpose, ten product packages were monitored by using two instrumented bottles placed in the opposite corners of each crate, as shown in Fig. 6. Twenty product nodes were, therefore, employed during this test. A summary of the test is reported in Fig. 7, where the measurements of the TC1 thermocouples of all the nodes and of
1410
IEEE TRANSACTIONS ON INSTRUMENTATION AND MEASUREMENT, VOL. 58, NO. 5, MAY 2009
Fig. 6. Monitored crate configuration during a test performed on a refrigerated vehicle.
Fig. 8. Temperature measurements of some of the product nodes during the unloading of the milk package.
Fig. 7. Example of results obtained during a real distribution path.
the air temperature node are shown. The smart caps started the acquisition at room temperature, and then, the thermocouples were inserted into the milk bottles, as shown in the initial fast steps of the figure. The instrumented bottles were then inserted into ten milk crates, and these crates and the air temperature node were moved into the refrigerated vehicle. The vehicle refrigerating system was then connected to the mains during the storage phase in the factory, which lasted about 12 h. The last part of the figure refers to the distribution phase; a series of perturbations that correspond to the interruptions of the refrigerating flux and door openings can be observed. As expected, for an air temperature increase of about 10 ◦ C, the more exposed nodes present a temperature change of a few Celsius degrees. It should be noted that the TC1 thermocouples are the warmest sensors in the milk, as shown in Fig. 4; therefore, most of the milk is actually subjected to lower temperature changes. Another interesting result can be observed in Fig. 8, where the temperature of the three thermocouples of some monitored products are shown: Nodes A, C, and D are placed in the top layer of the milk crates, whereas nodes B and E are one level (−1) and two levels (−2) under the top layer, respectively. The obtained results show that the warmest nodes are those that are placed close to the walls of the refrigerated vehicle (A and B in the figure). This is due to the nonideal insulation and the high external temperature, which was higher than 30 ◦ C during the test. The lowest temperature measurements were instead obtained for node D, which was directly exposed to the refrigerating flux, and for node E, since it has a great thermal inertia due to the milk bottles that are placed above and around it. It should be noted that the described situations were different
after the 16th hour since some crates have been unloaded; thus, the air flux and the thermal inertia of the other crates have changed. In particular, the temperature of node E increases to the same temperature as the other nodes since the crates above and around this node have been unloaded. During the test, the measuring nodes were recovered; therefore, nodes C and D were extracted from the unloaded crate and placed in a spare crate inside the refrigerated vehicle. VI. C ONCLUSION Cold-chain problems have been discussed in this paper, and a measuring system that is conceived for the monitoring of the temperature-sensitive products during their distribution has been proposed. This system, which is essentially a WSN, consists of a base station and several nodes that are able to carry out measurements of the air and the temperature inside the monitored products; the measuring nodes receive the configuration commands and send the acquired data to the base station through an RF communication channel. The measuring nodes have been specialized to monitor the temperature of the milk bottles: the circular shape of the circuitry allows each node to be inserted into the bottle cap. However, such nodes can easily be adapted to monitor other types of products. The low cost of the measuring nodes, which is about ten euros for a medium-scale production, makes the proposed solution also suitable to provide information about the cold-chain integrity to the consumer. The preliminary experimental results obtained in a climatic chamber on the first prototype of the measuring system provided useful information for the configuration of the WSN that was arranged and employed to monitor the temperature of the milk crates during a real distribution. The obtained results have shown the effectiveness of the proposed solution and have given useful information for the identification of a thermal model that could be employed to reduce the number of measuring nodes while assuring cold-chain integrity.
CARULLO et al.: WIRELESS SENSOR NETWORK FOR COLD-CHAIN MONITORING
R EFERENCES [1] Comet System Temperature Data Logger. [Online]. Available: http://www. cometsystem.cz/english/temperature-dataloggers.htm [2] Maxim Thermochron iButton. [Online]. Available: http://www.maximic.com/products/ibutton/ [3] N. Zertal-Menia, J. Moureh, and D. Flick, “Simplified modelling of air flows in refrigerated vehicles,” Int. J. Refrig., vol. 25, no. 5, pp. 660–672, Aug. 2002. [4] EN 12830—Temperature Recorders for the Transport, Storage and Distribution of Chilled, Frozen, Deep-Frozen/Quick-Frozen Food and Ice Cream—Tests, Performance, Suitability, 2001. [5] A. Flammini, D. Marioli, E. Sisinni, and A. Taroni, “A real-time wireless sensor network for temperature monitoring,” in Proc. IEEE Int. Symp. Ind. Electron., Jun. 4–7, 2007, pp. 1916–1920. [6] A. M. C. Lee, C. T. Angeles, M. C. R. Talampas, L. G. Sison, and M. N. Soriano, “MotesArt: Wireless sensor network for monitoring relative humidity and temperature in an art gallery,” in Proc. IEEE Int. Conf. Netw., Sens. Control, Apr. 6–8, 2008, pp. 1263–1268. [7] K. Benkic, P. Planinsic, and Z. Cucej, “Custom wireless sensor network based on ZigBee,” in Proc. 49th Int. Symp. ELMAR, Sep. 12–14, 2007, pp. 259–262. [8] R. Beckwith, D. Teibel, and P. Bowen, “Report from the field: Results from an agricultural wireless sensor network,” in Proc. 29th Annu. IEEE Int. Conf. Local Comput. Netw., Nov. 16–18, 2004, pp. 471–478. [9] A. D. Wood, J. A. Stankovic, G. Virone, L. Selavo, Z. He, Q. Cao, T. Doan, Y. Wu, L. Fang, and R. Stoleru, “Context-aware wireless sensor networks for assisted living and residential monitoring,” IEEE Netw., vol. 22, no. 4, pp. 26–33, Jul./Aug. 2008. [10] GE Sensing Kaye RF Valprobe. [Online]. Available: http://www. gesensing.com/products/RF_ValProbe.htm [11] Moteiv Tmote Sky. [Online]. Available: http://www.sentilla.com/pdf/eol/ tmote-sky-datasheet.pdf [12] Crossbow Wireless Sensor Networks. [Online]. Available: http://www. xbow.com/Home/wHomePage.aspx [13] M. Ouwerkerk, F. Pasveer, and N. Engin, “SAND: A modular application development platform for miniature wireless sensors,” in Proc. IEEE Int. Workshop Wearable Implantable Body Sensor Netw., Apr. 3–5, 2006, pp. 166–170. [14] A. Carullo, S. Corbellini, M. Parvis, L. Reyneri, and A. Vallan, “A measuring system for the assurance of the cold-chain integrity,” in Proc. IEEE Int. Instrum. Meas. Technol. Conf., Vancouver, BC, Canada, May 12–15, 2008, pp. 1598–1602.
Alessio Carullo was born in Italy in 1966. He received the M.S. degree in electronic engineering from Politecnico di Torino, Torino, Italy, in 1992 and the Ph.D. degree in electronic instrumentation from the Università di Brescia, Brescia, Italy, in 1997. He is currently an Assistant Professor with the Dipartimento di Elettronica, Politecnico di Torino, where he is responsible for SIT Calibration Center no. 139. He works on the development of intelligent instrumentation and the validation of automatic calibration systems.
1411
Simone Corbellini was born in Italy in 1977. He received the M.S. degree in electronic engineering and the Ph.D. degree in metrology from Politecnico di Torino, Torino, Italy, in 2002, and 2006, respectively. He is currently with the Dipartimento di Elettronica, Politecnico di Torino. His main fields of interest are digital signal processing, distributed measurement systems, and intelligent microcontroller-based instrumentation. He is currently working on the development of a measuring system for the physical and chemical characterization of thin films.
Marco Parvis (F’08) was born in Italy in 1958. He received the M.S. degree in electrical engineering and the Ph.D. (Italian Doctorate) degree in metrology from Politecnico di Torino, Torino, Italy, in 1982 and 1987, respectively. He is currently a Full Professor of electronic measurements with the Second Faculty of Engineering, Politecnico di Torino. He has been nominated to be the Dean of the Second Faculty of Engineering for the 2008–2011 term. He is author of more than 100 publications. His main fields of interest are intelligent instrumentation and applications of signal processing to measurement, biomedical, and chemical measurements. Dr. Parvis is the Chair of TC 25 Medical Measurement of the IEEE Instrumentation and Measurement Society.
Alberto Vallan was born in Italy in 1967. He received the M.S. degree in electronic engineering from Politecnico di Torino, Torino, Italy, in 1996 and the Ph.D. degree in electronic instrumentation from the Università di Brescia, Brescia, Italy, in 2000. He is currently an Assistant Professor with the Dipartimento di Elettronica, Politecnico di Torino. His main research interests are in digital signal processing and the development and characterization of sensors and instruments for industrial applications.