491
Journal of Cell Science 112, 491-502 (1999) Printed in Great Britain © The Company of Biologists Limited 1999 JCS0069
Expression of A2B adenosine receptors in human lymphocytes: their role in T cell activation Maribel Mirabet1, Carolina Herrera1, Oscar J. Cordero2, Josefa Mallol1, Carmen Lluis1 and Rafael Franco1,* 1Department 2Department
of Biochemistry and Molecular Biology, Faculty of Chemistry, University of Barcelona, Barcelona, Catalonia, Spain of Biochemistry and Molecular Biology, Faculty of Biology, University of Santiago de Compostela, Spain
*Author for correspondence (e-mail:
[email protected]; homepage: www.bq.ub.es/recep/franco.html)
Accepted 9 December 1998; published on WWW 25 January 1999
SUMMARY Extracellular adenosine has a key role in the development and function of the cells of the immune system. Many of the adenosine actions seem to be mediated by specific surface receptors positively coupled to adenylate cyclase: A2A and A2B. Despite the fact that A2A receptors (A2ARs) can be easily studied due to the availability of the specific agonist CGS21680, a pharmacological and physiological characterization of adenosine A2B receptors (A2BRs) in lymphocytes has not been possible due to the lack of suitable reagents. Here we report the generation and characterization of a polyclonal antipeptide antibody raised against the third extracellular loop of the A2BR human clone which is useful for immunocytochemical studies. This antibody has permitted the detection of A2BR+ cells in lymphocyte samples isolated from human peripheral blood. The pharmacology of cAMP-producing compounds is consistent with the presence of functional
A2BRs but not of A2A receptors in these human cells. The percentage of A2BR-expressing cells was similar in the CD4+ or CD8+ T cell subpopulations. Interestingly activation signals delivered by either phytohemagglutinin or anti-T cell receptor/CD3 complex antibodies led to a significant increase in both the percentage of cells expressing the receptor and the intensity of the labeling. These receptors are functional since interleukin-2 production in these cells is reduced by NECA but not by RPIA or CGS21680. These results show that A2BR expression is regulated in T cell activation and suggest that the role of adenosine in lymphocyte deactivation is mediated by A2BRs.
INTRODUCTION
1992; Linden et al., 1993; Salvatore et al., 1993; Tucker and Linden, 1993). All these P1 purinoceptors belong to the superfamily of G protein-coupled receptors having seven transmembrane domains. The relevance of adenosine for the development and function of the immune system is deduced from the severe combined immunodeficiency syndrome (SCID) associated with the congenital defect of adenosine deaminase, the enzyme which degrades the nucleoside. In adenosine deaminase-deficient children, elevated levels of adenosine (and 2′-deoxyadenosine) are found in body fluids. Several mechanisms whereby adenosine deaminase deficiency may affect the development and function of lymphoid cells have been suggested but none can satisfactorily explain all the relationships found in SCID. Most of the proposed mechanisms (see Hershfield and Mitchell, 1989, for review) have rested upon the assumption that accumulation of the two physiological substrates of adenosine deaminase, adenosine and 2′-deoxyadenosine, are toxic for lymphocytes (Franco et al., 1998, and references therein). There is recent data suggesting that signaling through purinergic receptors in lymphocyte and lymphocyte precursors may contribute to the pathogenesis of adenosine deaminase-related SCID (Apasov
Adenosine, acting outside the cell, exerts potent actions on a wide variety of physiological systems, including the nervous, cardiovascular, gastrointestinal, urogenital, respiratory, and lymphatic systems. Many of these actions are mediated via specific receptors named P1 purinoceptors (Daly et al., 1983). From studies on the variation of adenylate cyclase activity produced by adenosine analogues, and on the rank order of potency of agonists, P1 purinoceptors were subdivided into two classes: A1, which mediate decreases in cAMP levels, and A2, which mediate increases in cAMP levels (Van Calcker et al., 1979; Londos et al., 1980). The pharmacological characterization of the A2 subtype in different tissues led to the finding of two different populations which were named A2A and A2B, and had very different affinities for the agonist CGS21680. It is now becoming clear that the subtypes of adenosine receptors can be linked to a variety of signal transduction systems apart from adenylate cyclase (Stiles, 1992; Linden, 1994; Schubert et al., 1994; Fredholm, 1995). These receptor subtypes (A1, A2A and A2B) as well as another member of the family, which was discovered more recently (A3), have been cloned (Zhou et al.,
Key words: Adenosine receptor, T cell activation, Antipeptide antibody
492
M. Mirabet and others
et al., 1997; Resta and Thompson, 1997). On the other hand, adenosine receptors seem to be involved in the regulation by adenosine of T-cell receptor-triggered activation-related events, such as antibody production, cell proliferation, IL-2 production, upregulation of IL-2 receptor α-chain (CD25) and lymphocyte-mediated cytolysis (Wolberg et al., 1975; Dos Reis et al., 1986; Antonysamy et al., 1995; Huang et al., 1997). Adenosine receptors regulating these different aspects of lymphoid function are those leading to increases in cAMP levels, i.e. A2AR and/or A2BR (Dos Reis et al., 1986). In fact, adenosine and 2-chloroadenosine lead to increases in human lymphocyte cAMP levels (Marone et al., 1978; Dinjens et al., 1986). Recently, Huang et al. (1997) have shown that A2ARs are involved in adenosine-mediated inhibition of murine Tcell activation and expansion. In these events the role of A2BRs has not been established due to the lack of suitable tools for their study. In this paper we describe the generation and characterization of two polyclonal antipeptide antibodies raised against different regions of the A2BR human clone. One of these antibodies has proven to be inestimable for the identification of A2BR-expressing human blood lymphocytes. Further analysis of these cells have shown that the expression of A2BR is regulated in T cell activation events thus indicating that A2BRs are involved in the regulation by adenosine of signaling processes occurring in human lymphocytes. Furthermore, upregulated A2BRs are functional and elicit significant reductions in interleukin-2 production. These results are similar to those found in murine macrophages in which A2BRs are upregulated in response to interferon-γ. As we described here for T lymphocytes, adenosine, acting through A2BRs, contributes to the deactivation of macrophages since it reduces the upregulation of MHC class II molecules, the activity of nitric oxid synthase or the production of pro-inflammatory cytokines (Xaus et al., 1999). MATERIALS AND METHODS Materials 5′-N-ethylcarboxamidoadenosine (NECA), N6-(R)-phenylisopropyladenosine (R-PIA), fluorescein isothiocyanate (FITC), tetramethylrhodamine isothiocyanate (TRITC), saponin, paraformaldehyde, Indo-1/AM, Triton X-100, EGTA and bovine serum albumin (BSA) were purchased from Sigma Chemical Co. (St Louis, MO, USA). Ficoll was from Biochrom KG (Berlin, Germany) and 2-(p-[2-carboxyethyl]phenylethylamino)-5′-N-ethylcarboxamidoadenosine (CGS21680) from Research Biochemicals International (Natick, MA, USA). Keyhole limpet hemocyanin was purchased from Calbiochem (La Jolla, CA, USA), glycine and IL-2 were from Boehringer Mannheim (Barcelona, Spain) and Immuno-Fluore Mounting Medium was from ICN Biomedical Inc. (Costa Mesa, CA, USA). Thiol-Sepharose 4B and Sephadex G-25 fine grade were obtained from Pharmacia (Uppsala, Sweden) and OKT3 antibody was kindly provided by Dr Terhorst (Beth Israel-Deaconess Medical Center, Boston, MA, USA). The anti-M2 flag antibody was purchased from Eastman Kodak company (New Haven, USA). Phycoerythrin (PE)-anti CD4 (T4), PE-anti CD8 (T8) and PE-anti CD3 (CD3, clone HIT3A) mAbs were from Coulter (Hialeah, FL, USA). All other products were of the best grade available and were purchased from Merck (Darmstad, Germany) and Sigma. Deionized water further purified with a Millipore Milli-Q system (Bedford, MA, USA) was used throughout.
Cells and culture conditions Chinese hamster ovary (CHO) cells transfected with cDNA coding for the human A2B adenosine receptor (Pierce et al., 1992) were kindly provided by Dr Peter R. Schofield from the Garvan Institute of Medical Research at St Vincent’s Hospital in Sidney, Australia. Chinese hamster ovary (CHO) cells transfected with a cDNA coding for a recombinant protein composed of the human A2A adenosine receptor containing the M2 flag in its C-terminal end (Rivkees et al., 1995) were kindly provided by Dr Scott A. Rivkees from Yale University, New Haven, CT, USA. Transfected CHO cells were grown in Dulbecco’s modified Eagle’s medium/Hams F12 nutrient mixture (1:1) containing 10% (v:v) fetal calf serum, 2 mM L-glutamine, antibiotics (100 i.u./ml penicillin, 100 µg/ml streptomycin and 0.25 µg/ml fungizone and 1.6 mg/ml of the neomycin analog G-418), at 37°C in an humid atmosphere of 5% CO2. Wild-type CHO cells were cultured in the same conditions described for transfected cells but in the absence of G-418. Jurkat cells were maintained in RPMI 1640 medium supplemented with 10% (v:v) fetal bovine serum, 2 mM Lglutamine and antibiotics at 37°C under a 5% CO2 atmosphere. HEPG2 cells were cultured in DMEM supplemented with 4.5 g/l glucose and 10% fetal serum. All the culture reagents were from Gibco (Grand Island, NY, USA). Peripheral blood mononuclear cells (PBMC) from healthy donors were isolated from buffy coats (kindly provided by Dr Hernández from the Banco de Sangre of the Hospital General Vall d’Hebrón de Barcelona) using the Ficoll gradient method described by Boyum (1968). Further purification of lymphocytes (PBL) from PBMC was performed by depletion of contaminating cells by adherence to plastic plates. An homogeneous population corresponding to total lymphocytes was observed according to forward and side light scatter parameters by flow cytometry analysis with less than 7% of contaminating monocytes. PBMC or PBL were split at 106 cells/ml and cultured in the same conditions as described above for Jurkat cells. In vitro activation of cells was carried out with 1 µg/ml phytohemagglutinin (PHA; Difco Laboratories, Detroit, MI, USA) or was conducted in well plates coated with OKT3 antibody. For OKT3 antibody immobilization, 300 µl of 10 mM PBS, pH 7.4, containing 2.5 µg/ml purified OKT3 antibody were placed for 3 hours at 37°C in a 24-well flat bottom plate. After 2 washes with 2 ml of cold PBS, cells were added to wells at a density of 106 cells/ml to begin the activation experiments. Anti-A2B adenosine receptor antibody generation and purification The procedure for obtaining the antibodies is patent pending. Antipeptide antisera were generated in New Zealand white rabbits by Biokit, S.A. (Barcelona). The peptides used for immunization correspond to the deduced amino acid sequence from the putative third extracellular loop (FQPAQGKNKPKWA) and from a portion of the C-terminal domain (AYRNRDFRYTFHKI) of the cloned human A2B adenosine receptor (Pierce et al., 1992) (Fig. 1). They were selected on the basis of hydropathy analysis (Kyte and Doolitte, 1982) and, whenever possible, low homology with the A1, A2A and A3 adenosine receptors. The peptides were synthesized by the Peptide Synthesis Service at the University of Barcelona with an extra carboxy-terminal cysteine residue, to facilitate conjugation with keyhole limpet hemocyanin via m-maleimidobenzoyl-Nhydroxysuccinimide coupling (Kitagawa and Aikawa, 1976). The composition of each peptide was verified by high performance liquid chromatography. Each keyhole limpet hemocyanin-coupled peptide was injected into two rabbits using the immunization protocol method of Tanaka et al. (1985). The reactivity of the resulting antisera, ME in the case of the extracellular peptide and MI in the case of the intracellular peptide (Fig. 1), against the appropriate peptide was tested by enzyme-linked immunosorbent assay (ELISA). For this purpose, 96-well Maxisorp microtiter plates (Nunc) were coated with the peptides (2.5 µM), blocked, and incubated with various dilutions
A2B adenosine receptors and T cell activation
493
EXTRACELLULAR
G T T E P D W C
Fig. 1. Sequence and predicted membranespanning topography of the human A2B adenosine receptor. The amino acid sequences used for antibody generation are indicated with dark circles. The figure is adapted from the amino acid sequence reported by Pierce et al. (1992) and from the receptor structure proposed by Stehle et al. (1992). Consensus sequences for glycosylation (Y) and acylation (Ⲑ) are indicated.
M NH2 L L Y G E F T D Q T D C A F L I S L G Y V A L F P A I T E L V I A A L L F A I S V A D V A V G G N V L L A A A V C A A F L V S V Y N G T T P A N T L QT
HOOC
N N T A S D
T
N
E S C C
Antiserum: ME Purified antibody: MPE1
L V C K NKP K K L C S K L F W N G F W L G A Q V V N E A M A L P T P F L F Q P N M A C F V M S Y M I L I G L V N C V T L V V Y F L S H I T Q N F F G P V H A A F G C V L S S I F L W V L A N S A L C W L P P L L S L L V V N P I A V V G I F S L A M I I M L V R G V I V Y A V A V A K I A Y A A R D Y H T I I Y R G E R K L T I R N A Q V F I R L L L C D T S V P V F L R Y K T A R R C S Y R T E L M D H Q L Q R T
L G V G L A P Q V G A Q G N G S K V D A Q C L L Y R S I
IKHF
Antiserum: MI Purified antibody: MPI1
INTRACELLULAR
of the ME and the MI antisera. The antibodies were detected with peroxidase-conjugated sheep anti-rabbit IgG antibodies (Boehringer Mannheim). Reactivity could be detected in the ELISA down to a 105fold dilution for both antisera (data not shown). Purification of antibodies from whole rabbit serum was achieved by affinity chromatography using the appropriate immunizing peptide coupled to Thiol-Sepharose 4B. Columns were prepared using 3 mg of peptide/ml of swollen activated Thiol-Sepharose 4B, in accordance with the manufacturer’s instructions. For antibody purification, 8 ml of antiserum was diluted (3-fold) in 10 mM PBS, pH 7.4, and this material was recirculated for 2 hours at room temperature or overnight at 4°C through 3 ml of the peptide-Sepharose column. The column was then washed with PBS and antibodies were eluted by addition of 50 mM glycine/HCl, pH 2.3. Fractions (1 ml) were collected in tubes containing 20 µl of 1 M Tris, to give a final pH of 7.4. Proteincontaining fractions were pooled, dialyzed against 2000 volumes of PBS and aliquoted for storage at −80°C. The affinity purified antibodies obtained from ME and MI antisera were called MPE1 and MPI1, respectively. Antibody conjugation to fluorocromes Purified antibodies were dialyzed against labeling buffer (50 mM H3BO3, 200 mM NaCl, pH 9.2) at 4°C. Subsequently, 20 µl of 5 mg/ml FITC (for MPE1) or TRITC (for MPI1) in DMSO were added for each milligram of antibody. After 2 hours at room temperature, unbound fluorocrome was separated by gel filtration using a Sephadex G-25 column. Fluorochrome-conjugated antibodies were stored at −80°C. Immunostaining and immunofluorescence assays Transfected and wild-type CHO cells grown onto glass coverslips and peripheral blood lymphocytes and Jurkat cells (4×10⁶) were washed with PBS and fixed in 2% paraformaldehyde, 60 mM sucrose in PBS, pH 7.4, for 15 minutes at room temperature. In some experiments cells were permeabilized by adding 0.05% saponin to the fixation solution. Then cells were washed twice with PBS containing 20 mM glycine
(buffer A) and were incubated for 15 minutes at room temperature with buffer A containing 1% BSA and 0.05% NaN3 (buffer B) before addition of the antibodies. For indirect immunostaining, samples were incubated for 45 minutes at 37°C with 50 µg/ml MPE1 in buffer B (50 ml), washed 3 times with the same buffer and stained with FITCconjugated anti-rabbit IgG antibody (dilution 1:50; Boehringer Mannheim). For direct immunostaining, incubation (45 minutes at 37°C) was performed with 100 µg/ml FITC-MPE1 and/or 100 µg/ml TRITC-MPI1. For staining of lymphocytic populations, samples were incubated (30 minutes in ice) with PE-anti CD3, PE-anti CD4 or PEanti CD8 mAb and washed before adding FITC-MPE1 antibody (30 minutes in ice). After 3 washes with buffer B, stained cells were mounted in Immuno-Fluore Mounting Medium for confocal microscopy analysis. Alternatively, cell suspensions were resuspended in buffer B for flow cytometry analysis. Stained cell suspensions were analyzed using an Epics Elite flow cytometer (Coulter Corporation; Hialeah, FL, USA). FITC and PE excitation was obtained by a 488-nm Argon laser lamp and their fluorescences were collected using 525 nm and 575 nm band-pass filters, respectively. The parameters used to select cell populations for analysis were forward and side light scatter. Confocal microscope observations were made with a Leica TCS 4D confocal scanning laser microscope adapted to an inverted Leitz DMIRBE microscope (Leica Lasertechnik GmbH, Heidelberg, Germany). The light source was an Argon Krypton laser and FITC and TRITC were respectively excited at 488 and 568 nm. In this system a 580 nm short-pass filter directs the emitted green (FITC) and red (TRITC) fluorescences towards two photomultipliers, one with a 513-527 nm band-pass filter and the other with a 590 nm long-pass filter. The colocalization analysis was made by means of the Multi Color software (version 2.0; Leica Lasertechnik GmbH). Analysis of intracellular Ca2+ by double wavelength fluorimetry Cells (5×10⁶/ml) were loaded with 5 µM Indo-1/AM in HBSS buffer
494
M. Mirabet and others
A2B adenosine receptors and T cell activation Fig. 2. Specificity of the anti-A2BR antibodies. (A) Confocal images of FITC-MPE1 labeling in fixed wild-type CHO cells (left) and TRITCMPI1 labeling in permeabilized wild-type CHO cells (right). (B) Confocal images of fixed A2BR-transfected CHO cells labeled with FITC-MPE1 antibody (left) or with TRITC-MPI1 antibody (right). (C) Confocal images of permeabilized A2B-R-transfected CHO cells labeled as in B. The superposition of FITC and TRITC labeling shows a high degree of colocalization (in yellow), as it can be seen also in the cytofluorogram. (D) Confocal image of fixed HEP-G2 cells stained with FITC-MPE1 antibody. (E) Confocal image of fixed and permeabilized CHO cells overexpressing A2A-M2 flag receptors stained using 15 µg/ml of anti-M2 flag antibody. (F) Fixed and permeabilized CHO cells overexpressing A2A-M2 flag receptors stained using the MPE1 antibody (top) or the MPI1 antibody (bottom). Note the lack of crossreactivity of the MPE1 antibody against the A2A receptor and some crossreactivity of the MPI1 antibody. (140 mM NaCl, 5 mM KCl, 1 mM MgCl2, 1 mM MgSO4, 1.2 mM CaCl2, 10 mM Hepes, 5 mM glucose, 0.3 mM KH2PO4 and 2 mM Na2HPO4), pH 7.0, for 30 minutes at 37°C. Then, an equal volume of HBSS, pH 7.4, containing 10% heat inactivated fetal calf serum, was added and the cell suspension was incubated for 30 minutes. After washing with HBSS, pH 7.2, containing 5% heat inactivated fetal calf serum and 10 µg/ml bovine pancreatic deoxyribonuclease I (Sigma), cells were resuspended at 5×10⁶ cells/ml and maintained at room temperature in the dark until use. Just before the analysis, cells were diluted to 1×10⁶ cells/ml and warmed to 37°C. Fluorescence was
Fig. 3. Phenotype analysis of A2BR+ lymphocytes from PBMC by two color immunofluorescence. The upper dot plot (left) represents side versus forward scatter distribution of total PBMC and B1 in red represents the gated population. Quadrants were placed according to the nonspecific labeling obtained using FITC-goat anti-mouse and PE-goat anti-mouse treated cells. Xaxis represents the green fluorescence (log scale) using FITC-MPE1; Y-axis represents the red fluorescence (log scale) using the respective PEconjugated anti subset marker mAb. The percentage of cells in each quadrant is indicated. Data correspond to a representative experiment.
495
monitored with a RF-5000 Shimadzu spectrofluorimeter in cuvettes thermostatically controlled at 37°C and continuously stirred. The cell suspension was excited at 355 nm and fluorescence emissions were detected at 405 (Ca2+-bound dye) and 485 nm (Ca2+-free dye). Final [Ca2+]i values were calculated from the ratio of emission fluorescences (405/485 nm) using the equation described by Grynkiewickz et al. (38), with a Kd value of 250 nM for Indo-1. The Rmax value was obtained by lysing the cells with 0.1% Triton X-100, followed by an addition of excess EGTA for Rmin. Determination of cAMP Peripheral blood lymphocytes (PBL) were preincubated at 2×10⁶ cells/ml in HBSS, pH 7.2, containing 30 µM RO-20-1724 (Calbiochem) for 10 minutes at 37°C. 250 µl of the cell suspension were added to tubes containing 2.5 µl of the appropriate stimuli and, after a 10 minute incubation at 37°C, 500 µl of ice-cold ethanol were used to stop the reactions. Samples were centrifuged at 2000 g for 20 minutes at 4°C and supernatants were lyophilized. Quantification of cAMP levels was determined using an enzyme-immunoassay kit from Amersham (Amersham Iberica, Madrid, Spain). Interleukin-2 determination Peripheral blood lymphocytes were incubated in 96-well plates at 106 cells/ml in the presence or absence of the adenosine receptor agonists. Wells were precoated with 2.5 µg/ml OKT3 and the incubation was performed for 72 hours at 37°C. Samples were centrifuged and the supernatants were tested for interleukin-2 content using a human interleukin-2 ELISA kit from Endogen (Woburn, USA).
496
M. Mirabet and others
Protein determination Protein was determined by the bicinchoninic acid method (Pierce) as described by Sorensen and Brodbeck (1986) and using BSA as standard.
RESULTS Specificity of the anti-A2BR antibodies The specificity of MPE1 and MPI1, which are antipeptide antibodies directed against the third extracellular loop and a portion of the C-terminal domain of the human A2BR, respectively (see Fig. 1 and Materials and Methods), has been assessed by using CHO cells transfected with the cDNA encoding for human A2BR. Untransfected cells were not labeled whereas transfected cells showed a very high level of labeling (Fig. 2), which is consistent with overexpression of functional A2BRs positively coupled to adenylate cyclase (Pierce et al., 1992). As expected, MPE1 antibody, which is directed against an extracellular epitope of A2BR was able to detect A2BR molecules in either nonpermeabilized or
Fig. 4. Immunodetection of A2BR in resting peripheral blood lymphocytes (A) and Jurkat T cells (B). Cells were fixed and labeled with MPE1 antibody and a FITC-conjugated secondary antibody as described in Materials and Methods. Fluorescence of labeled cells was analyzed by flow cytometry (specific label is in bold solid line) and confocal microscopy.
permeabilized cells (Fig. 2B,C). Due to the specificity of MPI1 towards an intracellular region of the receptor, this antibody only detected A2BRs in permeabilized cells (Fig. 2C). Liver is a tissue where the level of A2BR expression is very low (Stehle et al., 1992). For this reason, the human hepatocellular carcinoma-derived cell line, HEP-G2, was used to test whether MPE1 led to some cell surface labeling. In these cells where A2BRs were barely detectable by pharmacological techniques, MPE1 did not lead to specific labeling, thus indicating that the antibodies did not recognize molecules different from A2BR (Fig. 2D). Moreover this antibody did not recognize A1 adenosine receptors expressed in neurons (not shown). The high degree of colocalization of the label in permeabilized transfected CHO cells stained using MPE1 or MPI1 indicate that these two antibodies recognize the same molecule. Whereas MPE1 did not recognize A2ARs receptors overexpressed in CHO cells (Fig. 2E), MPI1 lead to some faint labeling in permeabilized cells overexpressing A2ARs (Fig. 2F). None of these antibodies did detect by immunoblotting any band, which could be readily considered specific for A2BRs. All these results indicate that MPE1 antibody works
A2B adenosine receptors and T cell activation well for immunocytochemistry and is specific for A2BRs whereas MPI1 antibody presents some cross-reactivity with A2ARs. All subsequent immunocytochemical studies were performed with the MPE1 antibody.
pmol cAMP/106 cells
2 1
CONTROL
600 500 400
NECA NECA
600
1 min
OKT3
[Ca2+] i (nM)
200
0
200
CGS 21680
OKT3
400
0
300
R-PIA
calcium levels was investigated in peripheral blood lymphocytes. The compound neither had any effect by itself nor it altered the effect exerted by OKT3, a mAb directed against the T cell receptor/CD3 complex which mobilizes calcium via inositol phosphate-sensitive stores (Fig. 6). The same failure to detect NECA-induced changes in calcium levels was evidenced
100
400
NECA
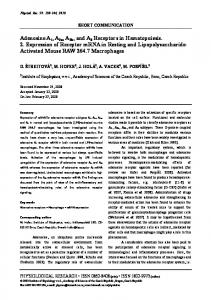
Fig. 5. Cyclic AMP production via A2B adenosine receptors. PBL were incubated with the cAMP phosphodiesterase inhibitor RO-201724 for 10 minutes. Then 25 µM of each adenosine receptor agonist was added and cells were stimulated for 10 minutes at 37°C. cAMP levels were determined as described in Materials and Methods.
100
500
[Ca2+] i (nM)
3
0
[Ca2+] i (nM)
B
4
300
200
NECA
[Ca2+] i (nM)
300
NECA
400
OKT3
A
5
OKT3
Expression of A2BR in resting lymphocytes The MPE1 antibody, which specifically recognizes an extracellular epitope of A2BR, was used to analyze the expression of these receptors in lymphocytes. The percentage of peripheral blood lymphocytes expressing A2BRs was 58±13 (mean ± s.d., n=13), with individual values ranging from 29 to 74. Double labeling experiments were performed to analyze the expression of the receptor in different subsets of T cells. According to Fig. 3 no significant changes in the percentage of A2BR+ cells were found among CD4+ or CD8+ T-cell subpopulations. In general terms, the intensity of the labeling in A2BR+ cells was moderate (Fig. 4A). In the T cell line Jurkat, the number of cells expressing the receptor (>95%) and the level of expression was higher than that found in blood lymphocytes (Fig. 4B). A2BRs in peripheral blood lymphocytes are functional since the agonist NECA led to increases in cAMP levels (Fig. 5). The relative potency of the different agonists at a concentration of 25 µM (NECA»R-PIA>CGS21680) is consistent with the pharmacology of A2BR. Due to the fact that NECA, via A2BR, leads to intracellular calcium mobilization in Jurkat cells (Mirabet et al., 1997), the possible effect of NECA upon
497
300 200
100
100
0
0
1 min
Fig. 6. Lack of calcium mobilization in PBL via A2BR. A fraction of PBL was maintained in the culture conditions described in Materials and Methods until the Ca2+ determination assay (cells in A). Another fraction was activated with 1 µg/ml PHA for 72 hours, washed and maintained for an additional 24 hour-period in complete medium containing 10 units/ml IL-2 (cells in B). Then resting (A) and activated (B) PBL were loaded with Indo-1 and the effect of 100 µM NECA on intracellular calcium levels was analyzed, both in the absence of a previous Ca2+mobilizing stimulus or after the addition of 1 µg/ml OKT3. Traces correspond to a representative experiment performed with PBL obtained from a donor.
498
M. Mirabet and others
irrespective of the blood donor. On the other hand, NECA was unable to mobilize intracellular calcium in T cells expanded by chronic activation with phytohemagglutinin (PHA) followed by IL-2 treatment (Fig. 6). Expression and function of A2BR in T cell activation events The expression of A2BR was analyzed in activated cells. Two
activation signals were used, a relatively unspecific, triggered by PHA and one specific, triggered by the anti-T cell receptor/CD3 complex mAb, OKT3. Irrespective of the stimulus, the percentage of lymphocytes expressing A2BRs was significantly higher (72±10 with PHA and 79±13 with OKT3) than that found in resting cells. When OKT3-activated cells were analyzed by forward and side scatter criteria, two different populations (B1 and B2)
Fig. 7. Expression of A2BR on the cell surface of activated lymphocytes. Isolated mononuclear cells were incubated in flasks precoated or not with purified OKT3 mAb. (A) Dot plot representing the side (properties of cytoplasmic and nuclear components) versus forward scatter (cell size) distribution of activated lymphocytes. B1, in red, represents the gated population remaining in the same region than nonstimulated lymphocytes (not shown), whereas B2, in green, represents the lymphocyte population with higher size and cellular complexity generated upon activation. (B) Dot plots representing the forward scatter versus the fluorescence intensity of cell surface A2BR in the above described two populations, B1 (red) and B2 (green). The patterns for unstimulated and stimulated cells are represented in the upper part and the lower part of the panel, respectively. Unspecific labeling is shown in the images on the left. Note that although in this experiment there are no major differences on fluorescence intensity between stimulated and unstimulated cells in the B1 population, we found significant differences in 5 out of 9 experiments performed with blood from different donors.
A2B adenosine receptors and T cell activation
499
appeared as described elsewhere (Martín et al., 1995). B1 population contains cells structurally similar to the nonstimulated controls, whereas larger, more complex cells are included within B2 population (Fig. 7A). The percentage of cells expressing A2BR in B1 population was similar (Fig. 7B) or slightly higher than in resting cells. Following activation with OKT3, the majority of cells (>91±7%, n=9, range: 8199%) in the B2 population expressed enhanced levels of A2BRs (Fig. 7B). Variations in the intensity of labeling were monitored by flow cytometry (Fig. 7B) and by confocal microscopy (Fig. 8). The level of cell surface A2BR expression in small cells, which correspond to the B1 population of OKT3-activated cells, was slightly higher than that found in resting cells (see legend to Fig. 7), whereas the expression of the receptor in cells from the B2 population (cells of higher size) was markedly enhanced. Similar results were obtained when cells were activated with PHA although the degree of labeling enhancement was not as marked as in the case of lymphocytes activated via the T cell receptor (results not shown). These results provide evidence that the expression of A2BR increases upon lymphocyte activation. The role of A2BRs present in activated lymphocytes was investigated by measuring interleukin-2 production in cells activated using OKT3. The presence of NECA, at a concentration which activates A2BRs (5 µM), led to a significant reduction of interleukin-2 levels produced by activated T cells. In contrast, similar concentrations of either R-PIA or CGS21680 did not exert any effect (Fig. 9). These results indicate that adenosine, via A2BRs, mediates a reduction in the production of interleukin-2. This probably constitutes a feed-back mechanism for lymphocyte deactivation. DISCUSSION The results presented in this paper indicate that the antipeptide antibody MPE1 is specific for human A2BRs in immunolabeling assays. The specificity is based on the results obtained with wild-type and A2BR-transfected CHO cells, on the lack of label when using a hepatoma-derived human cell line in which A2BRs are not detectable by pharmacological procedures, and on the failure to recognize other adenosine receptor subtypes such as the A1 or A2A receptors.
Fig. 8. Confocal microscopy images of resting and OKT3-activated PBL labeled with MPE1 antibody. Note that the intensity of labeling in activated cells is enhanced in cells of higher size. Small cells (B1 population) are marked with an arrowhead. Bar, 10 µm.
800
IL-2 ( pg/ml)
600
Fig. 9. Effect of adenosine analogs on interleukin-2 production. PBLs were activated using 2.5 µg OKT3 in the presence or the absence of NECA, R-PIA or CGS21680. Interleukin-2 secreted to the medium in 72 hours (37ºC), was measured as indicated in Materials and Methods. Data are the mean ± s.e.m. from a representative experiment in triplicates. *P