Once data are gathered, statistical analysis is used to evaluate the results and examine whether the effects of the "A"
A/B Testing Using the Negative Binomial Distribution in an Internet Search Application Saharon Rosset and Slava Borodovsky Tel Aviv University
[email protected] A/B testing plays an important role in modern applications, particularly on the internet, as it helps businesses to optimize their user experience to maximize usage and profits. In this paper we discuss A/B testing on counts (such as number of searches by a user), and point out the importance of using appropriate distributions for statistical analysis. We discuss the use of the negative binomial (NB) distribution to evaluate performance instead of the commonly used Poisson distribution. Our motivating application is in A/B testing on number of searches of users of an internet search engine made by the company SweetIM. We demonstrate the inappropriateness of the standard Poisson assumption for these data, and show that the conclusions from analyses of specific A/A and A/B tests run in this application with NB differ from those with an incorrect Poisson assumption. Using a normal approximation, we describe a general property of NB tests – the existence of a bound on testing power, which is independent of mean expected usage (or length of time running the test) under typical assumptions. This leads to a disconcerting conclusion that such tests cannot guarantee high statistical power for identifying a small difference between the A and B groups, no matter how long they are run. This is in sharp contrast to "standard" tests with binomial, normal or Poisson assumptions, where any desired power can be attained by running the test long enough, as long as the A and B groups differ. We also describe and apply a permutation test as a non-parametric approach for testing. In our view, the non-parametric approach is an important complement to parametric tests like NB inference, because it is valid for testing the most general null hypotheses of equality between A and B distributions, without assuming anything about the form of these distributions.
Keywords: A/B testing, negative binomial, internet, hypothesis testing.
Introduction Controlled experiments, also known as A/B testing, are an important general framework for assessing the impact of changes on performance. Controlled experiments have a long history in medicine, but in recent years A/B testing is increasingly employed in e-commerce, marketing and other consumer-centric domains (Ash 2008; Keppel et al. 1997). In particular, in applications where a decision maker can control the experience each user or customer encounters, it often makes sense to try out changes in user 1
experience by presenting some (randomly chosen) subset of users with the new "B" experience, while others still encounter the old "A" experience. The vendor can then objectively examine the effects of the change in user experience on user behavior, in buying or usage patterns. This mode of experimentation is especially common on the internet, and is widely used by online vendors and service providers to examine effectiveness of their platforms (Ash 2008; Kohavi et al. 2007, Tang et al. 2010). A key component of A/B testing planning, execution and usage is obviously statistical analysis and inference (Box et al. 2005; Myers and Well 2003). In planning, this can be used to determine how many users should be taken, how long the experiment should run, etc. Once data are gathered, statistical analysis is used to evaluate the results and examine whether the effects of the "A" and "B" experiences differ. Proper statistical inference is widely acknowledged as a critical and often non-trivial aspect of A/B testing (Crook et al. 2009). Many A/B tests examine binary outcomes (like buy/don't buy), and typically use binomial distributions for statistical inference. Others examine continuous traits (like time spent on a site) and most often use normal distributions, though sometimes other distributions are more appropriate (Andersen 1997). In this paper we are concerned with A/B tests on counts (like number of searches by a user) and the appropriate statistical approaches for analyzing them. The most commonly used distribution in analyzing counts – in A/B tests as well as other applications – is the Poisson distribution (Andersen, 1997; Johnson et al. 2004; McCullagh and Nelder 1989). Assuming the number of actions by a random user in the A or B groups is Poisson distributed is equivalent to assuming that actions arrive from all users at a constant rate in a "memoryless'" manner, i.e., that each user may act in the next instant with equal probability regardless of who acted when in the past. This is often a reasonable assumption, especially if all users are of the same "type". However if the users differ significantly (for example, if some are internet worms or bots that constantly act, while others are occasional users that rarely do), the Poisson assumption may well be inappropriate and lead to incorrect inference and conclusions. In this paper we demonstrate that this is indeed the case in our domain of interest. Some authors have advocated identifying and removing robots in A/B tests, but have also acknowledged that this can be difficult or impossible (Crook et al. 2009). Even if this is successfully done, users 2
may still differ significantly, for example heavy internet users compared to occasional users. An alternative in the case that users differ significantly is to use the Negative Binomial distribution (henceforth NB, also known as over-dispersed Poisson) (Thall and Vail 1990). This is equivalent to assuming that each user still acts as a "memoryless" Poisson process, but their rates are now allowed to differ (see mathematical derivation in the next section). The NB distribution can be fitted to data, and used for inference, and this has been done extensively in many scientific and engineering domains, like genetics (Efron and Thisted 1976; Kimura 1994; Tamura and Nei 1993; Thall and Vail 1990), traffic modeling (Gerlough et al. 1971; Greenshields et al. 1978; McGee et al. 2003), marketing (Schmittlein et al., 1985), criminology (Berk and MacDonald, 2008) and others. Thus, this basic idea is well known and widely used. However, we are not aware of A/B testing methodology using the NB distribution, and to our knowledge some of the calculations we present here on power limitations against specific alternatives, have not been adequately addressed by previous work in other domains. An interesting alternative that is commonly used in practice is to use a “t-test” for testing difference between populations, based on a normal approximation for mean usage in the population, with estimated variance from the data. As Aban et al. (2008) show, this approach is inferior to NB-based analysis (overly conservative, low power), when the NB distribution is appropriate. We discuss this issue further below. Another approach that is very similar to NB is the quasi-Poisson model (McCulagh and Nelder, 1989), which takes slightly different assumptions, but typically leads to very similar conclusions in simple situations like those we face (Ver Hoef and Boveng, 2007). Our motivating application in this paper comes from the actual A/B experimentation experience of the company SweetIM, which provides content and search services for instant messaging applications (IMs), Social Networks and Webmail. An important goal of these experiments is to identify changes that increase the number of searches of SweetIM users. Our analysis below shows that use of the Poisson distribution for planning and analyzing A/B tests on number of searches results in incorrect conclusions. For example, A/A tests, where the exact same experience is provided to both groups, often result in decisive rejection of the 3
"null hypothesis" that the groups do not differ, which should not happen by definition if correct inference is applied. Our main contributions are: •
Demonstration that the NB distribution is indeed more appropriate for analysis of A/B tests on SweetIM data, with estimation of the appropriate NB parameters and comparison of actual test results with Poisson and NB assumptions. We show that NB inference leads to correct non-rejection of the null in A/A tests, and to some rejections in A/B tests examined. We also verify validity of our results by comparing them to assumption-free permutation tests.
•
Statistical analysis of the implications of using NB in A/B testing. In particular, we discuss the statistical power of A/B tests (i.e., their ability to identify "real" differences) and its dependence on the duration of the tests, or equivalently the expected number of searches per user. Based on a normal approximation, we show that NB tests cannot guarantee arbitrary power by running the test longer, in contrast to other commonly used distributions like binomial, normal or Poisson. Instead, power in NB tests is bounded from above by a quantity that does not depend on the duration. The only way to increase the power further is to add users to the A and B groups. This has significant implications on the planning and execution of A/B tests in the setting where NB inference is appropriate. This problem is not purely academic, as expressed in SweetIM’s own experience, where large usage differences of several percents are hard to assert with very large samples because of this power limitation. This problem is shared by giants running huge A/B tests like Google and Microsoft (Tang et al. 2010, Kohavi et al. 2007).
Statistical Inference for AB Tests Poisson and Negative Binomial Distributions in AB Tests A random variables X has a Poisson distribution, denoted X ~ Pois(µ), if P(X=k) = e-λ µk / k! , k=0,1,2,…. X has mean and variance both equal to the Poisson parameter µ (Johnson et al. 2004). 4
When events are collected over time, it is common to assume that the Poisson rate is µ for a time unit (typically a day in A/B testing) and therefore if the experiment is run for t days, we get X~Pois(t·µ). In an A/B testing situation, assume we have n users in the A group and m users in the B group, and denote by x1,x2,…,xn~Pois(t·µA) i.i.d the number of searches in the A group and by y1,y2,…,ym~Pois(t·µB) i.i.d the corresponding numbers in the B group. Then the A/B test for difference between the groups can be formally stated as testing a null of no difference in rates against the proper alternative (we'll assume a one sided alternative since we are only interested to learn whether B is better than A, i.e., leads to more searches): H0: µA=µB vs HA: µA0: π(µA, δ, n, t) → 1 as either n→∞ or t→∞. This important property is shared by other "standard" distributions used in A/B testing, including the normal and binomial distributions. Another way to think about the Poisson model is as a generalized linear model (GLM, McCullagh and Nelder 1989 ), and use likelihood-based inference like Wald tests or generalized likelihood ratio tests for inference. In the case of Poisson, because the maximum likelihood estimate of the Poisson rate is the observed mean, it is easy to show that the Wald approach and the heuristic normal approximation we described above are very closely related (basically, amounting to normal approximations on different scales). Other likelihood based approaches are likely to yield very similar results (Aban et al., 2008). Our choice of presenting our inference using a normal approximation is based on the desire to present simple power calculations, which will easily generalize to the NB case we discuss next. We discuss alternative testing approaches in more detail in the context of NB inference below. The NB distribution is defined by two parameters, X ~ NB(α, p) if (Johnson et al. 2004): α + k − 1 (1 − p ) α p k . P ( X = k )= k
If α is natural, a common interpretation of NB(α,p) is the number of failures until α successes occur in a Bernoulli sequence, when the probability of success is p. However, the NB distribution is defined for any non-negative α and p∈(0,1). The NB distribution can also be thought of as a generalization of Poisson, where now instead of assuming a fixed rate λ, we assume λ is random and drawn from a Gamma distribution (Johnson et al. 2004): 6
λ ~ Γ(α,β), X|λ ~ Pois(λ).
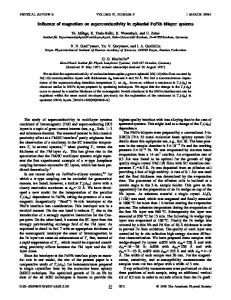
Figure 1. Comparison of Poisson distribution with mean 10 (black line) and NB distributions with the same mean for various values of the shape parameter α. We can see the long tail of distributions with small α.
In this situation, it can be shown that the unconditional (marginal) distribution of X is X ~ NB(α, β /(1+β)). The Poisson distribution is the limit of NB as α→∞ (and the Gamma distribution becomes concentrated at a point). The mean of X is µ=αp/(1-p) = α/β, and the variance of X is σ2=αp/(1-p)2= µ(µ+α) /α (decreasing with α for fixed mean). Figure 1 demonstrates a Poisson distribution with mean µ=10 and several NB distributions with the same mean. We can see that as α gets smaller the right tail of the NB distribution becomes more extreme, and hence we would expect to observe big outliers (such as bots or crawlers in an internet search setting, which perform a continuous stream of searches). On the other hand, the vast majority of users concentrate on the smallest end of the scale, corresponding to the bulk of "casual" users. In the A/B testing context, it makes sense to assume that α is common to both the A and B groups and known (i.e., the skew of the distribution is similar in both groups) and they differ in µ only. Like in the Poisson setting, we can now take µ as the expected number of searches per day, and so the means of the two groups will be tµA and tµB, and the A/B hypothesis testing problem can be written as: X~NB (α, tµA/α), Y~NB (α, tµB/α) and H0: µA=µB vs HA: µA