patients with severe depression with 20 with acute schizophrenia, 40 with chronic schizophrenia and. 40 healthy ... depressed patients exhibited a 'catastrophic.
Psychological Medicine, 1999, 29, 63–72. # 1999 Cambridge University Press
Printed in the United Kingdom
Abnormal response to negative feedback in depression P. J. S H AH," R. E. O’C A R R O L L, A. R O G E R S, A. P. R. M O F F O O T K. P. E B M E I E R From the MRC Brain Metabolism Unit, Royal Edinburgh Hospital, Edinburgh ; Department of Psychology, University of Stirling ; Department of Psychology, University of Surrey, Guildford ; and Rosslynlee Hospital, Roslin, Midlothian
ABSTRACT Background. Recent studies have suggested that subjects with depression suffer a diagnosis-specific motivational deficit, characterized by an abnormal response to negative feedback that endures beyond clinical recovery. Furthermore, it has been suggested that negative feedback may motivate non-depressed controls, but not depressed patients, to improve their performance in neuropsychological tests. Methods. We describe two studies. The first compared performance on the simultaneous and delayed match to sample (SDMS) task from the CANTAB neuropsychological test battery, in 20 patients with severe depression with 20 with acute schizophrenia, 40 with chronic schizophrenia and 40 healthy controls. The second examined the performance of depressed patients with diurnal variation in symptoms and cognitive function. Results. All patients groups showed impairments on the simultaneous and delayed match to sample task compared to controls. Depressed patients did not show an abnormal response to negative feedback. Controls did not show a motivational effect of negative feedback. Depressed patients with diurnal variation showed no variation in their response to perceived failure. There was no evidence of abnormal response to negative feedback in any patient group using the ‘ runs test ’ or of a motivational effect in controls. Conditional probability analysis was not independent of the total number of errors made in the SDMS task. Conclusions. Further studies are suggested to examine whether an abnormal response to negative feedback characterizes particular subgroups of patients suffering from depression. al. 1996 ; Elliott et al. 1996). However, an integrated theory incorporating biological findings, psychological changes and the wideranging cognitive impairments found in depression is not available. For example, although the ‘ fronto-subcortical dementia ’ theory of depression (reviewed in Robbins et al. 1992) is consonant with findings from functional imaging, such as altered frontal cortical and deep grey matter metabolism (Austin et al. 1992 b ; Bench et al. 1992, 1993 ; Dolan et al. 1992, 1994), it does not address the psychological mechanisms involved in depression. A possible mediating link between lowered affect and cognitive impairment is a change in motivation. Reduced or lack of motivation is well recognized in clinical depression and is
INTRODUCTION Memory formation and retention is not an indiscriminate process, but context sensitive and selective, though the mechanisms that perform this selection remain unclear (Cahill & McGaugh, 1996). Recent evidence suggests that enhancement or attenuation of memory formation may be dependent on emotional state, or affect. Thus, it is not unexpected that when affect is grossly abnormal, such as in depression, patients will exhibit the neuropsychological deficits that have now been well characterized (Austin et al. 1992 a ; Brown et al. 1994 ; Beats et " Address for correspondence : Dr P. J. Shah, MRC Brain Metabolism Unit, Royal Edinburgh Hospital, Morningside Park, Edinburgh EH10 5HF.
63
64
P. J. Shah and others
regarded as one of its symptoms, although it is also found in other disorders, such as schizophrenia. Recent evidence suggests that factors contributing to motivation may have an important influence in producing the cognitive impairment found in depression, as well as in psychotic patients (Schmand et al. 1994). Depressed patients respond less to reward or positive reinforcement than controls (Hughes et al. 1985), and judge their performance in a more negative way than controls (Wener & Trehm, 1975). Beats et al. (1996) found that elderly depressed patients exhibited a ‘ catastrophic response to perceived failure ’, that is, an enhanced negative response to negative reinforcement. Further important supporting evidence for a motivational difference has recently been reported by Elliott et al. (1997). They found that although depressed patients performed as poorly as other patient groups on cognitive measures involving explicit feedback, the specific pattern of deficit implied an abnormal response to negative feedback, characterized as either an enhanced negative response to negative reinforcement or a lack of the normal motivating response to negative feedback. Furthermore, they suggested that this deficit was highly specific to depression and present even on recovery, i.e. it reflected a trait and not state-dependent variable. Therefore, depressed patients may have a different response to negative feedback compared with controls, and as a result perform more poorly on cognitive tasks. This hypothesis has the advantage of linking psychological mechanisms such as those thought to be involved in depression, developed by Beck (1967), Beck et al. (1979) and Teasdale & Dent (1987) with the cognitive deficits observed in depression. In this paper, we report two studies. The first attempts to extend the findings of Elliott et al. (1997) by comparing the response to negative feedback in patients with unipolar or bipolar illness, severe enough to merit in-patient management, with that of controls and other psychiatric patient groups. The second tests if depressed patients had diurnal variation in their response to negative feedback in concert with variation of both mood and cognitive performance. We have recently reported that cognitive impairment in depression varies diurnally, in line with diurnal mood variation
(Moffoot et al. 1994). In the light of Elliott et al. (1997) findings, it may be possible that an abnormal response to negative feedback will vary in parallel with diurnal mood variation, providing an explanation for the variation in cognitive performance. METHOD Subjects Study 1 Twenty in-patients with melancholic depression, 20 with acute onset schizophrenia, 40 with chronic schizophrenia and 40 controls free of significant physical or psychiatric illness were selected. The depressed patients and patients with schizophrenia met DSM-III-R (American Psychiatric Association, 1987) criteria for a major depressive episode and schizophrenia, respectively. The depressed subjects examined in this study were also examined in Study 2. Full details of this cohort can be found in Moffoot et al. (1994). Data from the morning test session were used in Study 1. In the depressed group, 13 patients had a unipolar course and seven a well established bipolar course to their affective disorder. Patients were required to be in good physical health and have no concurrent DSMIII-R Axis 1 disorder. Patients who had received ECT in the previous 6 months, and had had a change in their drug regime in the previous 2 weeks were excluded. All patients received antidepressants, some with more than one agent, with four prescribed neuroleptics additionally. All patients had been on a stable regime of medication for at least 2 weeks prior to testing, and, at the time of neuropsychological testing, had their medication omitted to prevent the effects of acute administration of medication on neuropsychological testing. The severity of depression was assessed using the 21-item Hamilton Depression rating scale (Hamilton, 1960). Patients defined as having acute schizophrenia fulfilled DSM-III-R criteria (American Psychiatric Association, 1987) for schizophreniform psychosis (N l 7), chronic schizophrenia with an actute exacerbation (N l 4) and subchronic schizophrenia (N l 9) and had a mean illness duration of 11n8 (.. l 16n7) months. Prescribed chlorpromazine equivalents were calculated following the procedure of Rey et al. (1989). The
Depression specific neuropsychological impairment
mean daily prescribed chlorpromazine equivalent dose of neuroleptics was 196 mg (.. l 300 mg). Sixteen patients received regular anticholinergic medication, with one subject on clozapine only and one prescribed lithium concurrently. None of the subjects were prescribed other antidepressant medication. Patients with chronic schizophrenia fulfilled DSM-III-R diagnostic criteria (American Psychiatric Association, 1987) for schizophrenia and scored � 4 on May’s scale of treatment resistance (May et al. 1998). They had been symptomatic for an average of 15n6 (.. l 9n95) years and were prescribed a mean daily equivalent of 512n6 mg chlorpromazine daily. All patients were on a steady dose of neuroleptic medication for 2 weeks prior to testing. Fourteen (35 %) received concurrent anticholinergic medication, with none on antidepressant medication. The mean positive and negative symptom scores, characterized using the PANSS (Kay et al. 1989), were 19n5 (.. l 6n3) and 20n7 (5n39) respectively. Controls were recruited from hospital nursing and secretarial staff as well as community volunteers. Controls who showed any evidence of a previous psychiatric or neurological history, or who were on medication with potential cognitive effects or psychotropic medication were excluded. Exclusion criteria for all subjects also included significant previous head injury, substance misuse, and the presence of medical disorders associated with cognitive impairment. The four subject groups were matched for years of full time education and pre-morbid IQ, which was estimated using the revised National Adult Reading Test (NART, (Nelson & Willison, 1991)) (Table 1). The depressed, chronic schizophrenic and control groups were age and sex matched. The acute schizophrenic group was younger and had more male subjects than the three other groups (Table 1). Study 2 In order to examine if the response to perceived failure varied diurnally in line with cognitive impairment, we further examined the data from the 20 depressed in-patients assessed in Study 1. The 20 in-patients with a major depressive episode were selected on the basis of having a clearly observable, prominent diurnal change in the intensity of their symptoms. This was
65
ascertained by the observations of nursing and medical staff and from patients’ own accounts. Patients received a comprehensive battery of neuropsychological measures and clinical ratings at 8 a.m. and 8 p.m., in a balanced design, such that half received their first battery of measures at 8 a.m., the other half at 8 p.m. Only results for performance on the simultaneous and delayed matching to sample are reported here, since previous work suggests this measure shows the largest abnormality in the response to perceived failure (Elliott et al. 1996, 1997). Patients and controls were also assessed prior to both psychometric testing sessions on parallel versions of the BFS (von Zerssen et al. 1974), an adjective checklist sensitive to changes in current fatigue and depression. Administration of the simultaneous and delayed match to sample computerized test (SDMS) In order to make our and Elliott et al.’s study (1997) more directly comparable, we performed the same simultaneous and delayed match to sample test from the CANTAB (Sahakian et al. 1988 ; Sahakian & Owen, 1992), which was administered via an IBM compatible computer fitted with a touch sensitive screen in a dedicated neuropsychological suite, using a standard procedure with standard instructions given to subjects. The SDMS is a complex test of visual memory in which the subject is presented with an abstract coloured pattern and then asked to pick this pattern from four similar choices. In the simultaneous match to sample test, the sample stimulus remains on the screen while the four choices were presented. In the delayed match to sample task, the sample stimulus disappears before the four choices are presented after delays of 0, 4 or 12 s. The simultaneous and the different delayed matching stimuli were presented in a random order. Analysis Data were analysed using SPSS (version 4.0) for the Macintosh. Comparison of groups in terms of age and gender ratio were made using the Mann–Whitney U and chi-squared tests. Univariate F tests were used for comparison between patient groups in the first study, with post-hoc differences identified using the Scheffe! procedure. Repeated measures ANOVA identified simple main effects in the study of
66
P. J. Shah and others
patients and controls on a diurnal basis, with post-hoc paired or unpaired t tests (2-tailed) as appropriate. Conditional probability analysis and the ‘ runs ’ test We used two methods to identify sensitivity of performance to explicit negative feedback. The first was as described by Elliott et al. (1996). This involves a simple calculation of the ‘ conditional probability ’ of a subject failing a problem on the SDMS given that he or she had failed the directly preceding problem. This is based on Bayes’ theorem, which states that the probability of event B occurring, given that event A has already occurred, is the probability of both events occurring divided by the probability of A. If both A and B are independent, this will be the same as the probability of B. The conditional probability can be calculated by dividing the number of errors made immediately following another error, by the total number of errors made. It is also suggested that this method of calculation controls for the overall error rate. The assumption is that, if the errors are independent of each other, an increase in the overall failure rate will lead to a proportional increase in the number of errors following errors, and so not have an effect on the overall conditional probability (Elliott et al. 1996). Additionally, we used the ‘ runs ’ test (Siegal & Castellan, 1988) to measure the distribution of errors within the match to sample task. The test is unrelated to conditional probability analysis and measures whether binary events are randomly distributed within a series, allowing a calculation of the probability of obtaining a particular series by chance, so permitting hypothesis testing. As an example, if a coin was tossed 20 times, the overall probability of obtaining heads may approach 0n5. However, if in this series, the first 10 were heads and the remaining tails, suggesting a ‘ grouping ’ effect within the series, it could be concluded that individual events may not have been mutually independent. In this example, there would be two ‘ runs ’, a run being defined as a succession of one or more identical events, followed and preceded by the alternative event(s) or no event. Conversely, if heads and tails in this series were distributed in a rigid alternating manner, there would be more runs than may be expected by
chance, suggesting an ordering or dissociating effect. Therefore, if within a series of 20 coin tosses, there was to be only one occurrence of ‘ heads ’ (not the first or last toss), the series would be defined as having three runs. The runs test allows a prediction of the range of the number of ‘ runs ’ that would be expected by chance, given the number of each of the binary events in the series, and allows a calculation of the chance probability of having a particular number of runs in a series. More generally, if m is the number of elements of one kind (e.g. correct responses on the SDMS task) and n the number of other elements (e.g. errors) then for a sequence of N (l mjn), if either m or n is � 20, a good approximation to the sampling distribution of r, the number of expected runs, is given as the normal distribution. A Z score can be derived expressing an effect size. To reject the null hypothesis at the 5 % level, Z values greater or less than 1n96 need to be obtained, Z values greater than 1n96 indicating a significant dissociating effect and Z values less than k1n96 suggesting statistically significant grouping of events. The full formula to derive Z scores is given in Appendix 1. This test has the advantage that it may detect if controls improve performance, and\or if depressed patients show worsening of performance on receiving negative feedback. If controls improve performance as has been suggested (Elliott et al. 1997), errors would be less likely to be grouped, increasing the number of runs above that expected by chance for a given number of errors and thus producing a mean group Z score � 1n96. Conversely, if any of the groups exhibit oversensitivity to perceived failure (Beats et al. 1996), errors would be grouped, reducing the number of runs below that expected by chance for a given number of errors and thus producing a mean group Z score 1n96. Additionally, the runs test explicitly takes account of the overall error rate. In the second study we examined, given no diurnal variation in the absolute performance of the SDMS task, if there was a difference in the distribution of errors between morning and evening testing, in keeping with diurnal mood variation and with possible variation in response to failure. Since Moffoot et al. (1994) found no diurnal variation in overall SDMS performance in depressives, and hence no difference in the
67
Depression specific neuropsychological impairment
men ( χ# l 0n05) than the other three groups. There were no significant demographic differences between the other three groups (Table 1).
error rate, the within subject comparison is a powerful way to measure if ‘ response to failure ’ varied in tandem with mood change. We calculated the Z value for each subject’s performance on the SDMS task, allowing us to compare the different groups’ mean Z scores.
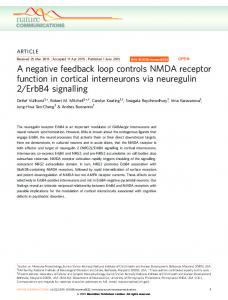
Performance on the simultaneous and delayed match to sample task Fig. 1 shows the mean number of errors and number of consecutive errors made in the different diagnostic groups performing the SDMS. There was, as expected a group effect (F(3, 117) l 11n13, P l 0n0000), controls making fewer errors than all three patient groups. There
RESULTS Acute schizophrenic patients were younger (F(3, 117) l 10n38, P l 0n001) and had more
Table 1. Demographic details (Study 1) Controls (N l 40)
Depressed (N l 20)
Acute schizophrenia (N l 20)
Chronic schizophrenia (N l 40)
Age, mean (..)
37n1 (13n9)
46 (14n1)
25 (4n5)*
38n1 (11n6)
Sex ratio (M : F)
24 : 16
11 : 9
18 : 2*
30 : 10
13n9 (3n5)
12n9 (3n5)
12n4 (4n6)
11n9 (2n4)
111n8 (9n8)
108n5 (15n6)
106n3 (8n7)
107n7 (10n3)
Years of education, mean (..) NART IQ, mean (..)
Statistic F( , ) l 10n4 $ ""' P 0n0001 χ# l 8n11 P l 0n04 F( , ) l 1n25 $ ""' P � 0n05 F( , ) l 0n07 $ ""' P � 0n05
* Significantly different from all other groups (P l 0n05).
14
* 12
*
*
Mean number
10
8
6
*
4
2
0
Controls
Depressed
Acute schizophrenics Group
Chronic schizophrenics
F. 1. Mean number of errors ( ) and consecutive errors ( ) made by the four subject groups on the SDMS. Bars represent standard errors of the mean (...). Significantly different results from the control group (P l 0n05) are shown by the asterisk. Patient groups did not differ from each other.
68
P. J. Shah and others
Mean conditional probability
0·4
* 0·2
Mean Z score
0·0
– 0.2
– 0.4 Controls
Depressed
Acute schizophrenics Group
Chronic schizophrenics
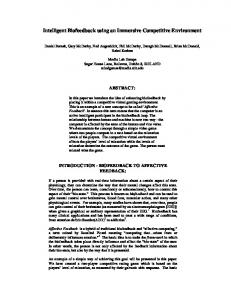
F. 2. Mean conditional probability and Z score from the runs test for the four subject groups. Bars represent standard errors of the mean (...). Significantly different results from the control group are shown by the asterisk. There was no difference between the three patient groups in conditional probability. Note that all four mean Z scores are within 0n5.
were no differences in errors between patient groups. In comparison with Elliott et al. (1997), there was a smaller difference in performance on the SDMS task between controls and depressed patients, with our controls achieving 86 % correct responses, and our depressed subjects achieving 76 % correct responses (" 90 % and " 73 % respectively, in the Elliott et al. (1997) study). The patients with acute schizophrenia achieved 75 % correct responses, with the chronic group an average of 70n6 % correct responses. Fig. 2 shows the mean conditional probability (CP) for the four groups. There was an effect of diagnostic group on conditional probability (F(3, 117) l 8n1752, P l 0n0001), which was due to a significantly higher CP in chronic schizophrenics compared with controls, and not, as expected, in patients with depression. Depressed subjects and acute schizophrenics did not differ from controls in conditional probability. Fig. 2 also shows the mean group Z scores for the runs test. All four group means were within p1n96 of 0 with no effect of diagnostic group (F(3, 117) l 0n45, P l 0n72). The data presented in Figs. 1 and 2 suggest that conditional probability may be dependent on the absolute number of errors made. According to Bayes’ theorem, if twice the number of errors were made, then, if events were
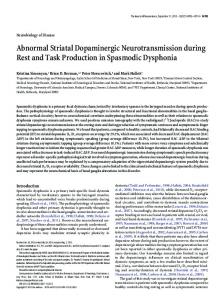
independent, there should be twice the number of consecutive errors made. We examined this relationship empirically by plotting the number of consecutive errors versus the total number of errors (Fig. 3). The relationship that best described the association between errors and consecutive errors was curvilinear, not linear, as would be expected if the ratio between the two was constant. For a fixed series of 40 events, if only a few errors are made, there was likely to be no consecutive errors (and therefore a conditional probability approaching 0), whereas, at the other extreme, as the number of errors approached 40, the number of consecutive errors approached 40 by chance (conditional probability approaching 1). Therefore, conditional probability varied non-linearly between 0 and 1 for a fixed series of 40 events. This was further confirmed by examining the relationship between CP, the number of errors made and the number of consecutive errors (Fig. 4). Conditional probability (CP) appeared to be linearly related to the number of errors and not constant. However, consecutive errors appeared to have a logarithmic relationship with CP. Variation of performance on a diurnal basis As reported in Moffoot et al. (1994), depressed patients performed more poorly on the SDMS task than controls, but did not show diurnal
69
Depression specific neuropsychological impairment 40·0
Consecutive errors
30·0
20·0
10·0
0·0 0·0
10·0
20·0 No. of errors
30·0
40·0
F. 3. Relationship between the number of errors and the number of consecutive errors made on the SDMS task for all subjects. Note the best fit line is curvilinear.
1·00
Conditional probability
0·75
0·50
0·25
0·00 0
10
20 Errors/Consecutive errors
30
40
F. 4. Relationship between conditional probability, errors (#, y l 0n155x!n&&&, r# l 0n763) and consecutive errors (5, y l 0n026xk0n018, r# l 0n631) on the SDMS task.
variation in performance, despite diurnal variation in other neuropsychological measures. Table 2 shows the comparison between morning and evening performances and measurements
for the depressed group. The mean number of errors, consecutive errors, conditional probability or Z score on the runs test did not differ between the two time periods. This was despite
70
P. J. Shah and others
Table 2. Clinical and demographic information on 20 depressed subjects examined on a diurnal basis
Pre-morbid IQ Years education (..) HDRS-21 (..) BFS Mood scale (..) SDMS task No. of errors (..) No. of consecutive errors (..) Conditional probability Z score (runs test)
Morning testing
Evening testing
P*
108n5 (15n6) 12n9 (3n5) 26n4 (3n2) 39n7 (9n6)
25n1 (14n8)
0n001
8n9 (4n9) 2n6 (2n5)
8n6 (4n4) 2n2 (2n5)
NS NS
0n25 k0n29
0n19 k0n17
NS NS
* Paired t test.
a significantly higher score on the BFS, and hence lower mood, during the morning testing session. There were no differences in these measures in the control group comparing morning and evening performance. DISCUSSION We found that conditional error probability was dependent on the total number of errors, varying non-linearly between 0 and 1. Thus, conditional probability was higher in groups who had a poorer performance in the neuropsychological task, such as patients with chronic schizophrenia. Using the runs test, which ensured independence from absolute error rate, we detected no clustering of errors in depressed patients or of a reduction in the expected random clustering of errors in control subjects. Because of this, both our studies did not support the notion that currently depressed subjects had an abnormal response to perceived failure in a cognitive task that involved explicit negative feedback, or that controls improved their performance in response to negative feedback. We were also unable to show any diurnal variation in the response to perceived failure in our depressed patients who had measurable diurnal variation in symptoms and performances of other neuropsychological tests. Our results are in contrast to the findings of Elliott et al. (1997), who described a diagnosis-specific elevation of conditional error probability in depressed unipolar subjects compared with patients from other diagnostic groups who were
equally impaired on the SDMS task. Finally, we found that patients with chronic schizophrenia, who performed most poorly on the SDMS task of our four groups, had a higher conditional error probability compared with controls. There are a number of reasons which may explain the difference with Elliott et al. (1997) study. First, although our depressed group matched Elliott et al. (1996) in terms of mean age, pre-morbid IQ, severity of depression and performance in the SDMS task, our depressed group had almost equal numbers of men and women, whereas Elliott’s group (1996) contained twice as many women as men. Hence, it may be that an abnormal response to failure may result from an interaction with a gender related mechanism. There was also a smaller difference in performance on the SDMS task between controls and depressed patients in our study compared to that of Elliott et al. (1997) (10 % v. 17 % difference in percentage correct trials, respectively). This could suggest the presence of depressive symptomatology in our control group. However, since we have found conditional probability (CP) not to be independent of error rate, it is more likely that the higher CP in our controls merely reflected the higher number of errors that they made. Also, the results of the runs test show that the distribution of errors in the control group was that expected by chance only. Another potential source of difference could be that the groups may have differed in the stage of development of the patients’ depressive episode at which testing was carried out, although illness severity was similar. For this to be true, however, there would have to be a dissociation between depression severity and psychological impairment. However, evidence from cross-sectional studies argue against this (e.g. Austin et al. 1992 a). It also remains unknown if psychological mechanisms such as an abnormal response to perceived failure are unchanged with chronicity, although Elliott et al. (1997) suggest that it may be a trait rather than a state-related phenomenon. Our sample differed from Elliott et al. (1996) by containing seven patients with well established bipolar disorder in comparison to their exclusively unipolar sample. It is uncertain if there are motivational differences in the de-
Depression specific neuropsychological impairment
pressive episodes of bipolar compared with unipolar patients, although psychotic patients have been found to have motivational deficits that affect cognition (Schmand et al. 1994). Finally, since depression may cover many possible aetiologies, it is possible that an abnormal response to perceived failure is not a fundamental psychological mechanism present in all patients with depression, but may typify only a subpopulation. Elliott et al.’s group (1996) of depressed patients, though of similar severity to ours, consisted of a mixture of in- and out-patients, compared with our sample of inpatients only. It could be argued that the psychological characteristics of patients manageable on an out-patient basis differed from those of in-patients. Further studies will be required to clarify this. We examined the relationship between the number of errors made on the SDMS and the number of consecutive errors. Our data suggest a curvilinear, and not, as should be expected, linear relationship. This could be explained by the SDMS having a fixed number (40) of trials. For a fixed series of 40 events, as the number of errors approaches 40, conditional probability has to approach unity, because the number of consecutive errors also has to approach 40. For this reason, we would argue that the ratio of consecutive errors to total number of errors does not compensate for group differences in the number of errors made, and that an alternative analysis such as the runs test, is more appropriate. The advantages of the runs test are that it is independent of the total error rate, and that it allows formal hypothesis testing. Using the runs test, we found no difference between diagnostic groups and no difference within the depressed group when tested diurnally. This suggests that, though patients with depression made more errors than controls, the distribution of errors was as likely to be random as grouped. Interestingly, neither conditional probability nor the runs test analysis showed diurnal variation in the depressed group or differences between controls at either of the two testing times, despite a significant clinical diurnal variation of mood and cognitive function in the depressed group. In summary, we have failed to support the claim that depressed patients uniquely demonstrate an abnormal response to negative
71
feedback or that control subjects improve their performance on receiving negative feedback. Further studies are required to investigate if such a mechanism may be related to gender, course of illness or restricted to a particular subpopulation with major depression. We would like to thank Dr B. Sahakian for providing us with a preprint of the article by Elliott et al. (1997), to Professor E. C. Johnstone and Dr S. Lawrie for access to data from the patients with schizophrenia, and to John Duffy and Alan Finlayson for statistical advice. We also thank Norma Brearley for the careful preparation of this article. P. J. S. was funded by the Sim Research Fellowship of the Royal College of Physicians (Edinburgh).
APPENDIX 1 Runs test The runs test is designed to test if a sample is randomly distributed (Siegal & Castellan, 1988). If m is the number of elements of one kind and n the number of elements of the other kind in a sequence of N l mjn binary events, and r the number of runs in the sequence (a run being defined as a succession of identical events preceded by the alternate event or no event at all), then, for m or n � 20, a good approximation to the sampling distribution of r is the normal distribution with and
Mean l µr l (2mn\N)j1
Standard Deviation l σr l N((2mn(2mnkN))\(N#(Nk1)). Therefore, when either m or n is greater than 20, H ! may be tested by Z l rkµr\σr l (rjhl2mn\Nk1)\ N((2mn(2mnkN))\(N#(Nk1)). where h lj0n5 if r 2mn\Nj1, and h lk0n5 if r 2mn\Nj1. Since the values of Z so obtained are approximately normally distributed with mean 0 and standard deviation 1 when H is true, the significance ! of any observed value of Z may be determined from a normal distribution table (Siegal & Castellan, 1988).
REFERENCES American Psychiatric Association (1987). Diagnostic and Statistical Manual of Mental Disorders, 3rd edn., Revised. American Psychiatric Association : Washington, DC. Austin, M.-P., Ross, M., Murray, C., O’Carroll, R. E., Ebmeier, K. P. & Goodwin, G. M. (1992 a). Cognitive function in major depression. Journal of Affective Disorders 25, 21–30. Austin, M.-P., Dougall, N., Ross, M., Murray, C., O’Carroll, R. E., Moffoot, A., Ebmeier, K. P. & Goodwin, G. M. (1992 b). Single
72
P. J. Shah and others
photon emission tomography with **mTc-Exametazime in major depression and the pattern of brain activity underlying the psychotic\neurotic continuum. Journal of Affective Disorders 26, 31–44. Beats, B. C., Sahakian, B. J. & Levy, R. (1996). Cognitive performance in tests sensitive to frontal lobe dysfunction in the elderly depressed. Psychological Medicine 26, 591–603. Beck, A. T. (1967). Depression : Clinical, Experimental and Theoretical Aspects. Staples Press : London. Beck, A. T., Rush, A. J., Shaw, B. F. & Emery, G. (1979). Cognitive Therapy of Depression. Guildford Press : New York. Bench, C. J., Friston, K. J., Brown, R. G., Scott, L. C., Frackowiak, R. S. J. & Dolan, R. J. (1992). The anatomy of melancholia – focal abnormalities of cerebral blood flow in major depression. Psychological Medicine 22, 607–615. Bench, C. J., Friston, K. J., Brown, R. G., Frackowiak, R. S. J. & Dolan, R. J. (1993). Regional cerebral blood flow in depression measured by positron emission tomography : the relationship with clinical dimensions. Psychological Medicine 23, 579–590. Brown, R., Scott, L., Bench, C. & Dolan, R. J. (1994). Cognitive function in depression ; its relationship to the presence and severity of intellectual decline. Psychological Medicine 24, 829–847. Cahill, L. & McGaugh, J. L. (1996). Modulation of memory storage. Current Opinion in Neurobiology 6, 237–242. Dolan, R. J., Bench, C. J., Brown, R. G., Scott, L. C., Friston, K. J. & Frackowiak, R. S. J. (1992). Regional cerebral blood flow abnormalities in depressed patients with cognitive impairment. Journal of Neurology, Neurosurgery and Psychiatry 55, 768–773. Dolan, R. J., Bench, C. J., Brown, R. G., Scott, L. C. & Frackowiak, R. S. J. (1994). Neuropsychological dysfunction in depression : the relationship to regional cerebral blood flow. Psychological Medicine 24, 849–857. Elliott, R., Sahakian, B. J., McKay, A. P., Herrod, J. J., Robbins, T. W. & Paykel, E. S. (1996). Neuropsychological impairments in unipolar depression : the influence of perceived failure on subsequent performance. Psychological Medicine 26, 975–989. Elliott, R., Sahakian, B. J., Herrod, J. J., Robbins, T. W. & Paykel, E. S. (1997). Abnormal response to negative feedback in unipolar depression : evidence for a diagnosis specific impairment. Journal of Neurology Neurosurgery and Psychiatry 63, 74–82. Hamilton, M. (1960). A rating scale for depression. Journal of Neurology, Neurosurgery and Psychiatry 23, 56–62. Hughes, J. R., Pleasants, C. N. & Pickens, R. W. (1985). Measurement of reinforcement in depression : a pilot study. Journal of Behavioural Therapy and Experimental Psychiatry 16, 231–236.
Kay, S. R., Opler, L. A. & Lindenmeyer, J. P. (1989). The positive and negative syndrome scale (PANSS) : rationale and standardisation. British Journal of Psychiatry 155, 59–65. May, P. R. A., Dencker, S. J., Hubbard, J. W., Midha, K. K. & Leiberman, R. P. (1998). A systematic approach to treatment resistance in schizophrenic disorders. In Treatment Resistance in Schizophrenia : An Approach for Research and Clinical Routine (ed. S. J. Dencker and F. Kulhanek), pp. 22–33. Friedr. Vieweg Verlag : Braunschweig\Weisbaden. Moffoot, A. P. R., O’Carroll, R. E., Bennie, J., Carroll, S., Dick, H., Ebmeier, K. P. & Goodwin, G. M. (1994). Diurnal variation of mood and neuropsychological function in major depression with melancholia. Journal of Affective Disorders 32, 257–269. Nelson, H. & Willison, J. (1991). National Adult Reading Test 2nd edn. NFER-Nelson : Windsor. Rey, M.-J., Schulz, P., Costa, C., Dick, P. & Tissot, R. (1989). Guidelines for the dosage of neuroleptics. I : Chlorpromazine equivalents of orally administered neuroleptics. International Clinical Psychopharmacology 4, 95–104. Robbins, T. W., Joyce, E. M. & Sahakian, B. J. (1992). Neuropsychology and imaging. In Handbook of Affective Disorders. (ed. E. Paykel), pp. 239–309. Churchill Livingstone : Edinburgh. Sahakian, B. J. & Owen, A. M. (1992). Computerised assessment in neuropsychiatry using CANTAB : discussion paper. Journal of the Royal Society of Medicine 85, 399–402. Sahakian, B. J., R.G., M., Evenden, J. L., Heald, A., Levy, R., Philpot, M. & Robbins, T. W. (1988). A comparative study of visuospatial memory and learning in Alzheimer-type dementia and Parkinson’s disease. Brain 111, 695–718. Schmand, B., Kuipers, T., Vandergaag, M., Bosveld, J., Bulthuis, F. & Jellema, M. (1994). Cognitive disorders and negative symptoms as correlates of motivational deficits in psychotic-patients. Psychological Medicine 24, 869–884. Siegel, S. & Castellan, N. J., Jr. (1988). Nonparametric Statistics for the Behavioural Sciences. McGraw-Hill : New York. Teasdale, J. D. & Dent, J. (1987). Cognitive vunerability to depression : an investigation of two hypotheses. British Journal of Clinical Psychology 26, 113–126. von Zerssen, D., Strian, F. & Schwarz, D. (1974). Evaluation of depressive states, especially in longitudinal studies. In Psychological Measurements in Psychopharmacology, vol. 7 (ed. P. Pichot), pp. 189–202. Karger : Paris. Wener, A. E. & Trehm, L. P. (1975). Depressive affect : a test of behavioural hypotheses. Journal of Abnormal Psychology 84, 221–227.