In this study we apply Template Matching as a method for breast cancer detection to a novel data set comprised of mammograms annotated according to ground ...
(IJACSA) International Journal of Advanced Computer Science and Applications, Vol. 7, No. 2, 2016
Abnormalities Detection in Digital Mammography Using Template Matching Ahmed M. Farrag Faculty of Computers and Information, Helwan University, Egypt
Abstract—Breast cancer affects 1 in 8 women in the United States. Early detection and diagnosis is key to recovery. ComputerAided Detection (CAD) of breast cancer helps decrease morbidity and mortality rates. In this study we apply Template Matching as a method for breast cancer detection to a novel data set comprised of mammograms annotated according to ground truth. Performance is evaluated in terms of Area Under the Receiver Operator Characteristic Curve (Area Under ROC) and Freeresponse ROC. Index Terms—Classification, Detection, Image Processing, Digital Mammography, Breast Cancer, Computer Aided Detection (CAD), Template Matching.
I. I NTRODUCTION Breast cancer is a disease that causes cells of the breast tissue to behave abnormally and grow out of control. They start invading the breast tissue and spreading (metastasizing) to other organs of the body. Breast tumors or Masses can be benign or malignant. Benign masses are characterized by their oval well-defined boundary, while malignant masses have a more speculated boundary. Breast cancer is the most common cancer among women in the U.S. (excluding skin cancer) [1]. In Egypt, 38.8% of cancer in women is breast cancer (ranking first for women) [2]. Early detection of breast cancer is key to higher survival rates. Women above 45 with average risk of getting the disease are advised to be screened twice every year. However, radiologists’ inexperience, fatigue, inattention and haste lead to false-negatives [3]. Computer-Aided Detection (CAD) systems are systems that process digital or digitized images and mark suspicious areas that the radiologist should pay attention to. Breast cancer CAD helps detect otherwise missed breast carcinoma. In a study by [4], the use of CAD resulted in 19.5% more malignant cases being diagnosed. However, [5]’s study showed no change in detection accuracy and recall rates with and without CAD. This can be explained by the difference in performance. ”Highly performing” CAD was shown to improve radiologists’ performance, while ”poor performing” CAD negatively affected their performance [6]. This shows how important designing a highly performing CAD system is. A. Data Collection Our data comprises of only digital mammograms. Our radiologist consultant provides, reviews and annotates each image. She marks the boundaries of the tumor and assigns its category. Markings are done according to ground truth, i.e. all subjects
were biopsied prior to the radiologist’s marking. The tumor is categorized according to the ”Breast Imaging Reporting and Data System” (BIRADS) scoring system (Table I). A special in-house tool was prepared specifically for this purpose. Both lesions and images were classified by the radiologist according to their BIRAD score. Category Category Category Category Category Category
0 1 2 3 4 5
mammographic assessment is incomplete negative benign finding(s) probably benign finding(s) suspicious abnormality highly suggestive of malignancy
TABLE I: “Breast Imaging Reporting and Data System” (BIRADS) scoring.
B. Related Work Template Matching is categorized as a model-based method of segmentation, meaning that it involves training and learning. Here, the training is to choose the best method parameters that yield the best result according to some assessment criteria (See section III). As early as 1989, Lai et al. [7] used template matching for detecting circumscribed masses in mammograms. Ng and Bischof in 1992 [8] used the same method. The problem with that approach was the disregard to different masses sizes. This problem is addressed in this paper by multiscale templates described in section II. The previously mentioned methods use correlation as a similarity measure. A different similarity measure is mutual information. It has been used by Tourassi et al. in 2003 [9]. Oliver et al. in 2006[10] and in 2008[11] proposed a probablistic template to match against. The template is learned from different training tumors. Brake et al. in 1999[12] proposed a multi-scale approach which we use in our study. Multiple templates of different sizes are used and the correlation to each template is calculated. The rest of the paper is organized as follows. In section II we detail our approach. In section III, we describe our assessment methods, namely the Area Under the ROC (AUC) and the FROC. In Section IV we show our results. In Section V we conclude the paper and discuss our recommendations for future work. 546 | P a g e
www.ijacsa.thesai.org
(IJACSA) International Journal of Advanced Computer Science and Applications, Vol. 7, No. 2, 2016
II. D ESIGN In this section, we introduce the method used in our study. The method belongs to the pixel-based algorithms. Pixel-based algorithms take as input features the plain grey-level of each pixel and its surrounding pixels up to L levels. In contrast, region-based algorithms use some image processing techniques to first segment the image into sub-regions which are then used for feature extraction. Classification for pixel-based algorithms is done per pixel, while in region-based algorithms it is done for the entire region.
This similarity is calculated in terms of correlation, which measures the covariance between the subimage and the template normalized by their variances. Examples of templates that have been used for breast cancer detection in the literature are the spherical template (Figure 2(a))[12] and the hyperbolic secant template (Figure 2(b))[14] The spherical template is defined as � 2 R − x2 − y 2 , if x2 + y 2 < R2 T (x, y) = , 0, if x2 + y 2 ≥ R2 where R is the template radius. The hyperbolic secant template is defined as T (x, y) = sech(x + y). Different template sizes have been tested starting at radius R = 4% . . . 12% of the image height. The multiresolution analysis conducted by Brake et al.[12] has been adopted. The scores for the same pixel produced by correlation of different template sizes have been combined. The final score of the pixel is the maximum of those combined scores. The combination of template sizes (6%, 8%, 10%) yielded best results in terms of an AUC of 0.8656 (AUC is described in III). III. A SSESSMENT A. AUC
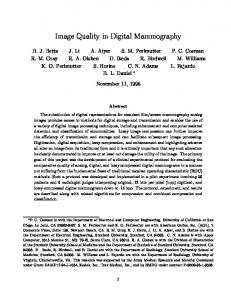
Fig. 1: A figure that illustrates the difference between analogue and digital mammography. To the left is an analogue image and below it is its histogram. The right is the same but with a digital image. It’s evident how the gray levels span a much broader range in an analogue image.
Before we start taking grey-level values as our features, preprocessing of all images is carried out. Images are captured using different imaging machines having different sensors with different sensitivity to radiation. Thus, images’ grey-level values need to be normalized first so that comparing their values would make sense. In addition to normalization, the breast needs to be segmented away from the background. In our study we used digital mammograms only; those mammograms have no artifacts and the background is almost all zeros making a whole literature on segmenting the breast in analogue mammograms irrelevant. In our study, simple methods like Kmeans or Otsu’s thresholding[13] were sufficient.
Different classification methods produce scores for every pixel (or region in case of a region-based approach as discussed in II). A certain threshold has to be selected above which the pixel is labeled Class A and below which it is labeled Class B. At different thresholds, some pixels are True Positives (correctly labeled as positives), and some are False Positives. Plotting the True Positive Fraction (TPF) against the False Positive Fraction (FPF) as the decision threshold is varied is called Receiver Operating Characteristic (ROC) curve [15]. The Area Under the ROC Curve (AUC) is a single number that can describe the performance of a classification method. It conveys how separable and distinguishable the two classes have become after using the method. An AUC of one indicates total separability. The AUC of a score image (probability images) is
A. Template Matching Template Matching is carried out by sliding a window of size Z × Z containing the desired template over the pixels of the image. Each pixel of the image gets a score according to how similar it and its surrounding pixels are to the template.
(a) Spherical Template
(b) Hyperbolic Secant Template
Fig. 2: A rendering of different templates
547 | P a g e www.ijacsa.thesai.org
(IJACSA) International Journal of Advanced Computer Science and Applications, Vol. 7, No. 2, 2016
defined as [ AU C I(c)
weighted average of Template Matching’s score and the two other methods. For the future we intend to further investigate MCS. In addition, Deep Learning has shown good results with similar problems. We think applying Deep Learning techniques in the literature should yield better performance.
n1 X n2 X
1 I(x