as analyzed from the Charter calls, and the available means, as found in the ..... as 105 change detection methodologies were presented. Based on these ...
Abrupt change detection on multitemporal remote sensing images: a statistical overview of methodologies applied on real cases Tarek HABIB1,2 , Jocelyn CHANUSSOT1 , Jordi INGLADA2 , Gr´egoire MERCIER3 1 GIPSA-Lab (Signal and Images Department), CNRS, INP Grenoble 2 Centre national d’´ etudes spatiales (Cnes) 3 TAMCIC/TIME, CNRS, GET/ENST Bretagne
Abstract— In the framework of the International Charter “Space and Major Disasters”, Charter calls are made to the signing parties every time a natural or technological hazard occurs. Consequently, space data are provided by the partners in order to help local authorities to assess the damages, organize and optimize the use of available resources. In such cases, abrupt change detection algorithms are required and numerous methods have been proposed by the Geoscience and Remote Sensing (GRS) community. In this paper statistics measured on Charter calls are compared to statistics measured on change detection methods published in the literature. These statistics aim to give the image processing community a better understanding of the needs and challenges faced in the case of real life disaster scenarios.
data, the required supervision, etc. A brief statistical review of change detection methods is presented. The aim of this paper is to put into perspective the needs, as analyzed from the Charter calls, and the available means, as found in the literature. This paper is divided as follows: section II presents statistics measured on the Charter calls, section III presents statistics measured on the change detection methodologies, section IV compares the statistics measured on the methodologies to those of the Charter calls and finally the conclusions are drawn in section V.
I. I NTRODUCTION In order to optimize the management of major disasters (flooding, fire, earthquake, tsunami etc.), the use of satellite remote sensing data can be of the utmost importance [1]. In complex geographical zones that are difficult for direct human access and requiring a fast and large scale coverage, remote sensing imagery is a powerful tool for resource management [2]. To ensure a fast and efficient distribution of the data when required, the International Charter ”Space and Major Disasters” – http://www.disastersCharter.org/ – has been signed by numerous administrations and agencies. When a major natural or technological hazard occurs1 , a Charter call is made to the signing parties and available data are distributed for an optimal management of the disaster. One of the key issues is then to compare data acquired before and after the disaster and detect abrupt changes [3], [4]. Between January 2001 and May 2006, there have been 96 Charter calls. In this paper, a statistical analysis of these calls is presented to sketch a panorama of the actual needs (type of hazards, type of required products etc.). In the meanwhile, change detection has gathered tremendous attention over the past few years and numerous algorithms have been proposed by the GRS community. As a matter of fact, over a hundred papers addressing this problem can be found in the recent literature. These algorithms can be classified in to several categories, depending on the type of 1 According to the Charter, natural disasters include earthquakes, tornadoes, cyclones, volcanic eruptions, floods or forest fires, while technological disasters include pollution by hydrocarbons, toxic or radioactive substances
1-4244-1212-9/07/$25.00 ©2007 IEEE.
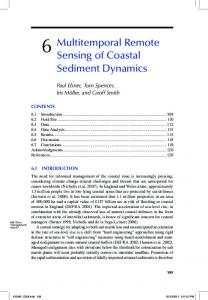
II. C HARTER C ALLS In the period between January 2001 till May 2006, 96 Charter calls were made. This period of five years could be representative of all real life scenarios that could face the international space data community. From floods and earthquakes to hurricanes and tsunamis, this period has seen a multitude of natural and technological hazards. According to this, statistics and measured figures on this period should provide a good perception of challenges that face the actual GRS community. In this section the statistics measured are concerned with the types of hazards, followed by a presentation of the different space products that could be delivered and the relevance of the products to different scenarios is discussed. Six main types of hazards were identified while examining the history of the Charter calls. These types are: floods, earthquakes, forest fire, hurricanes, landslides and technology related hazards. Fig. 1 shows the percentage of occurrence of each type. Flooding events are by far the main source for Charter calls. This has a technical reason, since in the case of floods and due to the nature of the remote sensors, adequate space data could be very rapidly provided to the interested parties. From the study of different Charter calls it was noticed that there is a need to establish norms in order to highlight the most adapted products for each type of hazard, the most suitable image resolutions as well as the maximum time lapse before the delivery of each product. Since these elements are mostly left to personal experience and evaluation, the
2593
Floods: 65%
Technology related: 3% Landslides: 4.75% Hurricanes: 6.25% Earthquakes: 11%
Fires: 10%
Fig. 1.
Types of hazards
following recommendations could serve as a guideline for such standardization process for different crisis scenarios: Floods: the most adapted emergency products are impact maps. Ancillary data such as a digital elevation models (DEM) could be of great use in order to be able to rebuild the flooding scenario, and thus be able to build more accurate impact maps and 3D animations that simulate the flooding process. A resolution in the order of 10 to 20m seems to be well adapted for the flood scenario according to the Charter calls. Earthquakes: very high resolution (2.5− m) data is needed in order to be able to visualize the impact of the earthquake on urban areas. Sometimes even resolution as high as 2.5m is not sufficient and requires the use of 1m resolution data (IKONOS for example). As for the final products, damage maps as well as impact maps are of great use, especially for on site rescue teams. In the case of a delay, the delivered products could loose their value in terms of saving lives (if the delay exceeds 72 hours after the quake). Once this delay is spent space data can be used as post hazard evaluation information that are useful for damage assessment. Forest fires and volcanoes: the most important information, aside from the damaged areas itself, are the hot spots. These are the points that are likely to catch fire during the fire fighting process. Based on this reasoning low resolution (30+ m) data including thermal bands are very useful. Otherwise for the already damaged areas, no ancillary information is necessary in order to build damage or change maps. Oil spills: these are considered as technology related hazards, the intervention has to be as fast as possible since the spill dissipates in a matter of hours. Due to its nature and for wide scale detection applications in general, low resolution (20+ m) satellite imagery is sufficient for this type of hazard. Several products derived from space data can be obtained. Two main product categories were identified from the Charter calls: the first category comprise visualisation related products while the second category comprise value added products. The visualisation related category includes products like space maps, mosaics and 3D animations. The value added category include classification, damage and impact maps. In the follow-
1-4244-1212-9/07/$25.00 ©2007 IEEE.
ing different product types are highlighted: Space maps: they constitute natural colour satellite imagery, sometimes coupled with road maps or information extracted from existing databases. Mosaics: these are obtained from concatenating several satellite images (or space maps if available) according to their position on the ground in order to obtain a global view of a given area. 3D animations: these can be constructed using satellite imagery coupled with other sources of information such as a Geographic Information System (GIS) or a DEM. This 3D animation is very difficult to obtain immediately during the crisis, but is an important tool for post-hazard damage assessment. This type of product is most suited for flood, fire and volcanic scenarios. Classification maps: these are maps obtained from the application of classification techniques to satellite imagery. Ancillary information sources could be used in order to increase the classification accuracy. This type of product can be used in the case of technology related hazards such as oil spills. A specific type of classification maps are the change detection maps where the changed regions are indicated on the original map. Impact map: these are the maps that highlight the impacted areas without specifying the degree of damage for each areas. For example an earthquake may hit an area causing little damage for a specific building but causing considerable damages for surrounding buildings this zone will be highlighted as high impacted area on an impact map. This type of product could be useful in post hazard studies. Impact maps are mostly used in the case of floods and fire related hazards. Damage maps: these are maps that have a colour key indicating the hit areas and the degree of damage that occurred on a specific region. Damage maps are mostly useful in the case of earthquakes as there are standards defining different damage degrees. After introducing the types of hazards as well as the different products that could be delivered, the next section discusses the change detection methodologies available in the GRS literature, as well as their compatibility with the needs in real life scenarios. III. C HANGE DETECTION METHODOLOGIES Change detection algorithms play a central role in the resource management procedure during and after the crisis. All of the value added products described above go through a change detection algorithm. These algorithms scale from simple ones (e.g. the difference image) to more complex algorithms. In the following statistics over a hundred change detection methods are analysed. The results obtained from these statistics are then compared to those measured on the Charter calls in order to highlight the available tools compared to the actual needs. From the literature, six main categories of change detection algorithms were identified: statistical, analytical, learn-
2594
ing based, multiscale, morphological and segmentation/object based approaches. Fig. 2 presents the popularity of each approach measured on 105 different change detection algorithms. Statistical: 32%
Analytical: 28% Multiscale: 5.5% Learning based: 9% Segmentation: 24%
Fig. 2.
Morphological: 4.5% Signature development: 1%
Change detection methodologies
The detailed description of each one of these categories and their respective advantages and disadvantages being beyond the scope of this study, only a brief description is given below. Statistical approaches: this category contains methods that put the change detection problem in a probabilistic framework. In order to compute the probability distributions of the change/no change classes the authors often resort to algorithms like expectation maximization (EM) or reduced Parzen estimator. Generally Markov random fields (MRF) are used in order to take into consideration the contextual information. The advantage of these approaches is that they require minimal human intervention and are either semi or fully automated. also the use of the probabilistic formulation provides more decision flexibility. On the other hand the use of such probabilistic models increases the complexity of the proposed algorithms. Analytical approaches: in these methods the authors tend to develop either predictive models for a certain behavior (i.e. change/no change) or perform algebraic operations on the reference and test images and compare the results obtained. The main advantages of these approaches is their relative simplicity as opposed to the statistical ones while providing comparable results. But their disadvantage is that they are highly sensitive to noise, especially in the case of active imagery. Another disadvantage concerning the predictive models is the need of more than two images in order to provide accurate results. Learning based approaches: these methods are based on the use approaches like neural networks and support vector machines to perform the classification. Mostly neural networks with only one hidden layer are used, having a number of input nodes equal to the number of input bands and the output nodes equal to the number of classes. The main advantage of these methods is the capability of directly obtaining classified change detection maps at the output, which provide information on the type of change. Another advantage is the low implementation and algorithm complexity and the ability to easily in-
1-4244-1212-9/07/$25.00 ©2007 IEEE.
corporate new information sources in the learning and the classification algorithms. However the disadvantages of these algorithms are the difficulty to obtain proper training data sets, the difficulty to automate the process and finally based on the training samples, the solution of the learning based algorithms is often constrained to a specific application. Multiscale approaches: these are methods that work on several multiscale versions of the original reference and test images. Multiscale transformations are obtained using for example wavelet decompositions, or simply by applying low pass filters. These methods try to overcome the problem of the difference in illumination and noise mainly in the case of active imagery. In terms of complexity these methods are more complex than the analytical methods but remains much more simpler than the statistical approaches. The main advantage of this category is that it provides good results in the presence of high noise levels. However for the case of using low pass filtering to obtain the different scales and in the presence of low noise levels these methods offer poor performances since the multiscale decomposition may loose its interest, and the method is transformed into a basic technique. Morphological approaches: use morphological operators for change detection. In the presence of low noise these methods tend to offer good performances especially when applied to passive imagery. Also these approaches are of a low algorithmic complexity. On the other hand they have several disadvantages in the context of satellite imagery and that they are very sensitive to noise, they alter the geometric information present in the image that is crucial in the context of risk assessment. Finally these methods are not applicable to active sensor imagery due to the presence of speckle noise. Segmentation and object detection: these methods are based on performing a first step of segmentation or classification of each image separately, and then perform a post classification comparison. The advantage of these approaches is that the detected regions are meaningful and mostly consist of connected regions. However the performance of these methods rely on the accuracy of the segmentation algorithm used, whose performance can vary from one application to another and thus puts the robustness of these methods in question. The change detection map’s nature (i.e. the output of the change detection algorithm) varies based on the applied methodology. The output of the different methods is one of three classes: binary, gray scale or classified change maps. A study concerned with the nature of the output of the different methods showed that: 43% of the methods produce a binary mask, 31% produce gray scale maps and 26% produce classified change maps. It should be noted that for statistical approaches the output is mostly binary maps, while for learning based approaches the classified change maps can be easily obtained.
2595
IV.
REAL CASES VERSUS METHODS
In this section the statistics measured on the methodologies are discussed in light of the Charter calls. Different criteria were of interest namely: the type of the change map, the capability to integrate ancillary data, the capacity to process multisensor data and the most adapted resolution for the proposed method. In the following paragraphs each of these points is highlighted. Binary change maps can be useful in the case of forest fires, volcanoes or technology related hazards since these hazards only requires the identification of the hit areas. Gray scale maps are more adequate for the construction of impact and damage maps for hazards like earthquakes and floods. Classification maps can be either used in parallel with gray scale maps in order to interpret post hazard damage and impact maps, or it can be used alone with a manual change identification or followed by a post classification comparison with a reference classified image. It was noted that in 46% of the cases ancillary data was available. Different ancillary data could be used in the case of natural or technological hazards, the most commonly used are: DEM, GIS, digital maps, population density information and topographical maps. These ancillary data provide a valuable source of information for the crisis scenario that is complementarty to the information obtained from the remote sensing imagery. From the categories of change detection methodologies stated above only two categories are able to directly benefit from this additional information: the segmentation and object detection based approaches and the learning based approaches. From fig. 2 it can be noticed that a maximum of a third of the methodologies are either already suitable, or require a slight modification to benefit from this new source of information that is available in almost half of the crises. A common need for obtaining accurate information concerning the post-hazard damage is the presence of reference pre-hazard information. In 79% of the cases it was possible to obtain reference images for the damaged areas. In the case of availability of reference images of the same sensor type as the new acquisitions, it is not mandatory to be able to process multisensor images simultaneously. From the study 23% of the cases had multi-sensor data, on the other hand from the study of the available methods it was noted that 15% of the methods can handle multisensor images, thus the real needs are in phase with the available means in this domain. However the main problem is the adequacy of the available imagery. Even if the type of reference and post-hazard imagery match, the quality of the images, the difference in illumination and the geometry differences as well as the time interval between the acquisitions makes the simultaneous use of the images questionable. For instance the cloud cover during flooding events is often present, thus the need of using radar imagery with the reference optical image. As it was highlighted in section II when the types of hazards were introduced, the resolution of the available images plays a central role in the accuracy and the adequacy of
1-4244-1212-9/07/$25.00 ©2007 IEEE.
the derived products. From the Charter calls high resolution images are preferred to low resolution ones since they are more adequate to the main categories of applications. In 56% of the calls high resolution images were available. In most cases this information is not directly mentioned in the literature, so the figures presented in this paragraph are based on the authors’ estimation of the performance of each algorithm using different image resolutions as well as the type of application presented in the corresponding paper. From this perspective it was found that 34% of the methods are most likely applicable to high resolution imagery, 23% are applicable to low resolution ones and 43% can be applied to both. This information shows that the GRS community provides adapted tools in terms of resolution to the real life scenarios presented by the Charter calls. V. C ONCLUSION In this paper statistics measured on 96 Charter calls as well as 105 change detection methodologies were presented. Based on these measures the need of developing generic change detection methods is quite evident. The hazards ranging from floods, earthquakes to hurricanes, landslides and technology induced disasters, application independent image processing algorithms should be used in order to produce the adequate crisis product. Also the availability of a multitude of data sources implies the use of generic systems able to integrate multiple data sources. In the context of risk assessment, image processing is handled by photo interpreters. This human intervention is important in order to obtain products of the highest possible accuracy. Photo interpreters are subject to many constraints, mainly accuracy and time constraints. Subject to these constraints and due to the high complexity of real life scenarios, the developed algorithms must be capable of taking advantage of the feedback provided by the photo interpreter in order to increase the accuracy of the products and of operating in pseudo real-time. R EFERENCES [1] J. Inglada, “On the real capabilities of remote sensing for disaster management-feeback from real cases,” Proceedings of the IEEE International Geoscience and Remote Sensing Symposium, IGARSS ’04, vol. 2, pp. 1110 – 1112, 20-24 September 2004. [2] H. Yesou, S. Clandillon, B. Allenbach, C. Bestault, P. de Fraipont, J. Inglada, and J. Favard, “ A constellation of advantages with SPOT SWIR and VHR SPOT 5 data for flood extent mapping during the September 2002 Gard event (France),” Proceedings of the IEEE International Geoscience and Remote Sensing Symposium, IGARSS ’03, vol. 1, pp. 567 – 569, 21-25 July 2003. [3] F. Sartand, J. Inglada, and J. Bessis, “The two emergencies of ”El Salvador” in the frame of the international charter ”space and major disasters”,” Proceedings of the IEEE International Geoscience and Remote Sensing Symposium, IGARSS ’03, vol. 3, pp. 1543 – 1545, 21-25 July 2003. [4] J. Inglada, J.-C. Favard, H. Yesou, S. Clandillon, and C. Bestault, “ Lava flow mapping during the Nyiragongo January, 2002 eruption over the city of Goma (D.R. Congo) in the frame of the international charter space and major disasters,” Proceedings of the IEEE International Geoscience and Remote Sensing Symposium, IGARSS ’03, vol. 3, pp. 1540 – 1542, 21-25 July 2003.
2596