1278
OPTICS LETTERS / Vol. 32, No. 10 / May 15, 2007
Absolute radiance imaging using parametric image amplification Sophie Brustlein, Eric Lantz, and Fabrice Devaux Département d’Optique P.M. Duffieux, Institut FEMTO-ST, Université de Franche-Comté, CNRS UMR 6174, F-25030 Besançon, France Received November 16, 2006; revised January 29, 2007; posted March 2, 2007 (Doc. ID 77139); published April 17, 2007 We show that parametric image amplification can be used to achieve a 2D radiance map directly expressed in photons per spatiotemporal mode. Radiance images of incoherent signals with less than one photon per mode (typically 10−2) are resolved. © 2007 Optical Society of America OCIS codes: 120.5630, 190.4410, 110.2960.
During the past few years, an optical parametric downconversion process has been successfully used for both absolute measurements of detectors’ quantum efficiency1,2 and spectral radiance.3,4 However, Refs. 3 and 4 deal with radiance measurements of a beam and not in an image. In Ref. 5, we have described how parametric interaction provides an absolute calibration of the radiance of an input signal. We report here, for the first time to our knowledge, experimental measurements of radiance in an image with results directly expressed in photons per spatiotemporal mode. From a quantum point of view, the field operators for the creation of photons signal and idler at the output of a nonlinear crystal can be written as6 † aˆout = aˆin cosh共gL兲 + jbˆin sinh共gL兲,
bˆout = bˆin cosh共gL兲 +
† jaˆin
sinh共gL兲,
共1兲 共2兲
where aˆ, bˆ and aˆ†, bˆ† are the operators for the annihilation and the creation of photons signal 共a兲 and idler 共b兲. In and out represent, respectively, the input and the output of the amplifier; L is the crystal length; and g is a gain term related to the pump pulse energy.
The mean number of photons signal per mode at the input is in † ¯nsignal = 具aˆin aˆin典.
共3兲
When there is no photon in the idler input channel in ¯ † , ¯b 典 = 0兲, the mean number of photons per ¯ idler = 具b 共n in in mode on signal and idler channels at the output of the amplifier is out † in ¯nsignal ¯ signal = 具aˆout aˆout典 = cosh2共gL兲共n 兲 + sinh2共gL兲 in ¯ signal = Gn + 共G − 1兲,
共4兲
out † ˆ in ¯nidler ¯ signal = 具bˆout bout典 = sinh2共gL兲共n 兲 + sinh2共gL兲 in ¯ signal = 共G − 1兲共n 兲 + 共G − 1兲,
共5兲
where G = cosh2共gL兲 represents the amplification gain. The mean number of photons per mode for spontaneous parametric downconversion (SPDC) on signal and idler channels at the output of the crystal is therefore given by nˆSPDC = sinh2共gL兲 = G − 1.
共6兲
According to Eq. (5), the mean number of photons in ¯nsignal of the input signal per spatiotemporal mode is
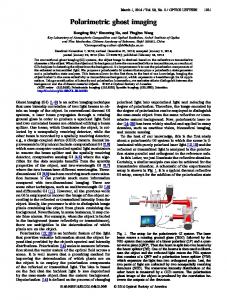
Fig. 1. Experimental setup: absorbing filters, F1,2; interferential filters, IF1,2; dichroic mirrors, D (Tmax = 710 nm, Rmax = 355 nm); spatial filter, SF. 0146-9592/07/101278-3/$15.00
© 2007 Optical Society of America
May 15, 2007 / Vol. 32, No. 10 / OPTICS LETTERS
Fig. 2. (Color online) Spatial frequency spectra at 700 nm: (a) SPDC only and (b) idler with SPDC. The spatial frequency contribution of the idler delimited by the SF is represented by the dotted circle. (c) Two-dimensional radiance map of the input signal.
directly obtained from experimental measurements as4,5 in ¯nsignal =
out ¯nidler − ¯nSPDC
¯nSPDC
.
共7兲
On the idler channel of a CCD camera, the gray levels of images obtained with and without signal at the out and input are, respectively, proportional to ¯nidler in ¯nSPDC, ensuring a direct calculation of ¯nsignal. Note that the ratio given by Eq. (7) is independent of the camera quantum efficiency, the amplification gain, and the number of detected modes during the acquisition. Then a 2D absolute radiance map can be achieved by applying Eq. (7) pixel by pixel to images obtained with and without signal. The experiment, represented in Fig. 1, is performed in a 5 ⫻ 5 ⫻ 10 mm3 triborate lithium crystal 共LiBO3 : LBO兲 designed for a type-1 collinear phase matching in the XY plane around degeneracy. Both sides of the crystal have antireflection coating for signal and pump wavelengths with a reflection coefficient lower than 1%. Then, losses for the signal at the input of the crystal can be neglected. At the output, since the amplified signal and the parametric fluorescence experienced the same reflection coefficient, there is no influence on the radiance measurement. The signal, corresponding to the spontaneous light emission of a dye solution sample, is obtained by illuminating the sample with the green light of the Nd: YAG laser. In our case, this fluorescence signal emits over a 680– 740 nm wavelength range and, before amplification, is spatially and spectrally filtered with, respectively, a pinhole [spatial filter (SF)] and a narrowband interferential filter 共IF1兲 centered on s = IF1 = 720 nm, ⌬IF1 = 5 nm. The sample is imaged on the input face of the crystal by a telescope system
1279
L1L2 with a magnification 兩␥ 兩 ⯝ 1. After amplification by the pump beam at p = 355 nm, the idler wave generated during the interaction is separated from the amplified signal by a second interferential filter 共IF2兲 centered on 700 nm with a bandwidth of 4 nm. The near field or far field of the crystal input is imaged on a cooled CCD camera. As mentioned in Ref. 5, the direct measurement of the number of photons per mode in the far field requires some precautions. First, the signal is spatially filtered around the collinear phase-matching direction in an angular range smaller than the angular bandwidth of the amplifier to define an area with a constant amplification gain. Second, all the spatial modes experiencing amplification in the near field have to be seeded by the signal at the input of the crystal. Hence, the whole transverse section of the crystal must be illuminated by the signal and the pump beams. Figure 2 represents images in the far field of the idler channel without [Fig. 2(a)] and with [Fig. 2(b)] an input image. Since the camera is placed in the Fourier plane of the lens L3, we observe spatial frequency spectra of the SPDC and idler. The time acquisition is 15 s (i.e., 150 cumulated laser shots). Applying Eq. (7) pixel by pixel to these images, we obtain a 2D radiance map directly expressed in photons per spatiotemporal mode. A comparison of gray levels of images [Figs. 2(a) and 2(b)] measured in the area represented by the dotted circle gives a mean number of 0.11 photons per mode. The camera is now placed in the conjugate plane of the object for experiment in near field. A resolution chart is illuminated by the dye fluorescence and is imaged on the input face of the crystal. In this case, all the spatial bandwidth given by the phasematching angular range must be seeded by the signal at the crystal input. Hence, the size of the SF is fitted to the spatial bandwidth of the amplifier. Images of the idler channel without [Figs. 3(a) and 3(e)] and with [Figs. 3(b) and 3(f)] signal have been recorded during 60 s (i.e., 600 cumulated laser shots). Because of spatial inhomogeneities of the pump beam [Figs. 3(a)–3(c) and 3(f)] subtraction of the background noise is required to retrieve spatial information carried by the idler [Figs. 3(c) and 3(g)]. The
Fig. 3. (Color online) Near-field images at 700 nm: (a) and (e) of the SPDC only and (b) and (f) idler with SPDC at the crystal input. (c) and (g) Subtraction of the background noise to retrieve spatial information. (d) and (h) 2D radiance maps of the input signal.
1280
OPTICS LETTERS / Vol. 32, No. 10 / May 15, 2007
images in Figs. 3(d) and 3(h) represent 2D radiance maps of both fluorescence signals at the input. Statistical measurements performed in the rectangular areas plotted on images [Figs. 3(d) and 3(h)] give a mean number of 0.050± 0.003 photons per mode for the first image series (horizontal lines) and 0.15± 0.03 for the second (number six). The variain tions of ¯nsignal in these radiance maps are due to a nonhomogeneous illumination of the sample by the green light of the laser. Note, however, that spatial inhomogeneities of the pump beam, though strongly visible on the SPDC image, have no consequences on in in agreement with Eq. (7). the ¯nsignal In conclusion, we have shown how the parametric image amplification can be used for 2D absolute radiance imaging either in the far field or in the near field. Images of input incoherent signals (in our case fluorescence dye signal) are directly expressed in photons per mode.
This work has been supported in part by the Agence Nationale pour la Recherche (project IRCOQ ANR-05-NANO-070-05). S. Brustlein’s e-mail address is
[email protected]. References 1. J. G. Rarity, K. D. Ridley, and P. R. Tapster, Appl. Opt. 26, 4616 (1987). 2. A. N. Penin and A. Sergienko, Appl. Opt. 30, 3582 (1991). 3. G. Brida, S. Castelletto, C. Novero, and M. Rastello, Metrologia 35, 247 (1998). 4. A. Migdall, R. U. Datla, A. Sergienko, J. S. Orszak, and Y. H. Shih, Appl. Opt. 37, 3345 (1998). 5. S. Brustlein, F. Devaux, and E. Lantz, J. Mod. Opt. 53, 799 (2006). 6. J. A. Levenson, I. Abram, Th. Rivera, and Ph. Grangier, J. Opt. Soc. Am. B 10, 2233 (1993).