Exploring Core-to-edge Transport in Aditya Tokamak by Oscillations Observed in the edge Radiation M. B. Chowdhuri, D. Raju, R. Manchanda, Vinay Kumar, Shankar Joisa, P. K. Atrey, C. V. S. Rao, R. Jha, R. Singh, P. Vasu and Aditya Team Institute for Plasma Research Bhat, Gandhinagar – 382 428, India
Abstract: Understanding of the transport in a Tokamak plasma is an important issue. Various mechanisms have been reported in the literature to relate the core phenomenon to edge phenomenon. Sawtooth and Mirnov oscillations caused by MHD instabilities are generally observed in Tokamak discharges. Observation of these effects in the visible radiation from outer edge may offer a possible means to understand the transport. Oscillations in the visible radiation from outer region of the plasma have been observed during recent Aditya discharges. Percentage modulation of these oscillations vary with the Lines of Sight (LOS) of the chords and surfaces on which they terminate. This has been found in both the low frequency (~ 1 kHz) oscillations that seem to correlate with sawteething in SXR signals and the higher frequency (~ 10 kHz) oscillations that correlate well with Mirnov signals indicative of m/n = 2/1 mode rotation. This suggests that the extent to which the MHD instabilities in the central region of the plasma column are reflected in the edge radiation depends on the interaction of the plasma with the surface at the extremity of the LOS. The release of particle/ energy accompanying the MHD instabilities leads to a large influx of particles from such surfaces. Cross-bispectral analysis suggests that a mode (having frequency of ~ 20 kHz) is also generated due to the interaction of m/n =1/1 (~10 kHz, seen in SXR) and m/n = 2/1 (~10 kHz, seen in Mirnov, Visible & Microwave Interferometer signals). By possible selection rules, this mode seems to be a m/n = 3/2 mode. This mode is seen in Mirnov, Visible & Interferometer signals. Behaviour of these oscillations on various LOS and their relation to SXR & Mirnov signals can lead to an understanding of the transport phenomenon. These observations and our interpretations will be presented.
e-mail:
[email protected]
1
Introduction: In this paper we report experimental observations on Aditya tokamak discharges, in which the sawteething activity in the core leads to periodic changes in the Hα signals with a surprisingly short delay of 200 microsec. These modulations are also observed in the ECE emissions from different radial locations between the core and the edge, with the delay periods progressively increasing outwards. These observations are strongly reminiscent of many observations in SXR and ECE emissions from other tokamak [1-4] and other magnetic confinement machines [5], which have lead to the postulation of a fast propagation of the energy released in a sawtooth [ST] crash, as a “heat pulse” (by which usually an electron temperature pulse is meant). In the light of available experimental evidence from Aditya, we have tried to infer the nature of the causal connection between the Hα modulation and sawteething in terms of heat pulse propagation. In the first section of the following, the experimental details of the Aditya Tokamak and the parameters of discharges typical of the ones analyzed in this paper are given. In the next section all the observations that bear upon the possible link between ST oscillations in the core and modulations in emissivity of Hα in the edge, are described. This is followed by an analysis of the observations to evaluate their consistency with the fast propagation of energy.
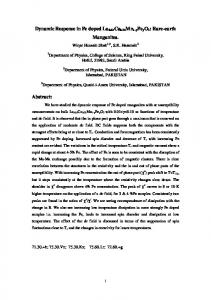
Aditya Tokamak: The ADITYA [6] tokamak (R = 75 cm, BT = 0.75 T, a = 25 cm with SS wall and a poloidal graphite limiter) has been producing ohmically heated circular plasma discharges. Typical parameter are: duration 70-80 ms, IP ~ 65-75 kA, ne(0) ~ 1.5x1013 cm-3, and Te (0) ~300 eV. The central chord A SCHEMATIC TOP VIEW OF ADITYA : averaged electron density is measured by a LOCATION OF VARIOUS DIAGNOSTICS microwave interferometer. The estimation TOP LIMITER TILE of electron temperature is by the ratio H-alpha & Impurities 1) BOLOMETER (R) method using soft X-ray emission from (Radial) 2) SET OF MIRNOV COILS core. Bolometer collecting VUV radiations H-alpha PL4 along a chord passing through center of the PL3 plasma gives an estimation of radiated power. The impurities line emissions and NIM (RADIAL) Hα emissions are routinely monitored by R=75 cm a=25cm PMT-Interference filter based detectors and normal incidence VUV monochromator ECE (NIM). A multichannel heterodyne (RADIAL) radiometer detects the ECE emissions from PL1 different radial locations. A set of 15 MICROWAVE PL2 Interferometry(T&B) Mirnov coils monitors poloidal magnetic SXR Imaging through pin hole camera(R) field fluctuations. Fig. 1 shows the location Fig.1 of different diagnostics on Aditya tokamak.
2
Results: Figure 2 shows Soft X-Ray (SXR) signals along a chord passing through plasma center and another along an off center chord. The sawtooth period is about 1 msec and the modulation is 30%. The core temperature (derived from the ratio of this signal to another filtered with Be-foil) is seen to change between 300 eV (pre crash) and 250 eV (post crash). In SXR signals the inverse ST pattern is seen usually along chords off centered by 6 cm and often in the 3 cm chord. From this we infer that the q = 1 radius is typically about 5 cm or smaller. The spatial resolutions of the SXR detectors and the small modulation in the weaker signals from the outer chords do not permit us to ascertain the inversion radius with higher precision for any particular shot. The above data leads to an estimate of ~ 2×10¹⁹ eV (which of course critically depends on rq=1) for the energy released from the core (q