AMIRIS – AN AGENT-BASED SIMULATION MODEL FOR THE ANALYSIS OF MARKET INTEGRATION OF RENEWABLE ENERGY UNDER VARIOUS POLICY FRAMEWORKS Matthias Reeg: German Aerospace Center, Institute of Technical Thermodynamics, Department of System Analysis and Technology Assessment, Pfaffenwaldring 38-40, 70569 Stuttgart Phone: +49-711-6862-282, E-Mail:
[email protected] Kristina Nienhaus, Uwe Pfenning, Nils Roloff - German Aerospace Center Wolfgang Hauser, Sandra Wassermann, Wolfgang Weimer-Jehle, CIRIUS – University of Stuttgart Uwe Klann, Institute for FutureEnergySystems Thomas Kast, Thomas Kast Simulation Solutions
Abstract Electricity generation from renewables in Germany has now reached a relevant magnitude for the energy sector. The further increase of electricity from renewable energy sources is driven by the Energy Concept enacted by the Federal Government in 2010 with the goal of transforming the energy system into a renewable based one by 2050 [BMU and BMWi 2011]. In order to achieve the political targets reorganisation in terms of technical, institutional and financial aspects is needed. The transformation and structural adjustments are characterised by a huge variety of actors, who are connected through complex interactions with one another and who react very differently to changes in the settings of the energy sector. We will present the agent-based simulation model AMIRIS (Agent-based Model for the Integration of Renewables Into the Power System), which can be used as a policy analysis and design tool to foster the integration of renewable energy sources into the electricity market. Additionally, we show some results of first simulation runs for the assessment of the ‘optional market premium’ in Germany until 20201. Keywords: Market Integration, Renewable Energy, Agent-based Modelling, Policy Framework, Market Premium.
Introduction and Overview There is a demand for changing the energy supply systems to more sustainable ones all around the world. The need for change is economically driven by the increasing long-term costs of fossil fuels caused by their decreasing availability; ecologically driven by the risks of climate change, and also technologically driven to gain progress in efficiency of low-risk energy systems with renewable resources. Increasing the share of renewable energies is seen as one pillar of this transition. With the expansion of renewable energy sources (RES) for electricity generation according to the political targets of the German government [BMU and BMWi 2011] organizational, technical and financial aspects of the electricity system need to be redesigned. In order to create well-defined and reliable political guidelines and frameworks for the necessary adjustment, it is essential to understand the actors’ patterns and options for action related to the discussed policy framework as well as the impact of their behaviour on the overall system. For the analysis of such complex and multiple linked systems with autonomous actors agent-based modelling (ABM) originating from the research field of artificial intelligence - is particularly suitable [Troitzsch 2009]. By applying the ABM approach to the issue of market integration and direct marketing of renewable energy a model based methodology for the assessment of support schemes is developed. This allows for taking the stakeholders’ decision rules into account as well as their behavioural adaptations (e. g. new business models) in consequence of changes of the policy environment. The AMIRIS Model enables the analysis of macroeconomic effects (system level) as well as microeconomic effects (actors level) in regard to policy modifications. In the second part of this paper (Policy Framework) we describe the development of the energy economic regulation and the Renewable Energy Source Act (EEG) in Germany in the past years as well as the current revision of the EEG 2012 with focus on their objective of fostering the market integration of RES. An important prerequisite for the set-up of the agent-based simulation model was the thorough analysis of the relevant actors. Therefore, a short description of the actor analysis is given in part three (Actor Analysis), followed by a short introduction to agent-based modelling and its application to energy markets in part four (Agent-based Modelling). The presentation of the AMIRIS model is conducted in chapter five (The AMIRIS Model), showing how the results of the policy and actor analysis were translated into a formalised model language. Finally, having in mind that the model is still under development we will present some first results of basic simulation runs analysing the effects of the introduction of the ‘optional market premium’ on the involved actors in Germany until 2020 (Results) before summing up the paper in the conclusion section. 1
The AMIRIS project is funded by the Federal Ministry for the Environment, Nature Conversation and Nuclear Safety; coordinated by the German Aerospace Center (DLR) - Institute of Technical Thermodynamics - Systems Analysis & Technology Assessment; in collaboration with ZIRN – Interdisciplinary Research Unit on Risk Governance and Sustainable Technology Development at the University of Stuttgart (merged to CIRIUS – Stuttgart Research Center on Interdisciplinary Risk and Innovation Studies in 2012), Thomas Kast Simulation Solutions and the Institute for FutureEnergySystems (IZES).
1
Policy Framework: From Market Introduction to Market Integration Since the liberalisation of the energy markets in Germany in 1998 the coordination of system relevant aspects like the power plant dispatch, the offer of balance energy as well as the supply of the electricity is organised over markets in which a lot of different actors are involved. To ensure a reliable system, the supply and demand of energy has to be balanced at all times. However in the future, energy systems and markets will have to deal with higher shares of intermittent renewable resources like solar power and wind aligned by the insecurity of their availability causing higher volatility and unpredictability in the energy markets. Though, biomass, water and geothermal energy (dispatchable RES) as well as energy storage, grid extension and demand side management can contribute to the balance of the system. Given that the focus of this study is on the market integration of RES the last three options are excluded from this study. The most important instrument to support RES in the past was the EEG. For the market introduction mainly dealing with fixed feed-in tariffs (FIT) and guaranteed buy-offs for electricity produced by RES through the Transmission System Operators (TSO). This act was embedded in a process of liberalisation aimed to open the energy markets from a more or less “closed shop” of some big companies to a widespread open market, including an energy exchange, new suppliers and also a great variety of technologies. The EEG, released in 20002, was revised several times in between (i.e. in 2004 and 2009) before relevant changes and reforms were made in 2012 to support the direct marketing approach, parallel to the FIT system. The argument was that increasing shares of RES (dispatchable and intermittent) call for a more demand oriented feed-in in order to better fit the liberalisation concept and stabilise the grid. With direct marketing it was assumed that several drawbacks of RES - especially of the intermittent ones like poor predictability and storability - would improve with private investments and innovations. Therefore, our analysis focuses on the current energy-economic changes from the revised EEG 2012. Since 2012 direct marketing is flanked by a new support mechanism called ‘optional market premium’. It enables to transfer the duties of selling the renewable energy from the TSO to renewable power plant operator (PPO) or intermediaries respectively. One focus of the investigation is on the development of new business models, innovative direct marketing strategies and new forms of cooperation between actors under the “old” EEG 2009 and the new regulation mechanisms like the ‘optional market premium’ (§ 33g EEG), the ‘flexibility premium for biogas plants’ (§ 33i EEG) and the modified ‘green electricity privilege’ (§ 39 EEG) [EEG 2012]. First ideas and attempts by RES PPOs to switch from the FIT system into direct marketing were already made in the years between 2006 and 2008. At this time wholesale electricity prices at the energy exchange were starting to rise - at least in a couple of hours of the year - to a level above the lowest FIT of wind. After the economic crisis in 2008 wholesale power prices fell from an annual average of 65,78 €/MWh in 2008 to 38,86 €/MWh in 20093 putting an abrupt ending to the first direct marketing efforts. Although direct marketing of RES using the so-called ‘green electricity privilege’ was possible since the beginning of the EEG in the year 2000, the term ‘direct marketing’ and its corresponding paragraph was not explicitly mentioned until the EEG amendment of the year 2009 (§ 17 EEG) - mainly regulating the time periods for deciding to opt for direct marketing and re-entry into the FIT system as well as notification duties to the TSO. As recently as the EEG 2012, direct marketing of RES is specifically promoted by law through the ‘optional market premium’ and the ‘flexibility premium for biogas plants’.
Actor Analysis In order to set-up the agent-based simulation model an actor analysis of the relevant actors was conducted. At its starting point the analysis took assumptions derived from the sociological theory of strategic action fields, as well as concepts from neo-institutionalism of organisational sociology. The theory of strategic action fields [Fligstein/McAdam 2011] offers a specific viewpoint by interpreting activities related to direct marketing as the attempt of competing actors to shape and design a specific field of action as a new market. Such a new, emergent field typically consists of three types of actors: incumbent actors, challengers, and governance units. In order to understand the competing interests and identities of the respective actors, it could be referred to neo-institutionalist organisational theories. Seen from this perspective, formal institutions, actors, and routines are mutually constitutive and influence each other. In order to understand the behaviour of economic actors, sociological concepts have developed alternative approaches to the typical neo-classical understanding of actors as the ‘homo economicus’. Typically economic actors’ behaviour is efficiency-oriented, but is nevertheless also led by external expectations and sometimes non-economic requests, and is thus shaped by dominant institutions in the specific organisational field [Scott 1995]. For this reason, different actors from differing backgrounds and environments develop different strategies with regard to their goals, as well as with regard to those strategies and measures required to reach their specific goals. For example the actions of new firms with close links to the environmental scene differ from large utility companies traditionally used to centralised structures.
2 3
The forerunner of the EEG, the “Stromeinspeisegesetz” was already introduced in 1990. Own calculations derived from market data purchased from the European Energy Exchange www.eex.com.
2
Those general theory-led assumptions and propositions were substantiated according to the objectives, strategies and interaction patterns of the different actors in the new action field of direct marketing. Then they were developed further on the back of document analysis and expert interviews. The assumptions were then tested and reassessed in interviews with representatives from the most important actor-groups, as well as in the context of an actor workshop. The actor analysis was complemented by further research data relating to trends, forecasts, and price developments. Furthermore assumptions on technological developments according to efficiency or the relevance of new energy technologies were taken into consideration. Finally propositions were formulated on how different actors would react to the new regulatory framework, which actors would profit from the new regulatory incentives, and which would be negatively affected. In a last step all these results were translated into a formalised model language in order to be integrated into the simulation model AMIRIS. For a detailed description of the actor analysis the reader is referred to the paper of Wassermann et al. of the 12th IAEE proceedings.
Agent-based Modelling and Simulation For the investigation of complex network systems the approach of multi-agent modelling and simulation is frequently used. In such economic systems the system as a whole follows an evolutionary path. In this it differs significantly from the usual assumption of the omniscient, utility-maximizing individuals of neoclassical economics that result in a series of general equilibriums [Arthur 2005]. The system behaviour in agent modelling results from the behaviour of individual agents - called actors in the real world - and is not centrally determined and controlled. The agents are situated in and influenced by a dynamic environment, which is simultaneously shaped through the actions of the agents - thus creating a complex structure with feedback loops. These heterogeneous agents are modelled having individual states, actions and goals. By implementing tactics and strategies it is also possible to model long-term action strategies. Agents can further be set up having the ability to communicate and cooperate with each other [Woodridge 2002], [Schmidt 2000]. In addition, the agents can be implemented with learning algorithms [Brenner 2006]. This enables them to improve over the course of simulation by gaining knowledge and, therefore, changing their basis of decision-making. Agent-based approaches to analyse market mechanisms are getting more and more popular in economics. But existing agent-based models of the energy sector either focus on the market mechanisms of conventional power systems and electricity markets [Bagnall/Smith 2005], [Grozey et al. 2006], on certain aspects of the market design of the wholesale market [Bunn/Oliveira 2003], [Genoese 2011], [Weidlich/Veit 2006], on the evaluation of specific bidding strategies and decision rules [Li/Shi 2012], [Trigo/Marques/Coelho 2009], [Melzian 2008], or - when dealing with RES - only on market processes, i.e. the influence of the increasing share of renewables on the market price [Sensfuß 2008]. So far no one has tried to set up an agent-based simulation model in order to analyse the policy framework of energy markets and its effect on the actors involved in the process of market integration of RES.
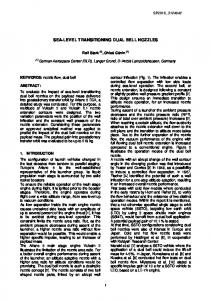
The AMIRIS Model The AMIRIS Modell has hitherto been developed in two consecutive projects from 2008-2012. The first project was designed to generally examine the feasibility of transferring the approach of agent-based modelling to issues of market integration of RES under different policy and regulatory frameworks focusing on wind energy. After having successfully demonstrated the methodology's feasibility [Krewitt et al. 2011] the model has been advanced. On the one hand photovoltaic and biomass plant operators have been added. On the other hand the implementation of landfill and sewage gas and EEG-supported hydropower plants was waived considering their relative negligible energy economic relevance in Germany. Another important new feature exists through the employment of a stylised merit-order model of the conventional power plants. This allows the calculation of a model-endogenetic stock market price. Hence, direct effects on the wholesale price resulting from an increased supply of renewable electricity are considered. Figure 1 shows the current model structure. The RES PPOs (see The Power Plant Operators Agents) can either sell electricity directly to the TSO ("passive" RES-PPO) receiving their remuneration through the FIT, or sign a contract and mandate one of the intermediaries to market the electricity directly ("active" RES PPO). Physically, the electricity generally flows via the TSO to the supplier, which symbolises the electricity demand and serves as the sink of the system. The demand side is not explicitly modelled yet, but is represented by standard load profiles. The RES PPO can be operated in combination with a local storage operator, which can be parameterised in order to represent different technical storage possibilities. As ‘storage and RES combined power plants’ are not in focus of this investigation, the storage operators are switched off. Instead the most differentiated agents are the intermediaries, representing either a completely new actor type or at least an actor who is setting up a new business in this field. Focusing on direct marketing they can concentrate on a certain marketing strategy (see The Intermediary Agents). When selling the electricity to the energy exchange or the supplier they are responsible for meeting the profile that was fixed days or weeks ahead. Since especially intermittent RES are 3
hard to predict correctly, the intermediaries might need balance energy (see The Intermediary Agents). With the predicted RES feed-in of 24h ahead the residual load is calculated by the energy exchange, before balancing the demand with the supply in order to determine the wholesale stock market price according to the merit order of the conventional generation system. External Data
Political Framework
← Electricity Feed-In Time Series
← Electricity Electricity Request → Wind Power Plant Operators Storage Operators
↓Electricity
Photovoltaic Plant Operators
Biomass-/Biogas Plant Operators
← Disposal Money → ßDisposal Moneyà
Tertiary Reserve Disposal ↓ ↑Money
Balance Energy Price
Disposal → ← Money ßà Disposal Money ßà Energy Exchange
Zwischenhändler Intermediaries Load Profile Delivery↓
Marginal Costs of conventional Generation System
Disposal ↑ ↓Money Transmission System Operator
Disposal ↓↑Money
ß Disposal
Load Curve
Moneyà Disposal↓ ↑ Money Electricity →
Laod Profile Request ↑ Supplier
Figure 1: AMIRIS Model Structure (Agent-based Model for the Integration of Renewables Into the Power System) The Power Plant Operators Agents So far we model the feed-in of wind, PV and biomass (divided into solid biomass and biogas) power plants, which represent in total 93.4 % of the EEG-promoted electricity generation and 80 % of the whole RES generation in Germany by the end of 2010. For reasons of manageability the plants are summarised into four classes for each RES as a function of their FIT-level and technological suitability for direct marketing. Reference calculations for the year 2008 show that we cover 97.7 % of real EEG-remunerations for wind, 95 % for PV and 87 % for biomass with this methodology. Table 1 shows the four defined wind classes and their development in terms of installed capacity and height of the mean FIT-remuneration level. Class 1 characterises wind turbines of the ‘basic remuneration’ level, class 2 and 3 turbines of the ‘increased starting remuneration’ level and class 4 off-shore wind turbines. 1 2 3 4 1 2 3 4 Classes [MW] [MW] [MW] [MW] Sum 1-3 [€/MWh] [€/MWh] [€/MWh] [€/MWh] Year 2012 1978 12025 15894 242 29897 61,9 84,8 90,9 190,0 2013 2703 12778 15603 625 31085 61,9 84,9 90,9 190,0 2014 4119 13355 14900 1925 32374 61,9 85,0 91,0 190,0 2015 5491 13770 14204 3325 33466 61,9 85,0 90,9 190,0 2016 7647 14046 12649 4825 34341 61,9 85,0 90,8 190,0 2017 10459 15290 9409 6325 35158 61,6 85,2 91,1 190,0 2018 12570 13769 9409 15000 35747 61,3 84,7 91,1 186,2 2019 13813 12373 9409 30000 35595 60,3 84,4 91,1 180,4 2020 14053 11244 9409 40000 34706 59,3 84,2 91,1 173,9 Table 1: Development of installed capacity and FIT height for wind PPOs. The development in terms of installed capacity and height of the mean FIT-remuneration level for PV is displayed in table 2. Class 1 represents PV plants on rooftops < 30 kW, class 2 rooftop PV between 30-1000 kW, class 3 rooftop PV > 1000 kW and class 4 PV on conversion areas and free space. 4
1 2 3 4 1 2 3 4 Classes [MW] [MW] [MW] [MW] Sum 1-4 [€/MWh] [€/MWh] [€/MWh] [€/MWh] Year 2012 14266 8923 348 3444 26981 305,4 333,8 253,7 253,0 2013 16016 10113 418 3934 30481 283,8 311,7 234,4 236,0 2014 17716 11269 486 4410 33881 266,4 293,0 218,8 221,7 2015 19366 12391 552 4872 37181 251,4 276,8 205,7 209,4 2016 20968 13480 616 5320 40384 238,4 262,7 194,3 198,6 2017 22566 14567 680 5768 43581 226,6 249,8 184,1 188,8 2018 24164 15653 744 6215 46777 215,9 238,0 174,8 179,8 2019 25767 16744 808 6664 49983 206,0 227,1 166,3 171,5 2020 27372 17835 872 7113 53192 196,9 217,1 158,4 163,8 Table 2: Development of installed capacity and FIT height for PV PPOs. Table 3 illustrates the defined biomass classes. Class 1 signifies biomass co-generation power plants between 520 MW fed with old wood and forest residues; class 2 innovative technologies (e.g. wood gasification); class 3 biogas power plants between 50-1000 kW fed with liquid manure and renewable crop materials, class 4 biogas plants > 5 MW fed with bio-waste. 1 2 3 4 1 2 3 4 Classes [MW] [MW] [MW] [MW] Sum 1-4 [€/MWh] [€/MWh] [€/MWh] [€/MWh] Year 2012 2172 91 2522 25 4810 97,0 164,1 175,6 142,3 2013 2289 192 2643 53 5177 97,3 171,5 176,9 140,8 2014 2397 341 2724 84 5547 97,6 173,4 177,5 139,3 2015 2499 538 2791 119 5947 97,7 173,5 178,0 137,7 2016 2591 790 2845 156 6382 97,7 172,9 178,3 136,2 2017 2675 1090 2899 197 6861 97,7 171,9 178,5 134,6 2018 2749 1447 2953 241 7389 97,7 170,7 178,6 133,0 2019 2816 1862 3007 288 7973 97,6 169,5 178,7 131,5 2020 2880 2334 3048 338 8599 97,5 168,2 178,8 129,9 Table 3: Development of installed capacity and FIT height for biomass PPOs. For wind and PV we use historical feed-in data of the four TSOs for the years 2006 till 2012. From 2012 onwards, feed-in is calculated by multiplying the installed capacity of each class with the time series of a typical meteorological year calculated with the REMix Modell [Scholz 2011]. The development of the installed capacity is derived from the ‘RES long-term scenarios 2011’ of the Federal Ministry for the Environment, Nature Conversation and Nuclear Safety [Nitsch et al. 2012]. Only for off-shore wind capacity in the years 2011-2016 data from the 'mid-term prognosis' of the four TSOs is used [IE Leipzig 2011], as data from the ‘RES long-term scenarios’ for this technology is not appropriate in the short term. Given that these studies state the development of RES capacity in an annual resolution we linearly interpolated the capacity deployment to get values for each hour of the year till 2020. The development of the FITs and their degression in the future orientate on the revised EEG 2012. So far the FIT is compensating for each kilowatt-hour (kWh) of produced electricity. Hence - although dispatchable - biomass and biogas PPOs were trying to produce as much electricity as possible by operating at full load throughout the whole day and year. Besides the ‘optional market premium’ the EEG 2012 introduced the ‘flexibility premium for biogas plants’ in order to actuate a more demand orientated operating strategy. The flexibility premium was designed to compensate for a portion of the necessary investments, e.g. for gas storage and additional generation capacity. But still, some of the investments need to be amortised by higher marketing values resulting from a more flexible feed-in of electricity at times of higher demand. Although the investment calculation is not yet implemented, we included a day-night-cycle operating strategy for those solid biomass and biogas PPOs who decide in favour of direct marketing. In this mode the plants run with half capacity during night-time (6 p.m. – 6 a.m.) and with one and a half capacity during daytime (6 a.m. – 6 p.m.) - and therefore profiting from higher and lower spot market prices. The Intermediary Agents For the set-up of AMIRIS the actor analysis originated ten different prototyped intermediary-agents which are distinguished in their marketing strategy and time of market entry, the tariffs they offer to the PPOs, their capital background, forecasting quality and search costs for gaining new PPOs as business partners (Wassermann et al.2012). In the model each intermediary can focus on one or two of five direct marketing strategies for the contracted electricity: 5
1. 2. 3. 4. 5.
Selling via the TSO receiving the FIT. Marketing via the energy exchange being paid the ‘optional market premium’. Trading via a supplier by using the ‘green electricity privilege’. Regional or local marketing through a direct-power-line to the end-consumer. Offering power plant capacity on the minute reserve market.
For reasons of current political discussions the focus of the first simulation runs was on the marketing strategy via the market premium. Hereafter the model and also the intermediary-agents were fitted to the characteristics shown in Table 4. When signing a contract with a PPO, the intermediary takes over all obligations of the electricity marketing. In return he receives the ‘market premium’ from the TSO and pays the PPO in addition to the FIT-remuneration a bonus of ‘X’. The ‘market premium’ consists of a ‘variable premium’ to balance the difference between the FIT and the market value of the RES and a ‘management premium’ for clearing further marketing cost [EEG 2012]. Prototype
Capital resources (million €) 100 15 15 15 7
Big national utility International utility Big municipal utility Municipal utility “Pioneer” Small municipal utility Green electricity trader for (6) 7 households Green electricity trader for (7) 7 business/industry Green electricity trader for local (8) 1 marketing Functional intermediary as spin-off (9) 3 from a big utility (10) Functional intermediary as start-up 0,1 Table 4: Subtype intermediaries and their characteristics. (1) (2) (3) (4) (5)
Market premium 2012 2012 2012 2012 2012
Tariff
Forecast quality
FIT+X FIT+X FIT+X FIT+X FIT+X
Good Good Medium Good Bad
2012
FIT+X
Good
2012
FIT+X
Good
-
FIT+X
Medium
2012
FIT+X
Good
2012
FIT+X
Medium
According to the EEG, additional costs which arise independently from the traded electricity (fixed costs) like office rent, labour costs, access to the European Energy Exchange (EEX) platform as well as IT- and office equipment are supposed to be remunerated by the ‘trading component’ of the ‘management premium’. The expenses which are directly linked to the traded electricity (variable costs) like the EEX trading fees, forecasting costs and expenses for balancing energy are intended to be rewarded through the ‘profile service component’ of the ‘management premium’. Due to the assumption that the intermediaries improve actions and routines over time, the management premium decreases from 12 €/MWh in 2012 to 7 €/MWh in 2015 for wind and PV PPOs and from 3 €/MWh to 2.25 €/MWh for dispatchable plants like biomass or water [Sensfuß/Ragwitz 2011], which forces the intermediaries to adjust their tariffs over time. With the help of the results of the actor analysis, additional expert-interviews as well as analysis of public available data, we reproduced the business cost structure of the intermediaries as shown in Table 5. Fix costs 1. Office rent 2. Office space factor: Number of 50 3. EEX access 4. IT-/ Office equipment 5. Labour costs: Trader Other staff
Variable costs 133 42 36 35 26 25 25.000 10.000 130.000 65.000
€/a*m² 1. EEX Trading fee 3. Specific labour costs (staff) Supervised volume / m²/E employee m²/E m²/E 4. Forecasting costs: m²/E Small portfolio m²/E Medium portfolio €/a Big portfolio €/a*E 5. Forecasting quality: Good €/a*E Medium €/a*E Bad
Table 5: Business cost structure of intermediary-agents in AMIRIS. 6
0,0075 0,052
€/MWh €/MWh
1.250.000
MWh/E
500-1500 1500-3000 3000-5000
€/MW MW --> €/MW: MW --> €/MW: MW --> €/MW:
15 10 5
Number of purchased forecasts: 3 Number of purchased forecasts: 2 Number of purchased forecasts: 1
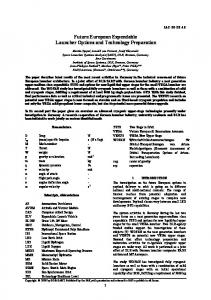
The resulting economies of scale can be clearly identified in Figure 2. For the adjustment of the tariffs we assume that at the beginning of each year half of the amount of the ‘management premium’ is paid as a bonus to the PPO. Additionally, according to the performance of the past business year the agent can adjust his tariff. At the end of each year the agents carry out a balance check by calculating their profit-turnover ratio and EBIT4 per employee. Being subject to these two success figures the bonus might be increased or decreased. For instance, if the EBIT per employee lies between € 100,000-300,000 the bonus remains Figure 2: Business cost of intermediary-agents in AMIRIS. the same. If the value of the success figure is between € 300,000-500,000 the bonus is raised by 25 %, if it exceeds € 500,000 the bonus is risen by 50 %. Counter wise if the EBIT per employee stays between € 50,000-100,000 the bonus is lowered by 25 % and below € 50,000 by 50 %. Apart from economies of scale there is another financial advantage for bigger players. The larger and more spatially diverse the managed portfolio of intermittent RES, the smaller is the forecast error in total. This is due to the so-called smoothing effect [Marrone et al. 2008]. Again we used results of the actor analysis and hence set the forecasting errors to 15 % of the produced electricity for good, 20 % for medium and 25 % for bad prognoses. With each GW of wind or PV added to the portfolio the forecasting error reduces by 1 % or is lifted by 1 % if the portfolio shrinks. The absolute feed-in error is calculated by a normally distributed random draw according to the forecasting quality and portfolio size of the intermediary and added to the perfect foresight feed-in laying 24 h ahead. The resulting feed-in schedule is then reported to the EEX and TSO. At the time of physical production, the hourly forecasted feed-in is compared to the real-time feed in of each hour. The caused balance energy amount is multiplied by an evenly distributed random draw of the historical balance energy prices of the year 20115. Due to the hourly simulation schedule, the random draw of the balance energy prices is executed in an hourly resolution as well. Depending on having intensified or debilitated the net total of the accounting grid of the TSO-area, the intermediary disburses or receives balancing payments. So far the intermediary is not yet trading on the real-time markets to balance the forecast errors. Model Parameterisation As stated in the Agent-based Modelling section we apply the approach of agent-based modelling and simulation to analyse self-evolving and emergent systems, respectively. In order to analyse the consequences of introducing the ‘optional market premium’ on the involved actors we need to relate two simulation runs: a ‘FIT system run’ and a ‘market premium run’. Since the model is still under development, the simulation runs so far are static. In this case static means that a) the intermediaries are not entering into competition and b) the PPOs are not able to switch contracts between the intermediaries if better tariff offers arise and c) the stochastic variables in the model are drawn with the same random seeds. Otherwise the results would not be comparable. Thus, the model is parameterised in the two following ways for the runs from the year 2012 till 2020: FIT system run This run simulates the hypothetical case in which everything stays the way it would be without introducing direct marketing support through the optional market premium in 2012. Hence all PPOs stay in the FIT system - no intermediaries are entering the market. The installed RES capacities and the height of the FIT develop as shown in tables 1, 2 and 3. Market premium run This run simulates the case in which the market premium is introduced in January 2012. For the static analysis some of the parameters need to be set external. This means the parameters can change over the course of 4
EBIT = Earnings before interests and taxes. As of the difficulties to forecast the development of balance energy prices, in addition to the 2011 balance energy prices two more basic histograms for balance energy prices can be employed: a) Having the distance to the uniform distribution in 2011 and b) reduction of the distance to the uniform distribution by a quarter. 5
7
simulation by adjusting the external data, but they do not change because of model endogenetic developments as it would be necessary for a real emergent system. This applies for the following initial parameters: Share of RES in direct marketing by each intermediary as shown in table 66. Share of biomass plants able to operate in flexible day-night mode. Prototype
Wind (onshore)
Wind (offshore)
PV
(1) (2) (3) (4) (5)
Big national utility 5% 35 % International utility 40 % Big municipal utility 1% 0% Municipal utility “Pioneer” 10 % 0% Small municipal utility 1% 55 % Green electricity trader for (6) 1% 0% households Green electricity trader for (7) 2% 0% business/industry Green electricity trader for (8) local marketing Functional intermediary as (9) 10 % 10 % 0% start-up Functional intermediary as (10) 30 % 100 % spin-off from a big utility Total initial capacity in 12.050 MW 48 MW 58 MW direct marketing Total share of installed 40 % 24 % 1% capacity in direct marketing Table 6: Share of direct marketed capacity for each intermediary in January 2012.
Biomass solid 20 % 35 % 5% 0% -
biogas 30 % 5% 5% -
0%
-
15 %
50 %
-
-
0%
-
25 %
10 %
933 MW 19 %
For the total initial capacity we referred to the published data of the TSOs in January7. The initial share of the intermediaries is derived from the actor analysis and public available data of different companies of the direct marketing business. To display the progress of the direct marketed capacity a linear fitting mechanism was implemented and is executed each month. We assume an increase of direct marketed capacity for wind onshore for all three classes from 40 % to 90 % and for wind offshore from 24 % to 100 % until the year 2015. For reasons of unsuitability for direct marketing we further figured that PV of class 1 will not opt for direct marketing at all. Thus an increase of direct marketed capacity for PV in class 2 up to 80 % and in class 3 and 4 up to 90 % results in an overall increase of installed capacity from 1 % to 40 % in the year 2015. As the biomass plants of class 2 (‘innovative technologies’) are still in the development phase, none of them decides in favour for direct marketing. Therefore a total increase of installed capacity from 19 % to 75 % until the year 2015 equals an increase to 90 % in class 1 and 76 % in class 3 and 4. The share of flexible biomass plants can also be increased linearly over time. It should be reminded that we assume that only power plants in direct marketing are willing to invest in the necessary equipment in order to switch to the day-night-cycle mode. Therefore, we estimate for biomass class 1 that 10 % are initially flexible, rising up to 50 % in 2015. As no plant of class 2 opts for direct marketing, no share is operated flexible. In class 3 originally no plant is flexible, but the portion increases to 50 % in 2015. Given that the support for biomass plants of class 4 was introduced for the first time in January 2012 through the EEG amendment, we estimate that all new plants are set flexible from the beginning.
Results A couple of months after the introduction of the ‘optional market premium’ there are many voices saying that the market premium and especially the management premium only cause windfall profits for many actors without really endorsing the integration of the renewable energies into the energy market. In the model no explicit investments in order to enable a more demand oriented feed-in for the intermittent RES are being carried out by the PPOs. Nevertheless, we can analyse the economic effects on the involved actors to get a hint if necessary investments e.g. in storage could be enacted or if even further windfall profits are to be expected. For reasons of reading convenience of the figures, Table 7 shows the corresponding years to the hours of simulation.
6 7
A dash in the table means that the intermediary is not active in the according technology segment. The TSOs publish data to direct marketing online: www.eeg-kwk.net.
8
Beginning of Year
2012
2013
hour 0 8760 Table 7: Simulation time table
2014
2015
2016
2017
2018
2019
2020
17520
26280
35040
43800
52560
61320
70080
To better evaluate the results in the context of price developments Table 8 displays the mean average wholesale power prices executed in the simulations runs. As the flexible biomass power plants of the ‘market premium run’ indeed influence the market price the power prices are slightly different. Mean average power price [€/MWh]
2012
2013
2014
2015
2016
2017
2018
2019
FIT-system run
51.14
50.68
51.81
53.44
55.16
56.57
57.03
58.71
Market premium run 51.23 50.77 51.84 53.39 Table 8: Mean average of wholesale power prices of simulation runs.
55.13
56.14
56.95
58.92
Impact on power plant operators As no direct marketing takes place in the ‘FIT system run’ we can analyse in a first step the generated incomes of the PPOs compared to the ‘market premium run’. Figure 3 shows on the left side the cumulative revenues of the wind PPOs in the ‘FIT-system run’. The curves show the expected characteristics. Wind PPOs of class 2 and 3 earn more or less linearly increasing up to the year 2020 € 18 bn., although incomes of class 2 are exceeding the incomes of class 3 by the middle of the year 2018. This can be explained by the change of installed capacity in these classes, which is increasing in class 2 and decreasing in class 3 (see also table 1). The reason for the convex increase of incomes in class 1 can be elucidated as follows: As time passes more and more wind turbines of the ‘increased starting remuneration’ classes (class 2 and 3) are falling into the lower ‘basic remuneration’ level (class 1) – therefore, the installed capacity of class 1 is rising over-proportionately. The nearly exponential growth of income of class 4 can be explained with the massive additional capacity installed form the year 2017 onwards.
Figure 3: Cumulative income of wind PPOs - 'FIT system run' (left) and the additional incomes in the 'market premium run' (right). On the right side of Figure 3 one can see the additional incomes in the case of the ‘market premium run’ compared to the first run. Looking at the concrete values of the generated incomes at the end of the year 2019 in Table 9 offers the opportunity to estimate if the additional revenues from direct marketing are sufficient for further demand oriented investments. PPOs of class 1 receive supplementary earnings of about € 550m, class 2 about € 870m, class 3 approximately € 780m and offshore PPOs almost € 350m. It has to be noted that this amount of money is only distributed among the plants which have decided in favour of direct marketing. Therefore, related to the produced electricity in direct marketing the specific additional revenues equal 4.2 €/MWh (class 4) to 5.1 €/MWh (class 3). The differences results from the different tariffs, which are offered by the intermediaries. As the share of on-shore and off-shore capacity in direct marketing differs between the intermediaries the various bonuses paid result in different incomes for the PPOs. A more detailed analysis of the paid bonuses by the intermediaries is conducted in section ‘Impact on intermediaries’. Cumulative income [m €] Wind PPO 1 Wind PPO 2 Wind PPO 3 8,333.9 18,000.6 17,342.1 FIT system run 8,889.7 18,870.8 18,123.5 Market premium run Table 9: Cumulative incomes of wind PPOs at the end of the year 2019.
Wind PPO 4 13,915.5 14,262.7
Figure 4 displays on the left side the cumulative incomes of the PV PPOs in the ’FIT-System run’. The wavelike structure of the curves clearly illustrates the increasing incomes in summertime and decreasing ones in wintertime. Compared to the income structure of the wind PPOs the curve progression between the different classes shows the same structure, resulting from the fact that the PV classes are mainly defined by the 9
technologies they represent. The installed capacity is always increasing and no switching of capacity between the classes takes place like in the case of wind energy. On the right side of Figure 4 the additional incomes due to direct marketing is shown. According to the installed capacity and its share in direct marketing classes 2 and 4 are profiting the most. As no plant of class 1 is participating in direct marketing no additional incomes can be observed.
Figure 4: Cumulative income of PV PPOs - 'FIT system run' (left) and the additional incomes in the 'market premium run' (right). Table 10 shows the concrete values of the supplementary incomes of the different PV classes. PPOs of class 2 are receiving additional earnings of almost € 300m, PPOs of class 3 are gaining € 15,000 and of class 4 nearly € 125,000. Compared to the wind energy the supplementary payments turn out quite low – although the bonuses paid by the intermediaries are the same for wind and PV PPOs (see also Impact on intermediaries). The reason is that direct marketing of PV starts on a much lower level than wind (1 % in January 2012 compared to 40 % of wind) and that only 40 % of the overall installed capacity of PV is opting for direct marketing until 2015. The fact that the load factor of PV is also lower than the one of wind - thus resulting in lower amounts of produced electricity per MW - can be used as a further reason for the lower overall revenues as the bonuses are being paid per MWh. Based on the specific additional incomes of PV PPOs of more or less 4.8 €/MWh the direct marketing activity is as attractive as for wind. Cumulative income [m €] PV PPO 1 PV PPO 2 33,351.9 23,566.0 FIT system run 33,351.9 23,860.2 Market premium run Table 10: Cumulative incomes of PV PPOs at the End of year 2019.
PV PPO 3 793.8 809.1
PV PPO 4 7,025.9 7,156.7
As long as the additional earnings by the wind and PV PPOs are not spend on equipment for a more demand oriented feed-in, the ‘market premium’ can clearly be viewed as evoking windfalls profits. Since especially the intermediaries are intrinsically motivated for direct marketing the electricity as good as possible, they will be the ones responsible for convincing the PPOs for taking the necessary actions. But to answer the question with AMIRIS if this will happen, will only be possible after further developments of the model. We conclude the analysis of the impact on the PPOs with a look on the biomass. Like in the case of PV the PPO classes are mainly defined by the technology they represent. The increase in revenues in the ‘FIT-System run’ develops more or less linearly until 2020 (see Figure 5). The only exception is class 2 displaying the deployment of innovative technologies like wood gasification, which is growing more than proportionally (see table 3).
Figure 5: Cumulative income of biomass PPOs - 'FIT system run' (left) and the additional incomes in the 'market premium run' (right). As displayed on the right side of Figure 5 and shown in Table 11 the additional incomes for the PPOs sum up to about € 410m in class 1, nearly € 450m in class 3 and a little more than € 50m in class 4. As no electricity from class 2 is directly marketed, no disparity in revenues can be witnessed. 10
Cumulative income [m €] Biomass PPO 1 Biomass PPO 2 Biomass PPO 3 15,431.8 9,848.2 31,007.6 FIT system run 15,864.2 9,848.2 31,552.8 Market premium run Table 11: Cumulative incomes of biomass PPOs at the end of year 2019.
Biomass PPO 4 1,371.5 1,423.5
In order to clarify the impact on incomes through a more flexible operating mode of the capacity moving into direct marketing, we need to have a look at the development of the hourly income flows over time. This is shown exemplary for biogas power plants (class 3) in Figure 6. It can be clearly seen that due to the share of flexible capacity, the income flow is splitting in higher remunerations in daytime (upper graph) and lower payments in half-load operation during night time. This in turn leads to higher marketing values and thus higher incomes for the intermediaries. Whether Figure 6: Hourly income flows of biomass PPO of class 3 this is passed on to the PPOs depends on including FIT and market premium. the tariffs offered by the intermediaries.
Impact on intermediaries By implementing ten different intermediary prototypes, we tried to embrace the quiet heterogeneous market structure of the direct marketing business. Figure 7 displays the development of the capital resources of the nine intermediary-agents, which use the market premium as support instrument. First of all it can be noted that no intermediary is going bankrupt, as all capital stocks are increasing until 2020. The stepped characteristic of the graphs results from the scheduling of the balance check. Only once, at the end of each year the intermediary sums up his expenses and payments. As a result of Figure 7: Development of capital resources of the intermediaryagents from 2012 until 2020. that the surpluses or losses of the year are accounted to the capital resources of the beginning of the year. Afterwards the new tariffs for the next year are calculated. However, the performance of the intermediaries is quite different. The most successful ones seem to be intermediary 2 and 10. This is due to the high shares of direct marketed capacity in their portfolio at the time of introduction of the market premium in January 2012 (see table 6). The advantage of being able to contract a lot of capacity from the beginning results from the early activities in the direct marketing business of these two intermediaries. More interesting is the question whether these two are able to defend their exclusive position in reality. As no direct competition is yet implemented and therefore no changes between the direct marketed capacities of the intermediaries take place, first estimations can be drawn from the offered tariffs. As one can see in Figure 8 all intermediaries except no. 3 and 6 are able to raise their tariffs after the year 2012. Intermediaries no. 1, 2, 4, 7, 9 and 10 can even increase their bonus payments up to 7.5 €/MWh for intermittent and 2 €/MW for dispatchable RES before having to continually decrease their payments until 2015. At this point the management premium has been decreased to the lowest value of 7 €/MWh for intermittent and 2.25 €/MWh for dispatchable RES.
11
Figure 8: Bonuses paid by the nine intermediary-agents using the ‘market premium’ for intermittent and dispatchable RES from 2012-2020. The fact that obviously no intermediary offers a higher tariff than 7.5 €/MWh, which is also paid by intermediary 2 and 10, can be carefully interpreted as hints leading to the conclusion that these two will be able to defend their competitive position. Comparing the absolute additional incomes from direct marketing via the market premium between the different PPOs and the intermediaries would lead to the conclusion that the supplementary incomes are situated in more or less the same range. Additional incomes for PPOs vary between € 15.000 for PV of class 3 and € 870m for wind of class 2; the diversity in incomes between the different intermediaries ranges from nearly € 20m (no. 6) to € 600m (no. 10). But taking into consideration that the additional incomes for the PPOs classes are distributed among a much higher amount of individuals than in the case of intermediaries, the latter seem to profit even 12
more from the introduction of the ‘optional market premium’. But to conclude that this development is accompanied by windfall profits is risky. In general, windfall profits are the claim of financial incentives for a behaviour that would have been carried out even without additional payments. This is certainly not true in the case of direct marketing, as the services by the intermediaries of marketing the RES would not have taken place in this extent without the ‘optional market premium’. Undoubtedly, the height of the support can be questioned, as the intermediaries might have also been active with a lower premium. Last but not least attention has to be drawn to the fact that the overall financial situation of the intermediaries is heavily dependent on the balance energy payments. As no real-time markets are yet realised in the model, all intermediaries are hooked to the balance energy prices of the TSOs. Having in mind that these prices can neither be influenced by the intermediaries nor are they able to predict whether they will have to pay for imbalances or receive payments, the results of the runs need to be interpreted with caution. If the intermediary redounds to the imbalance of the TSO-area he has to pay balance energy fees (negative values in Figure 9), if he counterbalances to the imbalance of the TSO-area due to his forecast error he receives payments (positive values in Figure 9). Compared to the results from the actor analysis the balance energy payments of the intermediaries in the model seem to be reasonably lower than in reality. This becomes clear when having a look at the annually cumulative balance energy payments as shown in figure 9. Especially intermediary no. 10 seems to profit just by incident massively from received payments in millions. Therefore in the Figure 9: Annually cumulative balance energy payments of future the random seeds of the random intermediary-agents between 2012-2020. generator, which are used for the capacity forecast error and the balance energy price need to be varied for all intermediaries in multiple simulation runs. The mean results of the various runs will then give a less random picture of the economic benefits or losses due to the required balance energy amounts.
Conclusions and Outlook In a pilot project a first, yet simplified agent-based simulation model was developed focusing on the direct marketing of wind energy. After the successful demonstration of using the method of agent-based modelling for the analysis of different policy options, the model was expanded to other relevant actors for direct marketing of renewable electricity (photovoltaic and biomass/biogas plant operators). In addition, a merit-order model of the conventional generation system was implemented to calculate a model endogenic stock market price. The focus of the investigation is on the one hand on the opportunities of gaining additional revenues through the direct marketing supported by new regulation mechanisms like the ‘optional market premium’ (§ 33g EEG). On the other hand, additional risks related to direct marketing, to which different actors with different capital backgrounds and energy portfolios are exposed to, are analysed under the paradigm of imperfect knowledge. First static simulation runs show that the introduction of the ‘market premium’ leads to diverse economic effects on the PPOs as well as on the intermediaries. Even if the macro-economic impact like the overall costs of the support mechanisms of different schemes might not be so diverse, the micro-economic impact on the different actors itself can be huge. Viewing market integration processes of renewables from an agent-based perspective allows for innovative computational analyses of the interdependencies between the relevant actors. It goes beyond standard market structure analysis by attempting to combine actor based and systemic considerations. With the agent-based simulation model AMIRIS influences of different market-designs on a macro as well as a micro scale can be analysed. These kinds of analyses are necessary to be able to construct sound support schemes in order to promote market development on the one hand but prevent windfall profits by certain actors on the other hand. Future work will concentrate on a more dynamic sampling of the agents and of the model itself. Up to now many parameters of the model and especially of the agents can change over time but are set external. Other aspects to be included deal with the analysis of different market designs for the time when high shares of renewables will be integrated into to the energy system.
13
References Arthur (2005): Out-of-equilibrium Economics and Agent-Based Modelling. Online: http://www.santafe.edu/research/publications/workingpapers/05-09-037.pdf (12.01.2007). Bagnall and Smith (2005): “A multi-agent model of the UK market in electricity generation”. Department of Economics Iowa State University. Iowa. Online: http://www2.econ.iastate.edu/tesfatsi/ACEElectric.Bagnall.pdf (10.05.2010). Brenner (2006): “Agent Learning Representation - Advice on Modelling Economic Learning”. In: Handbook of Computational Economics, Volume 2. Tesfatsion and Judd (Edt.). Elsevier: DOI: 10.1016/S15740021(05)02016-2. Bunn and Oliveira (2003): “Evaluating individual market power in electricity markets via agent-based simulation”. In: Annals of Operations Research, Vol. 121, pp. 57–77. EEG 2012: Gesetz für den Vorrang Erneuerbarer Energien (Erneuerbare-Energien-Gesetz). Online: http://www.gesetze-im-internet.de/bundesrecht/eeg_2009/gesamt.pdf (26.06.2012). Federal Ministry for the Environment, Nature Conversation and Nuclear Safety (BMU) and Federal Ministry of Economics and Technology (BMWi) (2010): Energy concept – for an environmentally sound, reliable and affordable energy supply. Online: http://www.bmu.de/files/english/pdf/application/pdf/energiekonzept_bundesregierung_en.pdf (10.10.2010). Fligstein and McAdam (2011): “Toward a general theory of strategic action fields”. Sociological Theory, Vol. 29, No. 1, pp. 1–26. Genoese (2011): Energiewirtschaftliche Analysen des deutschen Strommarkts mit agentenbasierter Simulation. Dissertation, KIT - Karlsruhe Institute for Technology. Grozey, Batten, Anderson, Lewis, Mo and Katzfey (2006): “NEMSIM - Agent-based Simulator for Australia’s National Electricity Market”. Melbourne: CISRO Manufacturing and Infrastructure Technology. Krewitt, Nienhaus, Roloff, Weeber, Reeg, Weimer-Jehle, Wassermann, Fuchs, Kast, Schmidt, Leprich, Hauser (2011): Analyse von Rahmenbedingungen für die Integration erneuerbarer Energien in die Strommärkte auf der Basis agentenbasierter Simulation. Project Report for the Federal Ministry of the Environment, Nature Conservation and Nuclear Safety, Stuttgart, Saarbrücken, Vilshofen. Leipzig Institute for Energy (IE Leipzig) (2011): Mittelfristprognose zur deutschlandweiten Stromerzeugung aus regenerativen Kraftwerken bis 2016. Study on behalf of Amprion GmbH, 50Hertz Transmission GmbH, EnBW Transportnetze AG and TenneT TSO GmbH, Leipzig. Li and Shi (2012): “Agent-based modeling for trading wind power with uncertainty in the day-ahead wholesale electricity markets of single-sided auctions”. Applied Energy, 2012, To be published: http://dx.doi.org/10.1016/j.apenergy.2012.04.022. Marrone, Knorr, Lange, Beyer (2008): “Characterization and Modeling of the Variability of the power output of aggregated wind farms - approaches to quantify the smoothing effect”. 7th International Workshop on Large Scale Integration of Wind Power and on Transmission Networks for Offshore Wind Farms. Melzian (2008): Handelsstrategien im deutschen Elektrizitätsmarkt - Untersuchung der Gebotsstrukturen und agentenbasierte Simulation des EEX-Spothandels. Dissertation, Institute of Energy Technology, Technical University of Berlin. Nitsch, Pregger, Naegler, Heide, Luca de Tena, Trieb, Scholz, Nienhaus, Gerhardt, Sterner, Trost, von Oehsen, Schwinn, Pape, Hahn, Wickert and Wenzel (2012): Langfristszenarien und Strategien für den Ausbau der erneuerbaren Energien in Deutschland bei Berücksichtigung der Entwicklung in Europa und global. Project Report for the Federal Ministry for the Environment, Nature Conversation and Nuclear Safety (BMU). Stuttgart, Kassel, Teltow. Schmidt (2000): Die Modellierung menschlichen Verhaltens. SCS – European Publishing House, Delft. Scholz (2011): Renewable Energy based electricity supply at low cost - development of the REMix Modell and application for Europe. Dissertation, University of Stuttgart. Scott (1995): Institutions and Organizations. Thousand Oaks, London. Sensfuß (2008): Assessment of the impact of renewable electricity generation on the German electricity sector An agent-based simulation approach. Dissertation, Karlsruhe Institute of Technology. Sensfuß and Ragwitz (2011): „Weiterentwickeltes Fördersystem für die Vermarktung von erneuerbarer Stromerzeugung“. Working Paper: Fraunhofer Institute for Innovation and System Research, Karlsruhe. Online: http://publica.fraunhofer.de/dokumente/N-158218.html (20.05.2011). Trigo, Marques and Coelho (2009): “Temmas: The electricity market multi-agent simulator”. In: Proceedings of the 10th International Work Conference on Artificial Neural Networks, Part 1: Bio Inspired Systems Computational and Ambient Intelligence, 2009, pp. 569–576. 14
Troitzsch (2009): “Perspectives and Challenges of Agent-Based Simulation as a Tool for Economics and Other Social Sciences”. Proceedings of the 8th International Conference on Autonomous Agents and Multiagent Systems (AAMAS), Decker et al. (Edt.), Vol. 1, 10.-15.05.2009, Budapest, Ungarn. Wassermann, Hauser, Klann, Nienhaus, Reeg, Rhiel, Roloff, Weimer-Jehle (2012): “Renewable Energy Policies in Germany: Analysis of Actors and new Business Models as a Reaction to the Redesign and Adjustment of Policy Instruments”. Proceedings of the 12th IAEE European Energy Conference. Venice, Italy. Weidlich and Veit (2006): “Bidding in interrelated day - ahead electricity markets - insight from an agent-based simulation model”. Online: http://www.im.uni-karlsruhe.de/Upload/Publications/824eb244-6966-400e-a1ef-c58186ecf7b9.pdf (30.3.2011). Wooldridge (2002): An Introduction to Multi-Agent Systems. John Wiley & Sons, Chichester.
15