Bangladesh Journal of Physics, 15, 93-103, 2014
A THEORETICAL STUDY OF ELASTIC, ELECTRONIC, OPTICAL AND THERMODYNAMIC PROPERTIES OF AlB2 AND TaB2 N. JAHAN*, M. A. ALI
Department of Physics, Chittagong University of Engineering and Technology , Chittagong, Bangladesh. Received on 28.04.2014, Accepted for publication on 21.06.2014
ABSTRACT Using ab-initio method we have studied the structural, elastic, electronic, optical and thermodynamic properties of AlB2 and TaB2. We have used plane wave pseudopotential with generalised gradient approximation as implemented in CASTEP program. The independent elastic constants, bulk modulus, Young’s modulus, shear modulus, anisotropic factor, Pugh ratio, etc are calculated. This results show that AlB2 and TaB2 are mechanically stable. We have also calculated the band structure and density of states. Band structure results show that AlB2 and TaB2 show metallic behaviour. In order to understand the electronic properties in a better way we have also calculated dielectric function, refractive index, absorption coefficient, conductivity, loss function and reflectivity. Results of absorption coefficient and conductivity are in good agreement with the band structure results. The effect of temperature and pressure on the bulk modulus, Debye temperature, specific heat and also on the thermal expansion coefficient are derived from the quasi-harmonic Debye model with phononic effect in both cases.The results for the elastic and electronic properties are compared to experimental measurements and with the results obtained in different band-structure calculations, however, no optical data are available for comparison. Keywords: First-principles; Elastic properties; Electronic band structure; Optical properties.
1.
INTRODUCTION
Transition metal diborides have been received a great deal of interest for many years, due to their unique physical and chemical properties such as hardness, high melting point, chemical inertness, etc., and belong to the most potential materials for industrial applications [1-12]. Moreover, the discovery of superconductivity in MgB2 at TC ~ 39K [13] has led to an extensive search in finding superconductivity in other diborides with hexagonal AlB2-type structure. One of the aluminiumrich phases of the binary aluminium-boron system is AlB2. Among the intermetallic phases, AlB2 is one of the most frequently observed materials for a long time. The crystal structure is simple which contains graphite like boron layers separated by aluminium atoms in hexagonal prismatic voids (space group P6/mmm). For the chemical variability and simplicity of the crystal structure, AlB2 is being a very interesting one for the systematic investigation of crystal structure, chemical and physical properties to the researcher. TaB2 is a transitional metal dibroide which belongs to the hexagonal system with AlB2-like structure (P6/mmm) [14]. *
Corresponding author: Email:
[email protected]
94
N. JAHAN AND M. A. ALI
Previous investigations of AlB2 and TaB2, theoretically and experimentally, have been reported in literature [15-20]. Specifically, the structural and elastic properties for AlB2 and TaB2 have been addressed by Shein and Ivanovskii [16]. Zhou Xiao-Lin studied the structural and thermodynamic properties of AlB2 compound [14].Recently, the structural, elastic and electronic properties of TaB2 with AlB2 structure under high pressure have been studied by Zhang et al [18]. Moreover, the structural, mechanical and electronic properties of TaB2 have also been studied by Zhao et al. [19]. Furthermore, Vajeeston et al studied the electronic structure, bonding, and ground-state properties of AlB2-type transition-metal diborides [20]. However, most of them dealt with the structural, elastic and electronic properties of AlB2 and TaB2 but the optical properties which are very important to understand the electronic properties in better way were not investigated yet. In this paper, we have tried to explain the calculated results of structural, elastic, electronic, optical and thermodynamic properties of AlB2 and TaB2 and then compared our results with previous results where available. 2. METHODOLOGY The first-principles calculations were performed by employing pseudo-potential plane-waves (PPPW) approach based on the density functional theory (DFT) [21, 22] and implemented in the CASTEP code [23]. The major advantages of this approach are: the ease of computing forces and stresses; good convergence control with respect to all employed computational parameters; favorable scaling with number of atoms in the system and the ability to make cheaper calculations by neglecting core electrons. The exchange-correlation potential is treated within the GGA due to Perdew, Burke and Ernzerhoff (GGA-PBE) [24]. The presence of tightly-bound core electrons was represented by non local ultra-soft pseudopotentials of the Vanderbilt-type [25]. The states, Al 3s2, 3p1, Ta 6s2, 5d3 and B 2s2 2p1 were treated as valence states. The two parameters that affect the accuracy of calculations are the kinetic energy cut-off which determines the number of plane waves in the expansion and the number of special k-points used for the Brillouin zone (BZ) integration. We performed convergence with respect to BZ sampling and the size of the basis set. Converged results were achieved with 15 ×15×15 and 10×10×9 special k-points mesh [26] for AlB2 and TaB2, respectively. The size of the basis set is given by cut-off energy equal to 550 eV for both cases. The structural parameters were determined using the BFGS [27] minimization technique. 3. RESULTS AND DISCUSSION 3.1 Structural and elastic properties: AlB2 and TaB2 are belonging to the hexagonal crystal system. The space group is P6/mmm (191). The equilibrium structure of the AlB2 and TaB2 are obtained by minimizing its unit cell with respect to the total energy. The position of atoms in the unit cell are: Al/Ta atom is at (0, 0, 0) and the 2B atoms are at (1/3, 2/3, 1/2) and (2/3, 1/3, 1/2). Each boron atom here is equidistance from three other boron atoms. The optimized lattice parameters are shown in Table 1. Our results are in good agreement with the theoretical and experimental results [16, 28]. The calculated independent elastic constants are also included in Table 1. For hexagonal crystals, the mechanical stability requires the elastic constants satisfying the well-known Born stability criteria [29]: C11>0; C11C12>0; C44>0, (C11 + C12) C33 - 2C213>0. From our calculated Cij shown in Table 1, it is known that the hexagonal AlB2 and TaB2 are mechanically stable.
A THEORETICAL STUDY OF ELASTIC
95
The calculated elastic parameters (bulk modulus B, compressibility K, shear modulus G, Young’s modulus E, and Poisson’s ratio ν) of AlB2 and TaB2 are also given in Table 1. The expression for Y and ν can be found else-where [30]. The arithmetic average of the Voigt (BV, GV) and the Reuss (BR, GR) bounds is used to estimate the polycrystalline modulus. In the terms of the Voigt–Reuss– Hill approximations [31]: BH ≡ B = ½(BR+BV) and GH ≡ G = 1/2(GR+GV), where B and G represent the bulk modulus and shear modulus respectively. In addition, Zener’s anisotropy index A = 2C44/(C11 - C12) [32] and the so called Pugh ratio B/G [33] are also calculated. Taking an overall look at the phases featured in Table 1. The bulk modulus (B) of a substance measures the substance's resistance to uniform compression. From table 1 we see that TaB2 has a greater bulk modulus than AlB2 which indicates that more pressure is required to change in volume for TaB2 than AlB2. The inverse of bulk modulus is the compressibility, which are also given in Table 1. We can see from table that B > G for both cases, therefore the limiting parameter for stability of these compounds is the shear modulus G. Table 1: The optimized structural parameters, independent elastic constants Cij, bulk modulus B, compressibility K, shear modulus G, Young’s modulus Y, Poisson ratio ν, Zenger’s anisotropy index A, and Pugh ratio B/G of AlB2 and TaB2 Parameters a (Å) c (Å) C11 (GPa) C12(Å) (GPa) C13 (GPa) C33 (GPa) C44 (GPa) B (GPa) -1 K (GPa (Å) ) G (GPa) Y (GPa) ν A B/G (Å) a
AlB2 3.006, 3.005a, 3.254, 3.257a, b 524,2.962 530b, 665c b 107,3.206 82b, 41c 24, 67b, 17c 333, 272b, 417c (Å)b, 58c 23, 32 180, 196b 0.00575 (Å) 132, 132b 231, 250b 0.20, 0.27b (Å) 0.11,0.51b 1.36, 1.49b (Å)
TaB2 3.137, 3.088a, 3.344, 3.241a, b 596, 3.074 708b, 712d b 141,3.209 129b, 130d 196, 218b, 217d 431, 517b, 525d 191, 236b,238d 297, 340b, 341d 0.00338 191, 243b, 241d 485, 600b, 586d 0.23, 0.23b, 0.21d 0.83, 0.73b 1.55, 1.36b , 1.41d
ref. 28, bref. 16, cref. 17, dref. 18
(Å) The Young’s modulus Y measures the response to a uniaxial stress averaged over all directions and is used often to denote a measure of stiffness, i.e. the larger is the value of Y, the stiffer is the (Å) The large values of Y for both cases indicate that they will be stiff [34]. An additional material. argument for the variation in the brittle/ductile behavior of the examined phases follows from the calculated Poisson’s ratio ν, Table 1. Indeed, for brittle materials these values are small enough (ν ~ 0.1), whereas for ductile metallic materials ν is typically 0.33. We can see that the examined compound lies in between the brittle/ductile border line. Let us consider elastic anisotropy parameter. For this purpose we have estimated Zener’s anisotropy index A. For isotropic case A = 1, while the deviations from unity measure the degree of elastic anisotropy. Our results show that
96
N. JAHAN AND M. A. ALI
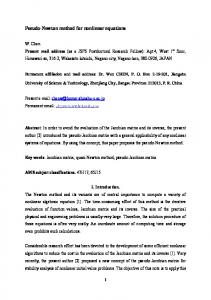
the compound under consideration is highly anisotropic. One of the most widely used malleability indicators of materials is the Pugh's ductility index (B/G ratio) . As is known, if B/G < 1.75 the material will behave in a brittle manner and if B/G > 1.75, the material demonstrates ductileness. The compounds under considerstion will behave in a brittle manner. 3.2 Electronic properties: The calculated energy band structure for TaB2 and AlB2, at equilibrium lattice parameters, along the high symmetry directions in the Brillouin zone are shown in Fig. 1(a) and (b). The Fermi level is chosen to be zero of the energy scale. The valence and conduction bands overlap considerably and there is no band gap at the Fermi level. As a result TaB2 and AlB2 will exhibit metallic properties. 30
30
Energy, E (eV)
20 10 EF
0
Energy, E (eV)
a
b
20 10 0
EF
-10
-10
-20
-20
A
H
K
M
L
H
A
k-points
H
K
M
L
H
k-points
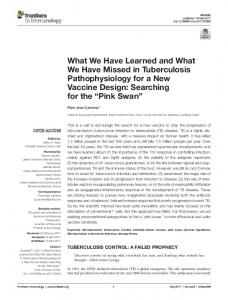
Fig-1: Band structure of (a) TaB2 and (b) AlB2. Moreover, in order to elucidate the different contributions from the different components in the materials to the conductivity we also calculate total and partial density of states as shown in Fig.2 (a) and (b). The DOS values of AlB2 and TaB2 are 0.43 and 0.5 at the Fermi level which are in good agreement with Vajeeston et al [20] and Zhang et al [18], respectively. For AlB2, in Fig. 2(b) we see that the contribution from Al 3s, Al 3p and B 2p are almost equal to the Fermi level i.e. to the conduction properties. On the other hand for TaB2, in Fig. 2(a), we observe that Ta 5d electrons are mainly contributing to the DOS at the Fermi level, and should be involved in the conduction properties. The contribution from B 2p states is noticeable but an order of magnitude smaller than that of Ta 5d states. For both cases B 2s do not contribute at the Fermi level and therefore is not involved in the conduction properties. The energy states below the Fermi level are due to the hybridizing of Al 3s, Al 2p, B 2s and B 2p states for AlB2 and Ta 6s, Ta 5d, B2s and B 2p states for TaB2 with a dominant contribution from B 2p states. 3.3 Optical Properties The optical properties of AlB2 and TaB2 may be obtained from the complex dielectric function, 1 i 2 . The imaginary part 2 is obtained from the momentum matrix elements between the occupied and the unoccupied electronic states and calculated directly by CASTEP [35] using the following equation:
A THEORETICAL STUDY OF ELASTIC
ε 2 ω
97
2 2e 2 π ψ kc uˆ.r ψ kv δ E kc E kv E Ωε0 k,v,c
where uˆ is the vector defining the polarization of the incident electric field. ω is the light frequency, e is the electronic charge and ψ k and ψ k are the conduction and valence band wave c
v
functions at k, respectively.The real part is derived from the imaginary part 2 by the Kramers–Kronig transform. All other optical constants such as refractive index, absorption spectrum, loss-function, reflectivity and conductivity are those given by Eqs. 49–54 in Ref. [35]. 2.5
2.0 EF
Total
a
EF
Total
2.0
b
1.5
1.5
1.0 1.0
0.5
0.5 0.0
0.0 Ta 6s Ta 5d
1.2
DOS (electrons/eV)
DOS (electrons/eV)
Partial
0.8 0.4 0.0
Partial
0.6
Al 3s Al 3p 0.4
0.2
0.0 Partial
1.2
B 2s B 2p
0.8
B 2s B 2p
Partial
0.6
0.8
0.4 0.4
0.2 0.0 -20
-10
0
10
Energy, E (eV)
20
30
0.0 -20
-10
0
10
20
30
Energy, E (eV)
Fig-2: Total and Partial Density of States of (a) TaB2 and (b) AlB2. The optical properties of solids provide an important tool for studying electronic properties of materials. Fig. 3 and 4 (a)–(f) shows the calculated optical properties of TaB2 and AlB2 from the polarization vector (1 0 0) for photon energies up to 40 eV. In our calculation, we used a Gaussian smearing which is 0.5 eV. This smears out the fermi level, so that more k-points will be effectively on the fermi surface. The complex dielectric function is intimately connected to band structure for solid. The primary quantity which is the probability of photon absorption for any crystalline material is directly related to the imaginary part of the optical dielectric function ε (ω).
98
N. JAHAN AND M. A. ALI
Dielectric function
300
1 2
a
200
Dielectric function
The imaginary part ε2 (ω) of the dielectric function has the peaks at 2.9 and 6.3 eV for AlB2 [Fig. 4 (a)] are due to transitions of electrons from B 2p VB to Al 3p CB but there is only one peak at 0.46 eV for TaB2 due to transitions of electrons from B 2p VB to Ta 5d CB
100 0
Refractive Index
Refractive Index
20
b
15 10 5
Conductivity
Conductivity
0 c
12 8 4
Absorption x105
d
4 3 2 1
0
b
4
2
0 12
c
8 4
d 3 2 1 0
0
e
e
0.8
Reflectivity
Absorption x 105
10
0
0
Reflectivity
a
-10
-100
0.6 0.4
0.6 0.4 0.2
0.2 0.0 Loss function
0.0
Loss Function
20
f
6 4 2
f
5 4 3 2 1 0
0 0
10
20
30
40
Photon Energy, E (eV)
Fig-3: Optical properties of TaB2.
0
10
20
30
40
Photon Energy, E (eV)
Fig-4: Optical properties of AlB2.
A THEORETICAL STUDY OF ELASTIC
99
The refractive indexes of the compounds under consideration are displayed in Figs. 3 and 4 (b). The static values are of 19.7 and 3.7 for TaB2 and AlB2, respectively. In case of AlB2, there are two peaks at 1.3 and 5.5 eV. On the other hand for TaB2, there is an only one peak at ~4.12 eV. Photoconductivity is the increase in electrical conductivity that results from the increase in the number of free carriers due to the absorption of photons of sufficient frequency. We can see from the Figs. 3 and 4 (c), the photoconductivity starts with a non-zero value corresponds to the incident photon energy (for AlB2, at 0.01 eV this has a very small value ~ 0.731, so it is hardly seen) which shows that the compounds have no band gap. Two main peaks are observed at 0.76 and 9.6 eV for TaB2 and at 3.1 and 6.4 eV for AlB2. Figs. 3 and 4 (d) show non-zero absorption coefficient due to the metallic nature of TaB2 and AlB2. The corresponding peaks of conductivity are also seen in absorption spectra. For TaB2, this spectrum also rises below 11 eV with two peaks at 1.3 and 10.6 eV and then decreased rapidly to 0 at 34 eV. For AlB2, this spectrum rises sharply below 7 eV with two peaks at 3.3 and 6.4 eV and then decreased rapidly to 0 at ~35 eV. There are also two small peaks at 13.3 and 17.6 eV energy. Figs. 3 and 4 (e) illustrates the dependence of reflectivity on frequency, exhibiting the dramatic discontinuous drop in R at p, which has come to be known as the plasma reflection edge. For AlB2 [Fig. 4 (e)] we found that it can reflects only 37% of incident light at low frequency but it can less likely be a good reflector in the range of 10-20 eV photon energy. On the other hand TaB2 can reflects almost 80% of incident light in low energy region that indicates its applicability as a candidate material for use to remove solar heating. The function L (ω) shown in Figs. 3 and 4 (f), describes the energy loss of a fast electron traversing in the material. Its peak is defined as the bulk plasma frequency ωρ, which occurs at ε2 1 and ε1 = 0 [36, 37]. Moreover, the positions of peaks in L(ω) spectra, which correspond to the so-called plasma frequency, point out the transition from the metallic property [ε1(ω) < 0] to the dielectric property [ε1(ω) > 0] for a material. In the energy-loss spectrum, we see that the plasma frequency ωρ of TaB2 is 26 eV and for AlB2 it is equal to ~21.2 eV. When the incident light’s frequency is higher than that of plasma frequency, the material becomes transparent. In addition, the peaks of L(ω) correspond to the trailing edges in the reflection spectra as shown in Fig. 3 and 4 (e and f). 350
1400
(a)
P = 0 GPa
AlB2 TaB2
1200
AlB2 TaB2
1600
1000
150
(K) D
200
B (GPa)
600
100
T = 300 K
400
800
800 400
Pressure, P (GPa)
0
600
200
50
TT==500 K 300K
1200
(K) D
250
B (GPa)
(b)
P = 0 GPa
300
0
10
20
30
40
800
1000
50
400
Pressure P (GPa) 0 0
0 0
200
10
400
20
600
30
40
800
Temperature, T (K)
50
1000
200
1200
0
200
400
600
1200
Temperature, T (K)
Fig-5: Temperature dependence of (a) Bulk modulus and (b) Debye temperature of TaB2 and AlB2. Inset shows pressure variation.
100
N. JAHAN AND M. A. ALI
3.4 Thermodynamical properties We investigate the thermodynamics properties of TaB2 and AlB2 by using the quasi-harmonic Debye model in a manner as described elsewhere [38, 39]. Here we computed the bulk modulus, Debye temperature, specific heats and volume thermal expansion coefficient at different temperatures and pressures. For this we utilized E-V data obtained from the third order BirchMurnaghan equation of state [40] using zero temperature and zero pressure equilibrium values of E0, V0, B0, based on DFT method. Fig.5 (a) represents the temperature variation of isothermal bulk modulus of TaB2 and AlB2, the inset of which shows bulk modulus B data as a function of pressure. Our results reveal that all B values are nearly flat below 100K. Above 100K, B for AlB2 decreases at a slightly faster rate than the other compound. The inset shows the pressure variation of bulk modulus at 300 K. Further the bulk modulus, signifying the average strength of the coupling between the neighboring atoms, increases with pressure at a given temperature and decreases with temperature at a given pressure, which is consistent with the trend of volume. Fig.5(b) represent the temperature variation of Debye temperature ΘD at zero pressure of TaB2 and AlB2, the inset of which shows the Debye temperature at 300K as a function of pressure.We observe that ΘD decreases non-linearly with increasing temperature for both compound. On the other hand the pressure dependent Debye temperature exhibits a non-linear increase. We know that ΘD is related to the maximum thermal vibration frequency of a solid. The variation of ΘD with pressure and temperature assures that the thermal vibration frequency of atoms changes with pressure and temperature. 80
100 P = 0GPa
60 40
Cp (Jmol-1K-1)
-1 -1 Cv (Jmol K )
PP==0GPa 0GPa
AlB2 TaB2
20
80 60 AlB2 TaB2
40 20 (b)
(a) 0
0 0
200
400
600
800
1000
1200
0
300
600
900
1200
Temperature, T(K)
Temperature, T(K)
Fig-6: Temperature dependence of (a) specific heat at constant volume, and (b) specific heat at constant pressure of TaB2 and AlB2. Fig.6 shows the temperature dependence of constant-volume and constant-pressure specific heat capacities CV, CP of TaB2 and AlB2. The heat capacities increase with increasing temperature, because phonon thermal softening occurs when the temperature increases. The difference between Cp and Cv for TaB2 and AlB2 is given by CP – CV = αv2 (T)BTV, which is due to the thermal expansion caused by anharmonicity effects. In the low temperature limit, the specific heat exhibits the Debye T3 power-law behavior and at high temperature (T>550 K for TaB2 and T>1000 K ) the anharmonic effect on heat capacity is suppressed, and CV approaches the classical asymptotic limit of CV=3nNKB= 74 J/mol.K. This results show that the interactions between ions in the nanolaminates have great effect on heat capacities especially at low temperature.
A THEORETICAL STUDY OF ELASTIC
101
Fig .7 shows the volume thermal expansion coefficient, αv as a function of temperature and pressure (inset). At low temperatures αv increases exponentially with temperature upto 300K for TaB2 and 500K for AlB2, when the pressure is zero and gradually turns to a linear increase at high temperature. On the other hand, at a constant temperature α v decreases with increasing temperature. It is established that the volume thermal expansion co-efficient is inversely related to the bulk modulus of a material 6 P = 0GPa 5 AlB2 TaB2
-5 -1 v(10 K )
4
3 5
v(10-5K-1)
2
1
4
T = 300K
3 2 1
Pressure, P(GPa)
0 0
0 0
300
10
20
600
30
900
40
50
1200
Temperature, T(K)
Fig-7: Temperature dependence of volume thermal expansion coefficients of TaB2 and AlB2. Inset shows pressure variation. 4. CONCLUSIONS The structural, elastic, electronic, optical and thermodynamic properties of AlB2 and TaB2 have been investigated by using density functional theory. Elastic constants calculations reveal that the investigated structures are mechanically stable and they can be considered as stiff, anisotropic as well as brittle materials. Band structure results show that the compounds are metallic in nature. Absorption and conductivity spectrum shows metallic nature also. Furthermore, the dielectric function, energy-loss spectrum, absorption spectrum, conductivity and reflectivity were obtained and discussed in detail. The large reflectivity of TaB2 in the low-energy region indicates suitability of the compound for use in practical purposes to remove solar heating. The temperature and pressure dependence of bulk modulus, specific heats, Debye temperature and thermal expansion coefficient are investigated by the quasi-harmonic Debye model and the results are discussed. The variation of ΘD with temperature and pressure reveals the changeable vibration frequency of the particle in AlB2 and TaB2. The increase of heat capacity with increasing temperature shows that phonon thermal softening occurs when the temperature increases. Finally, our results are compared with the experimental and theoretical data where available. We hope that our calculated results could serve as a reference for future experimental study on the optical properties of the both phases.
102
N. JAHAN AND M. A. ALI
ACKNOWLEDGEMENT The authors would like to express their thanks to Professor A. K. M. Azharul Islam, Department of Physics, Rajshahi University, Rajshahi-6205, Bagnladesh for computational support at his laboratory. REFERENCES
[1] [2] [3] [4] [5] [6] [7] [8] [9] [10] [11] [12] [13] [14]
[15] [16] [17] [18] [19] [20] [21] [22] [23] [24] [25] [26] [27]
T. Lundstorm, and S. Rundqvist, Borides, Silicides and Phosphides (Methuen, London) (1965). B. Post, Refractory Binary Borides, Metallo-Boron Compounds and Boranes (New York, Wiley) (1964) J. Goldshmidt, Interstitial Alloys (London, Butterworths) (1967). G. V. Samsonov, and I. M. Vinickij, Refractory Compounds (Moscow, Metallurgy) (1976) M. I. Matkovich, Boron and Refractory Borides (Berlin, Springer-Verlag) (1977). Yu. B. Kuzma, Crystallo-Chemistry of Borides (Russia: Lvov, Lvov) (1983). T. I. Serebriakova, V. A. Neronov, P. D. and Peshev, High-Temperature Borides (Moscow, Metallurgy) (1991). G. P. Shveikin, and A. L. Ivanovskii, Uspekhi Khimii, 63 pp 751 (1994). C. Mitterer, J. Solid State Chem. 133, pp 279 (1997). A. L. Ivanovskii, and G. P. Shveikin, Quantum Chemistry In Material Science (Russia: Ural Ekaterinburg (1998). N. B. Dahotre, P. Kadolkar, and S. S. Shah, Surf. Interface Analysis 31, pp 659 (2001). B. Basu, G. B. Raju, and A. K. Suri, Inter. Mater. Rev. 51, pp 352(2006). J. Nagamatsu, N. Nakagawa, T. Muranaka, Y. Zenitani and J. Akimitsu, Nature 63, pp 410 (2001). P. Schwarzkopf, R. Kieffer, W. Leszynski and F. Benesovsky, Refractory Hard Metals, Borides, Carbides, Nitrides, and Silicides (New York: The Macmillan Company) pp 291 (1953). Z. X. Lin, L. Ke, C. Xiang-Rong and Z. Jun, Chinese Phys. 15, pp 3014 (2006). I. R. Sheina and A. L. Ivanovskii, J. Phys. Condens. Matter 20, pp 415218 (2008). K. Liu, X. L. Zhou, X. R. Chen, and W. J. Zhu, Phy. B 388, pp 213 (2007). J. D. Zhang, X. L. Cheng and D. H. Li, Comp. Mat. Sci. 50, pp 474 (2010) 474. W. J. Zhao and Y. X. Wang, J. Solid State Chem. 182, pp 2880 (2009). P. Vajeeston, P. Ravindran, C. Ravi1, and R. Asokamani, Phy. Rev. B 63, pp 045115 (2001). P. Hohenberg and W. Kohn: Phys. Rev. B 136, pp 864 (1964). W. Kohn, and L. J. Sham, Phys. Rev. A 140, pp 1133 (1965). M. D. Segall, P. J. D. Lindan, M. J. Probert, C. J. Pickard, P. J. Hasnip, S. J. Clark, and M. C. Payne, J. Phys.: Condens. Matter 14, pp 2717 (2002). J. P. Perdew, S. Burke, and M. Ernzerhof, Phys. Rev. Lett. 77, pp 3865 (1996). D. Vanderbilt, Phys. Rev. B 41, pp 7892 (1990). H. J. Monkhorst, and J. D. Pack, Phys. Rev. B 13, pp 5188 (1976). B. G. Pfrommer, M. Coote, S. G. Louie, and M. L. Cohen, J. Comp. Phys. 131, pp 33 (1997).
A THEORETICAL STUDY OF ELASTIC [28] [29] [30] [31] [32] [33] [34] [35] [36] [37] [38] [39] [40]
103
P. Villars, Pearson’s Handbook: Crystallographic Data for Intermetallic Phases (New York: ASM International) (1997). C. Li, B. Wang, Y. Li and R. Wang, J. Phys. D: Appl. Phys. 42, pp 065407 (2009). M. A. Ali, A. K. M. A. Islam and M. S. Ali, J. Sci. Res. 4, pp 1 (2012). R. Hill: Proc. Soc. London. A 65, pp 349 (1952). C. Zener: Elasticity and Anelasticity of Metals (University of Chicago, Chicago) (1948). S. F. Pugh: Philos. Mag. 45, pp 823 (1954). E. Deligoz, K. Colakoglu and Y.O. Ciftci, J. Mater. Sci. 45, 3720 (2010). http://www.tcm.phy.cam.ac.uk/castep/documentation/WebHelp/CASTEP.html J. Sun, X. F. Zhou, Y. X. Fan, J. Chen and H. T. Wang. Phys. Rev. B 73, pp 45108 (2006). J. S. de Almeida and R. Ahuja Phys. Rev. B 73, pp 165102 (2006). M. A. Blanco, E. Francisco and V. Luana, Comput. Phy. Commun. 158, pp 57 (2004). M. Z. Hasan, M. M. Hossain, M. S. Islam, F. Parvin and A. K. M. A. Islam, Comput.Mater.Sci.63, pp 256 (2012). F. Birch, J. Geophys. Res 83, pp 1257 (1978).