different log lines. For example a log line indicating the event of charging a user's credit account would contain different account numbers and charge amounts ...
Abstracting Execution Logs to Execution Events for Enterprise Applications Zhen Ming Jiang1, Ahmed E. Hassan2, Parminder Flora3 and Gilbert Hamann4 Queen’s University1,2, Research In Motion3,4 1 {zmjiang , ahmed2}@cs.queensu.ca, {pflora3, ghamann4}@rim.com Abstract Monitoring the execution of large enterprise systems is needed to ensure that such complex systems are performing as expected. However, common techniques for monitoring, such as code instrumentation and profiling have significant performance overhead, and require access to the source code and to system experts. In this paper, we propose using execution logs to monitor the execution of applications. Unfortunately, execution logs are not designed for monitoring purposes. Each occurrence of an execution event results in a different log line, since a log line contains dynamic information which varies for each occurrence of the event. We propose an approach which abstracts log lines to a set of execution events. Our approach can handle log lines without having strict requirements on the format of a log line. Through a case study on a large enterprise application, we demonstrate that our approach performs well when abstracting execution logs for large enterprise applications. We compare our approach against the SLCT tool which is commonly used to find line patterns in logs.
1. Introduction Large commercial software systems require runtime monitoring to ensure Quality of Service [20, 22]. Erroneous behavior or long waiting times will result in user dissatisfaction and loss of revenue. Runtime monitoring compares the runtime behavior of an application against a documented or expected behavior. Runtime monitoring techniques, such as source code instrumentation and profiling, require a good understanding of an application to determine the most appropriate subsystems or components to monitor. Such understanding is rarely available in practice. Source code instrumentation [5, 6] is commonly used to insert monitoring points in large software systems. However, code instrumentation requires rebuilding and redeploying the monitored system. This is a time consuming task which causes service disruption. Furthermore, code instrumentation is not feasible when the source code of the application is not available. This is the case for many large enterprise systems, which make use of Commercial-Off-the-Shelf (COTS) components. COTS components are usually purchased from a third party and are shipped without the source code. Code profiling [8, 18, 19] is another common technique for monitoring an application. Code profiling
avoids the need for rebuilding the source code. However, profiling introduces significant slowdowns and is not desirable in a production setting. Software developers mark the execution of high level events in an application by outputting log lines during development. For example, the event of charging a user account may be marked by outputting the following log line: “Charged User Account, account=1000, amount=200”. Such log lines indicate high level information about the progress of execution for an application, in contrast to code instrumentation events which are at a much lower level. These logs lines are helpful during remote issue resolution by customer support representatives. Also recent legal acts, such as the Sarbanes-Oxley Act of 2002, have made the logging of the execution for telecommunication and financial companies a legal requirement [4]. We propose using these commonly available logs to monitor the execution of an application. Monitoring techniques which make use of execution logs are the least invasive (no disruption or degradation of an application) and most applicable (logs are available). However, execution logs are not designed for monitoring. Although each log line is an instantiation of an execution event, each log line contains dynamic information that is specific to the particular occurrence of an event. The dynamic information causes the same execution event to result in different log lines. For example a log line indicating the event of charging a user’s credit account would contain different account numbers and charge amounts for each instantiation of that particular execution event as shown in Table 1. All three log lines correspond to different instantiations of the same execution event. Log Lines 1: Charged User Account, account=1000, amount=200 2: Charged User Account, account=1234, amount=100 3: Charged User Account, account=500, amount=250 Table 1. Sample log lines
Abstracting log lines to execution events is a challenging and time consuming task. A system expert is needed to determine that two logs lines represent the same execution event. Such system experts are rarely available and if they are available they have limited time. Due to the large size of enterprise systems, this process is time consuming. Moreover, the system expert must update the abstractions for each version of the software system.
At first glance it may appear that the process of abstracting log lines to execution events could be solved if the source code of an application is available. Simply searching for “LOG” statements (e.g., “printf” or “System.out”) is not sufficient since in many instances an execution event may be generated dynamically using several output statements in the source code. Table 2 shows one example. Log Lines
Source Code LOG("User Shopping Basket contains: "); for (int i=0; i 0) { Basket LOG(" , ” + itemId); contains: 2, 3, 5 } else { LOG(itemId); } } Table 2. An example of an execution event generated by multiple output statements
In this paper, we introduce a lightweight approach to abstract log lines to execution events. Our approach can handle free-form log lines with limited requirements on the format of the log lines. Experiments on a large enterprise application show that our approach abstracts log lines with high precision and recall. Organization of the Paper This paper is organized as follows. Section 2 overviews related work in the field and places our contributions relative to prior work. Section 3 presents our approach of abstracting log lines to execution events. Section 4 demonstrates the effectiveness of our approach through a case study using log files from a large enterprise software application. Section 5 concludes the paper.
2. Related Work Prior approaches for abstracting log lines to execution events could be grouped under three general approaches: Rule-based, Codebook-based and AI-based approaches. Rule-based approaches [13, 14, 15, 26, 27] use a set of hard coded rules to abstract log lines to execution events. These approaches are commonly used in practice since they are very accurate. However these approaches require a substantial effort for encoding and updating the rules. Codebook-based approaches [7, 24, 28] are similar to the rule-based approach. However codebook approaches process a subset of execution events (“alarms”) instead of all events. The subset of events, which forms the codebook, is used in real-time to match the observed symptoms. AI-based approaches [1, 2, 3, 9, 10, 12, 21] use various types of artificial intelligent techniques such as, Bayesian networks and frequent-itemset mining, to abstract execution logs to events.
Our approach, presented in Section 4, is similar to a rule-based approach. However, our approach requires less system knowledge and effort. Rather than encoding rules to recognize specific execution events, our approach uses a few general heuristics to recognize static and dynamic parts in log lines. Log lines with identical static parts are grouped together to abstract log lines to execution events. Approach Rule-based [13, 14, 15, 26,27] Codebookbased [7, 24, 28] AI-based [1, 2, 3, 9, 10, 12, 21] Our approach
Y
Amount of System Knowledge High
High
N
Y
Medium
High
N
N
Low
Low
N
Y
Low
Low
Y
Transparency
Needed Effort
Coverage
Table 3. Summary of related work
We define several criteria to evaluate a log abstraction approach: 1. Transparency: Can a user easily understand the rationale for abstracting a log line to an execution event? For example, in a neural-network AI approach, the user cannot determine the rationale for abstracting a log line to a particular event. We desire an approach with high transparency so users would trust it. 2. Amount of system knowledge: What is the amount of knowledge needed about the system to use the approach? For example, in a rule approach a domain expert is needed to encode all rules. 3. Amount of required effort: What is the amount of effort required for the approach to work properly? Rule-based approaches and cookbook-based approaches require a large amount of human effort to encode the rules or alarms. These encodings must be updated with every version of a software system. 4. Coverage: Is each log line abstracted to a unique log event? For example, AI-based approaches may not abstract log lines which do not occur above a particular threshold.
3. Our Log Abstraction Approach Log lines are generated by output statements in the source code. Log lines generated by the same set of output statements correspond to the same execution event. Such log lines will be similar to each other. Table 1 shows three log lines generated by the same execution event. The identical (i.e., static) parts in each log line are static information describing the execution event (i.e., the context), whereas the varying parts (i.e., dynamic) are parameter values generated during runtime. Not all log lines contain static and dynamic parts. For example, “All accounts initialized” contains only a static
part. Most of the time, a log line has both dynamic and static parts. Log lines with same static parts and same structure of dynamic parts belong to the same execution events. If we can parameterize each log line, we can abstract log lines to execution events properly. 3.1. Clone Detection Approach Log lines generated by the same execution events should look the same if we can properly parameterize the dynamic contents from each log line. This process is similar to the “Parameterized Token-Matching Algorithms” used in the source code Clone Detection research [11]. To verify the feasibility of using clone detection techniques to abstraction log lines, we used the CCFinder [11] tool which implements the parameterized token matching approach. The tool can detect similarities on multiple programming languages and plain text. Although CCFinder works on large source code bases, it is not able to process large log files. For example, CCFinder performs clone detections on multiple lines and cannot handle large file size. Based on a closer analysis, we feel CCFinder cannot process large log files as good as large source files due to the following reasons: 1. Programming languages or plaintext wrap around lines but have delimiters for each statement (like “;”, “.” or “!”); whereas a log line does not use similar delimiters. Thus, CCFinder cannot find the end of each log line and treats all log lines as one chuck. 2. Source code contains control keywords like if, else, for, while etc. These keywords are the static parts in the source code and are used by CCFinder in the lexical analysis and transformation steps to analyze and mark up the source code. Log lines have a less strict grammar and unlimited vocabulary; CCFinder cannot mark up any specific parts when processing. 3.2. Our Approach Based on lessons learned from running CCFinder on log files, we have derived a new approach to detect similarities among log lines, then parameterize and abstract these lines. Our approach treat end of line characters as the delimiter for each log line. Our approach scales up to process log files which contain thousands or millions of log lines. 1. 2. 3. 4. 5.
Log Lines Start check out Paid for, item=bag, quality=1, amount=100 Paid for, item=book, quality=3, amount=150 Check out, total amount is 250 Check out done
Table 4. Sample log lines
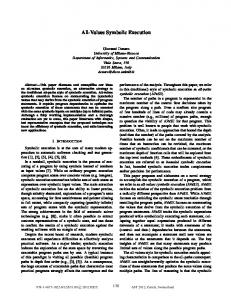
As shown in Figure 3, our approach consists of three steps: Anonymize, Tokenize and Categorize. In the rest of this section, we demonstrate our approach using a small example that is shown in Table 4. The example has 5 log lines.
The Anonymize step The Anonymize step uses heuristics to recognize tokens in log lines which correspond to dynamic parts. Once the tokens are recognized they are replaced with generic tokens ($v). Heuristics can be added or removed from our approach. We use the following two heuristics to recognize dynamic parts in log lines: 1. Assignment pairs like “word=value”; 2. Phrases like “is[are|was|were] value” Table 5 shows the sample log lines after the Anonymize step. In the second and third lines, contents after the equal signs (=) are replaced with the generic term $v. In the fourth line, the phrase “is 250” is replaced with the term “=$v”. There are no changes made to the first and last line. 1. 2. 3. 4. 5.
Log Lines Start check out Paid for, item=$v, quality=$v, amount=$v Paid for, item=$v, quality=$v, amount=$v Check out, total amount=$v Check out done
Table 5. The sample logs after the anonymize step
The Tokenize step The Tokenize step separates the anonymized log lines into different groups (i.e., bins) according to the number of words and parameters in each log line. Separating log lines into different bins narrows down the search space during the Categorize step. The bins enable us to process large log files in a timely fashion by limiting our search space. We estimate the number of parameters in a log line by counting the number of generic terms (i.e., $v). Log lines with the same number of tokens and the same number of parameters are placed in the same bin. Table 6 shows the sample log lines after the Anonymize and Tokenize steps. The left column indicates the name of a bin. Each bin is named with a tuple: number of words and number of parameters that are contained in the log line associated with that bin. The right column in Table 6 shows the log lines. Each row shows the bin and its corresponding log lines. The second and the third log lines contain 8 words and are likely to contain 3 parameters. Thus the second and third log lines are grouped together in the 8_3 bin. Similarly, the first and last log lines are grouped together in the 3_0 bin as they both contain 3 words and are likely to contain no parameters. Bin Name 3_0 5_1 8_3
Log Lines 1. Start check out 5. Check out done 4. Check out, total amount=$v 2. Paid for, item=$v, quality=$v, amount=$v 3. Paid for, item=$v, quality=$v, amount=$v
Table 6. Sample logs after the tokenize step
Figure 3. High level overview of our approach for abstracting execution logs to execution events
The Categorize step The Categorize step compares log lines in each bin and abstracts them to the corresponding execution events. The inferred execution events are stored in an execution event database for future references. Our algorithm goes through the log lines bin by bin. After this step, each log line should be abstracted to an execution event. Table 7 tabulates the results of our working example after the Categorize step. Our algorithm starts with the 3_0 bin. Initially, there are no execution events which correspond to this bin yet. Therefore the execution event corresponding to the first log line becomes the first execution event namely 3_0_1 (the first execution event corresponds to the bin which has 3 words and no parameters). Then the algorithm moves to the next log line in the 3_0 bin which contains the fifth log line. The algorithm compares the fifth log line with all the existing execution events corresponds to the 3_0 bin. Currently, there is only one execution event: 3_0_1. As the fifth log line is not similar to the 3_0_1 execution event, we create a new execution event 3_0_2 for the fifth log line. With all the log lines in the 3_0 bin processed, we can move on to the 5_1 bin. As there are no execution events which correspond to the 5_1 bin initially, the fourth log line gets assigned to a new execution event 5_1_1. Similar log applies when we process the log lines from the 8_3 bin are processed with the same algorithm. Execution event 3_0_1 3_0_2 5_1_1 8_3_1 8_3_1
Log Lines 1. Start check out 5. Check out done 4. Check out, total amount=$v 2. Paid for, item=$v, quality= $v, amount=$v 3. Paid for, item=$v, quality=$v, amount=$v
Table 7. Sample logs after the categorize step
4. Case Study We conducted a case study to evaluate the effectiveness of our approach. We ran an implementation of our approach against logs for a large enterprise software system. Since we have limited knowledge of the software system, we could not use rule-based or codebook-based approaches. We can only use an AI-based approach. There are two AI tools which we could compare our approach against. The tools are: teirify [16] and SLCT (Simple Logfile Clustering Tool) [12]. The teirify tool uses a bio-informatics algorithm [17] to detect line patterns, whereas the SLCT tool makes use of frequent-
itemset mining to cluster similar log lines. Unfortunately, teirify requires a large amount of memory and cannot handle large log files (exceeding 10,000 log lines). Thus, we compared the performance of our log line parameterization approach against the result obtained from SLCT, which was able to scale to handle large files. We briefly describe the SLCT approach, explain the setup of our case study, report the results of our study, and discuss lessons learned from our study. In this paper, we use average precision and average recall [25] to measure the performance of different approaches. An approach with high recall classifies most of the log lines. An approach with high precision implies there are few log lines which are mis-classified. 4.1. SLCT Abstracting log lines to execution events can be considered as the process of discovering common patterns among log lines. Consequently, we can consider using a data mining algorithm which analyzes large volumes of data to report interesting patterns and relations in the data. SLCT (Simple Logfile Clustering Tool) [12] is an open source tool which uses the Frequent-Itemset Mining technique [23] to detect patterns and spot abnormal events in the streams of logs. SLCT outputs execution events as a regular expression. Table 8 shows one example. SLCT by default attempts to create patterns which do not intersect. If the support count is 3, then only “In Checkout, user is Tom” will be shown. However, if the support count is 4, only the first pattern (In Checkout, user is *) will be reported. Each of these reported line pattern can be considered as an execution event. Log Lines In Checkout user is Tom In Checkout user is Jerry In Checkout user is Tom In Checkout user is Tom
Line Patterns In Checkout, user is * In Checkout, user is Tom
Table 8. An example of multiple line patterns
4.2. Case Study Setup We conducted three experiments on the log files for a large enterprise application. In the first experiment, we study the feasibility of an approach by running it against small-size log files. Small log files are generated by randomly picking 100 log lines from a larger log file. We ran each approach (our approach and the SLCT approach) on 100 different randomly generated small-size log files.
Since the files are small in size, we can manually verify the correctness of each approach and gain a better understanding of the limitations and strengths of each approach. We also use the experiment to fine tune the input parameters. In the second experiment, we examine the stability of an approach by running it against a medium-size log files. Each medium-size log files consists of 10,000 log lines randomly picked from a larger log file. We ran each approach on 100 different log files. We use the experiments to measure the average, minimum and maximum performance of an approach. In the third experiment, we test the scalability of an approach by running it against a large log file, with around three quarter of a million (723,608) log lines. The studied application was internationalized and part of the internationalization efforts involved the manual abstracting log lines to execution events. The execution events are stored in a separate file which is translated to different languages. We use this file as the gold standard in our performance evaluation of each approach. We now present the results of the three experiments using the two approaches. 4.3. Results In this section, we present the performance results of SLCT and our log abstraction approach. SLCT For our experiments, we used the support count of 10, 100, and 100 for the small, medium and large log files, respectively. Unfortunately, as the log files gets bigger SLCT suffers from an ambiguity problem, as it shows general patterns like lines begins with “Start”. To avoid ambiguity, we remove the general patterns before abstracting log lines to patterns (i.e., events). Table 9 tabulates the precision and recall values for SLCT. SLCT can handle log files with various sizes with stable performance. However, the performance is not satisfying. The low precision and recall is due to the following two reasons. First, SLCT won’t abstract every log line to an execution event since the log line must occur often enough for a frequent pattern to emerge. Second, SLCT reports many sub-patterns. Table 8 shows one example. The pattern “In Checkout, user is Tom” is a sub-pattern of “In Checkout, user is *”. In our case study, if log lines have more than one line patterns reported, we just match these log lines with the line patterns which have the highest support count. Experiments
Precision
Recall
Our Log Abstraction Approach For our approach, we first examine the logs and we add an additional rule to anonymize email addresses in log lines. For the Categorize step, we assign log lines to a particular execution event when the log line and the event have the same number of tokens after the anonymize step. Table 10 shows the results of the three experiments for our approach. As we can see, our approach can handle different size log files with high precision and recall. Experiments
Precision
Recall
Small
95.9% ± 3.1%
99.9% ± 0.31%
Medium
90.0% ± 2.5%
97.8% ± 0.44%
Large
90.0%
98.4%
Table 10. The performance for our approach
We manually investigated the remaining 5-10% of the log lines which our approach could not correctly abstract to their corresponding execution events. Our investigation revealed that these log lines followed a peculiar pattern for their dynamic information which our approach did not account for. For example, our approach will incorrectly abstract the log lines shown in Table 11 to different execution events. We then updated the heuristics in the Anonymize step to account for such a pattern by adding the line pattern (“Start processing for user $v”). Log Lines 1: Start processing for user Jen 2: Start processing for user Tom Lee 3: Start processing for user Henry Table 11. An example of log lines which our approach fails
4.4. Limitations and Discussion Our approach considerably outperforms SLCT since our approach does not suffer from the problem of limited frequencies and subpattern merging. However, our case study was performed on a single application so we must explore the performance of our approach on applications from various domains. In addition, our approach requires some human involvement. Our approach requires users to go through some log lines to compose the anonymization rules. Our approach also requires users to quickly go through the abstracted execution events making sure there are all log lines which have been abstracted. The example shown in Table 11 can be easily spotted by skimming through the abstracted events. It can be resolved by adding in one rule for replacing the words after “for user”.
Small
3.9% ± 0.45%
11.4% ± 4.8%
5. Conclusion
Medium
2.6% ± 0.14%
12.3% ± 1.8%
Large
2.4%
18.4%
Complex enterprise applications must be monitored to ensure that they are functioning properly. However, many enterprise applications were not built with monitoring in mind. Monitoring must be added to these applications. Traditional techniques to add monitoring to an application
Table 9. The performance for SLCT
require access to the source code, and may result in unacceptable performance degradations. Moreover all techniques require extensive knowledge of the application. Such knowledge rarely exists in practice. We propose monitoring application by means of the execution logs which are used by support staff and developers to understand the execution of an application. To use such logs, we must abstract each log line to its corresponding execution event. We call this process the log abstraction problem. In this paper, we developed an approach that addresses many of the shortcomings and limitations of other approaches. We conducted a case study using logs from a large enterprise application. Our case study shows that our approach abstracts events with high precision and recall.
Acknowledgement We are grateful to Research In Motion (RIM) for providing access to the execution logs of the large telecom applications used in this study. The findings and opinions expressed in this paper are those of the authors and do not necessarily represent or reflect those of RIM and/or its subsidiaries and affiliates. Moreover, our results do not in any way reflect the quality of RIM's software products.
References [1] Huard, J., and Lazar, A. Fault isolation based on decisiontheoretic troubleshooting. Technical Report 442-96-08. Columbia University, New York, NY. 1996. [2] J. Huard, Probabilistic reasoning for fault management on XUNET. Technical Report, AT&T Bell Labs. 1994. [3] D.W. Guerer, I. Khan, R. Ogler, R. Keffer. An Artificial Intelligence Approach to Network Fault Management. SRI International, 1996. [4] Summary of Sarbanes-Oxley Act of 2002. http://cpcaf.aicpa.org/Resources/Sarbanes+Oxley/Summary+of+ the+Provisions+of+the+Sarbanes-Oxley+Act+of+2002.htm [5] D.F. Jerding, J.T. Stasko, and T. Ball. Visualizing Interactions in Program Executions. In Proc. Int’l Conf. Software Eng. (ICSE), pp. 360-370, 1997. [6] L.C. Briand, Y. Labiche, and Y. Miao. Towards the Reverse Engineering of UML Sequence Diagrams. Proc. IEEE Working Conference Reverse Eng., pp. 57-66, 2003. [7] Yemini, S. A., Sliger, S., Eyal, M., Yemini, Y. and Ohsie, D. High Speed and Robust Event Correlation. IEEE Communications Magazine, 1996, 82--90. [8] The Eclipse Test and Performance Tools Platform. http://eclipse.org/tptp. [9] Lin, A.: A hybrid approach to fault diagnosis in network and system management. In Proceedings of the ACM SIGCOMM Conference. 2002. [10] Hermann Wietgrefe, Klaus-Dieter Tuchs, Klaus Jobmann, Guido Carls, Peter Froehlich, Wolfgang Nejdl, Sebastian Steinfeld. Using Neural Networks for Alarm Correlation in Cellular Phone Networks. International Workshop on Applications of Neural Networks in Telecommunications.1997.
[11] Toshihiro Kamiya, Shinji Kusumoto and Katsuro Inoue. CCFinder: A Multi-Linguistic Token-based Code cloning Detection System for Large Scale Source Code. IEEE Transactions on Software Engineering. July, 2002. [12] Risto Vaarandi. A Data Clustering Algorithm for Mining Patterns From Event Logs. Proceedings of the 2003 IEEE Workshop on IP Operations and Management. 2003. [13] Risto Vaarandi. Simple Event Correlator for real-time security log monitoring. Hakin9 Magazine 1/2006 (6) 2006. [14] Hansen, S. E. and Atkins, E. T. 1993. Automated System Monitoring and Notification With Swatch. In Proceedings of the 7th USENIX Conference on System Administration. System Administration Conference. Berkeley, CA. November, 1993. [15] Wolfgang Ley and Uwe http://www.cert.dfn.de/eng/logsurf/.
Ellerman.
1996.
[16] Stearley, J. 2004. Towards informatic analysis of syslogs. In Proceedings of the 2004 IEEE international Conference on Cluster Computing. Washington, DC. September, 2004 [17] Teiresias. http://cbcsrv.watson.ibm.com/Tspd.html [18] Java Virtual Machine Profiler Interface (JVMPI). http://java.sun.com/j2se/1.4.2/docs/guide/jvmpi/jvmpi.html [19] Salah, M. and Mancoridis, S. Toward an environment for comprehending distributed systems. In Proceedings of the 10th Working Conference on Reverse Engineering. Nov., 2003. [20] Steinle, M., Aberer, K., Girdzijauskas, S., and Lovis, C. Mapping moving landscapes by mining mountains of logs: novel techniques for dependency model generation. In Proceedings of the 32nd international Conference on Very Large Data Bases. Seoul, Korea. September, 2006. [21] Sheppard, J. W. and Simpson, W. R. Improving the accuracy of diagnostics provided by fault dictionaries. In Proceedings of the 14th IEEE VLSI Test Symposium. 1996. [22] Oliner, A. and Stearley, J. What Supercomputers Say: A Study of Five System Logs. In Proceedings of the 37th Annual IEEE/IFIP international Conference on Dependable Systems and Networks. Washington, DC. June, 2007. [23] Pang-Ning Tan, Michael Steinbach, and Vipin Kumar Introduction to Data Mining. Addison-Wesley (2005). [24] Gupta, M. and Subramanian, M. Preprocessor algorithm for network management codebook. In Proceedings of the 1st Conference on Workshop on intrusion Detection and Network Monitoring. Berkeley, CA. 1999. [25] Hassan, A. E. and Holt, R. C. Replaying development history to assess the effectiveness of change propagation tools. Empirical Softw. Engg. Sep. 2006.. [26] R. Vaarandi. SEC - a lightweight event correlation tool. In Proc. of IEEE Workshop on IP Operations & Management (IPOM2002), 2002. [27] Carlos Viegas Damásio, Peter Fröhlich, Wolfgang Nejdl, Luís Moniz Pereira, and Michael Schroeder. Using Extended Logic Programming for Alarm-Correlation in Cellular Phone Networks. Appl. Intell. 17(2): 187-202 (2002). [28] Klinger, S., Yemini, S., Yemini, Y., Ohsie, D., and Stolfo, S. 1995. A coding approach to event correlation. In Proceedings of the Fourth international Symposium on integrated Network Management IV. London, UK.


![[Read]PDF Antitrust Enterprise: Principle and Execution ... - Google Sites](https://m.moam.info/img/260x300/readpdf-antitrust-enterprise-principle-and-executi_64784db9097c474c228cfc4d.jpg)