Acceptance of Waiting Times in High Performance Computing Stephan Schlagkamp1 and Johanna Renker2 1
Robotics Research Institute, TU Dortmund University, Germany,
[email protected] 2 Leibniz Research Centre for Working Environment and Human Factors, Germany,
[email protected]
Abstract. In high performance computing, users submit computing jobs to a parallel computing infrastructure. Ressources for jobs must be allocated according to the job’s requirements. At times of high workload, waiting times are unavoidable. Hence, we investigate user acceptance of waiting times in high performance computing. We analyze data provided by Questionnaire for User Habits of Compute Clusters (QUHCC) among high performance computing users (n = 24). On the one hand, the results indicate that increasing processing times of jobs lead to greater acceptance of waiting times. On the other hand, the percental difference between processing times and waiting times decreases for increasing job lengths. We suggest that scheduling strategies should respect our findings. Keywords: user satisfaction, service levels, high performance computing, waiting times
1
Introduction
In high performance computing (HPC), different users submit jobs to a parallel computing infrastructure. A job j is characterized by many different properties. This work considers its length rj (the running time on the HPC environment) and its waiting time wj . Waiting time incurs in a situation of high workload, when users submit more work than the system can process at a time. In such situation, the HPC system needs strategies to decide which job among all submitted jobs will be processed next. Literature discusses different optimization goals for HPC environments, e.g., cost optimality according to energy consumption [1]. Since human users submit jobs to a certain HPC environment, we consider their satisfaction with waiting times in detail. Therefore, we focus on user satisfaction in high performance computing according to waiting times. Two different questions occur: what is a good criterion to optimize user satisfaction according to waiting times and how does this criterion influence user satisfaction. Hence, we want to find an acceptable way to schedule jobs in situations of high workload. The structure of this work is as follows. The methodology of this study is in Sect. 2. Furthermore, Sect. 3 presents results a conducted survey, where we also
argue for slowdown as an approriate metric. In Sect. 4, we discuss the correlation between user satisfaction and slowdown. This work ends with a brief conclusion in Sect. 5.
2
Methodology
In this study, we analyze the answers provided by 24 participants, who answered QUHCC [2]. Beside other methods, Pruyn and Smith use such methodology in their research on customer’s reaction to waiting times as well [3]. We perform statistical analyses in form of boxplots and empirical cumulative distribution functions (CDF) to argue for an increasing acceptance of waiting times according to job lengths. We show that acceptences of waiting times in HPC environments are exponantially distributed. Therefore, we analyze the slowdown of jobs and rate the quality of different slowdown values.
3
Acceptence of Waiting Times
Questionnaire QUHCC contains six questions asking participants for their acceptance of waiting times for jobs of different lengths (cf. scale Acceptance of Waiting Times (AWT)). We analyze the answers given in a survey among different HPC users and call them observations. Definition 1 (Observation). An observation o = (pj , wj ) represents the accepted waiting time wj for a job length pj . It is based on an answer provided by a participant. We cluster the observations according to the different questions into six sets and sort them according to the assumed job lengths: – – – – – –
Int: interactive jobs 10m: ten minutes Sho: short jobs (up to four hours) 180m: 180 minutes. Med: medium (one to three days) Lar: large (longer than three days)
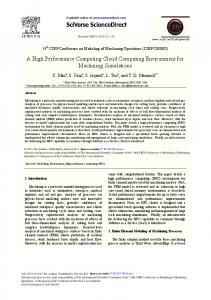
For sets Sho and Med, we chose the average job length of 120 minutes and two days, which is equal to 2,880 minutes, minutes as reference. Figure 1 visualizes all observations as boxplots, Table 1 presents means and medians. The figure reveals an increasing acceptance of waiting times for increasing job lengths. The medians increase from 12.5 minutes to 10,080 minutes, and the means increase monotonically from 61.2 minutes to 9,516.5 minutes. Based on this observation, we conclude that growing job lengths cause a greater acceptance of delayed results, which we can exploit in terms of user satisfying scheduling in HPC. We continue the analysis by introducing slowdown, e.g., [4]. Slowdown describes the relative factor between an optimal response time with zero waiting time and the actual response time as the sum of processing and waiting time.
Acceptable Waiting Times
#10 4
acceptable waiting time
2
1.5
1
0.5
0 INT
10M
SMA
180M
MED
LAR
job category
Fig. 1. Acceptable waiting times for six different sets. Table 1. Mean and median values of acceptable waiting times for six different sets.
median mean
Int
10m
Sho
180m
Med
Lar
12.5 61.2
30.0 171.9
360.0 636.7
360.0 553.8
4320.0 3,863.5
10,080.0 9,516.5
Definition 2 (Slowdown). The slowdown of job j with processing time pj > 0 p +w and waiting time wj ≥ 0 is SD(j) = j pj j . Therefore, slowdown allows rating the quality of a schedule independent of specific jobs’ lengths and waiting times. Figure 2 depicts the slowdowns for observation sets 10m, Sho, 180m, and Lar as boxplots. Table 2 presents means and medians of slowdowns of each set. We do not consider Int and Lar because of the unspecified exact job lengths disallowing calculation of slowdown. While the acceptance of waiting times increases for larger jobs, the according slowdown decreases. Due to the comparability of observation sets using slowdown, we use this metric to rate the quality of service in the next section.
Acceptable Slowdowns 40
accaptable slowdown
35 30 25 20 15 10 5 0 10M
SMA
180M
MED
job length
Fig. 2. Acceptable slowdowns for categories 10m, Sma, Med, and 180m.
Table 2. Mean and median values of observations in 10m, Sma, Med, and 180m.
mean median
4
10m
Sma
180m
Med
18.1938 4.0000
6.3062 4.0000
4.0764 3.0000
2.3415 2.5000
Quality of Service Regarding Slowdown
By means of acceptability of slowdown A(s, O), we calculate the percentage share of observations applying to that slowdown. Definition 3 (Acceptability of Slowdown). Given a set of observations O = {(pj , wj )}, the acceptability of slowdown s is the amount of observations meeting the slowdown, i.e., A(s, O) =
|{SD(o) ≤ s | o ∈ O}| . |O|
(1)
Fig. 3 depicts the acceptability of slowdowns for all observations as an empirical CDF, as well as an exponential CDF fit, according to an exponential probability density function 1 −1 f (x|µ) = e µ . (2) µ To find a suitable fit, we shift the slowdowns by minus one. This calculation is necessary because a minimal value of slowdown is one, while it is zero for a distribution function. Applying least squares, we obtain a parameter of µ = 3.85. We then shift the exponential CDF by one again (cf. Fig. 3). Note that slowdowns greater than 20 are adjusted to 20, since these observations strongly influence the fitting and are not suitable as an optimization objective in practical application. Satisfaction CDF (ALL) 1 0.9
satisfaction level
0.8 0.7 0.6 0.5 0.4 0.3 0.2
CDF exponential CDF µ=3.85, shift +1
0.1 0 0
5
10
15
20
slowdown
Fig. 3. Acceptibility of slowdowns in observations from 10m, Sma, Med, and 180m combined.
Beside that, Table 3 presents the acceptibility of slowdowns for all sets ranging from 1.0 to 4.0. Set All is the union of all sets considered. Based on these plots and analyses, we discuss two different forms of service-levels for HPC environments. Table 3. Satisfaction-Levels in 10m, Sma, Med, and 180m according to different slowdowns. 1.0
1.5
2.0
2.5
3.0
3.5
4.0
All
100%
85.9%
74.4%
65.4%
55.1%
44.9%
35.9%
10m Sma 180m Med
100% 100% 100% 100%
87.5% 95.7% 75.0% 82.6%
75.0% 87.0% 62.5% 69.6%
62.5% 78.3% 62.5% 56.5%
62.5% 78.3% 56.3% 26.1%
62.5% 69.6% 31.3% 17.4%
62.5% 52.2% 25.0% 8.7%
4.1
Single Service Level
To treat all users and jobs equally, we pay special attention to the data of set All. Defining a single service quality, we suggest to allow a slowdown between 1.5 and 2.0. For All, the amount of satisfied users lays between 74.4% and 85.9%, meaning that almost 3/4 of acceptability is met for 2.0 and less than 1/8 of acceptibility are not met for a slowdown of 1.5. Nearly the same holds for the fitted exponantial CDF with acceptance values between 72.2% and 85.0%. Nevertheless, considering set 180m only gains acceptability between 62.5% to 75.0%, which is not in the demanded interval. Therefore, we consider multiple service levels next. 4.2
Multiple Service Levels
Beside a single criterion, a scheduling strategy could also pay respect to different job lengths. As analyzed in Section 3, the accepted slowdown decreases for increasing job lengths. Therefore, we suggest usage of function (2) to rate acceptibility represents a monotonically increasing way to penalize slowdown.
5
Conclusion and Future Work
In this study, we analyzed the data provided by QUHCC asking users for their acceptance of waiting times. The data indicates a growing acceptance of waiting times according to jobs’ length, although the relative acceptable waiting time decreases. Regarding slowdown as a criterion to to generalize the accepted waiting times, we argued for a slowdown factor of 1.5-2.0 to suit a tolerable level of users. Additionally, an exponential fit to the CDF of slowdowns Future work should analyze further influences on user satisfaction, e.g., this work does not respect the point in time when a job ends. Jobs finishing on
weekends or in the middle of the night may not suite the users working habits. Such jobs should have finished earlier or a scheduler may exploit, that results are needed on the following monday. Since the data was collected in a survey among HPC users at TU Dortmund University (n = 24), further surveys with more participants at other universities or institutes could support our findings.
References 1. Tang, Q., Gupta, S.K.S., Varsamopoulos, G.: Energy-efficient thermal-aware task scheduling for homogeneous high-performance computing data centers: A cyberphysical approach. IEEE Transactions on Parallel and Distributed Systems 19(11), 1458–1472 (2008) 2. Renker, J., Schlagkamp, S.: QUHCC: Questionnaire for User Habits of Compute Clusters. In: HCI International 2015 - Posters’ Extended Abstracts (in press) 3. Pruyn, A., Smidts, A.: Effects of waiting on the satisfaction with the service: Beyond objective time measures. International Journal of Research in Marketing 15(4), 321 – 334 (1998) 4. Feitelson, D.G.: Metrics for Parallel Job Scheduling and Their Convergence. In: Feitelson, D., Rudolph, L. (eds.) Job Scheduling Strategies for Parallel Processing, Lecture Notes in Computer Science, vol. 2221, pp. 188–205. Springer Berlin Heidelberg (2001)