Access Router Discovery and Selection in Advanced Wireless Networks 1
2
2
2
2
N. Blefari-Melazzi , D. Di Sorte , M. Femminella , L. Piacentini , and G. Reali 1
D.I.E. – University of Rome "Tor Vergata"
[email protected] 2 D.I.E.I. – University of Perugia {disorte,femminella,piacentini,reali}@diei.unipg.it
Abstract. Advanced mobility management is a key issue to provide nomadic users with QoS-enabled services, in the future Internet. To improve Mobile IP performance, a crucial role is played by the discovery and selection of the access router to handover to. This procedure is of great importance to enable other additional mobility-related protocols to speed up handover. This paper presents and evaluates a novel approach for carrying out this task, based on a fully distributed process, which also allows timely inter-technology handovers.
1
Introduction
IP mobility protocols enable Mobile Nodes (MNs) to execute IP layer handover between Access Routers (ARs). It is known that basic Mobile IP (MIP) protocols perform poorly, in particular for supporting QoS demanding applications. To improve them, a number of different approaches have been proposed so far: (i) micro-mobility solutions, context transfer solutions, solutions that minimize packet loss and delay. The proposed enhancements assume that the new AR to which hand over is known. However, the way to discover this information is an open research topic. In advanced mobility scenarios it is important to discover the set of potential target ARs and to select the most appropriate one before handing over. A candidate access router discovery (CARD) procedure collects information about the ARs that are candidates (CARs) for the MN’s handover [1]. Then, it is possible to identify the AR that best matches MN’s requirements and CARs’ capabilities. In this paper, we propose and analyze by simulations a procedure for CAR discovery and Target Access Router (TAR) selection in an all-IP network controlled by a single operator. This procedure is network-assisted, distributed, and based on multicast communications. It allows intra and inter-AR handover (which, in turn, can be both intra and inter-technology), and permits to dynamically self-construct a local (i.e., relevant to an AR) map of the wireless coverage. This work was carried out in the framework of the FIRB Projects VICOM and PRIMO, co-financed by the Italian Ministry for Education, Higher Education and Research (MIUR).
R. Battiti, M. Conti, and R. Lo Cigno (Eds.): WONS 2004, LNCS 2928, pp. 383–388, 2004. © IFIP International Federation for Information Processing 2004
384
2
N. Blefari-Melazzi et al.
The CARD Approach
Under the power-saving assumption that multi-mode terminals have a single active IP interface towards the current AR, the main steps that a CARD procedure must include are: (i) reverse address translation of the L2 identifiers (L2 IDs) of the operating Access Points (APs), learned by MN from beacons, into the IP addresses of the relevant ARs; (ii) discovery of service capabilities associated with the AR-AP pair. Multi-mode terminals having only one interface turned on are not allowed to scan for beacons of Radio Access Technology (RATs) different from the one currently used, thus they cannot obtain information from them. We solve this problem by means of a so-called probabilistic approach whose aim is to infer about layer 2 coverage. This choice enhances the basic CARD approach that relies on beacon listening only and which is suitable only for single mode terminals and multi-mode terminals with all radio interfaces turned on. As regards the TAR selection algorithm, executed at the current AR, it takes into account load balancing issues, received power level, and estimated values of successful handover probability between involved APs. This implies (i) substantial power saving at MNs, (ii) avoiding highly complex terminal equipment, (iii) managing critical service information only among ARs (security issues), and (iv) avoiding wireless bandwidth waste. The TAR algorithm jointly selects both the best AR in the set of CARs and the best AP among those connected to the TAR. We consider as service capabilities the bandwidth of the link from the wireless interface of an AP to the output port of the AR. We address the issues of reverse address translation and discovery of service capabilities by defining a procedure based on multicast transmissions in the wired network at two hierarchical levels. At the highest level, the network operator defines a multicast group (MGOP) including all the ARs that currently provide wireless connectivity. These ARs act as multicast hosts, whereas the functions of the multicast routing are performed by the routers in the core network. In other words, ARs are the network entities exchanging multicast information. MGOP is used to resolve the AR IP address starting from L2 ID through explicit queries. At the lowest hierarchical level, the ith access router, ARi, builds up another multicast group (MGi), which includes also all ARs with a coverage area that overlaps with the one of ARi. Clearly, we consider the coverage area of each AR as the union of the coverage areas of all APs connected to it. Such MGi is used by the ARi to efficiently distribute information about the service capabilities of its APs to the geographically adjacent ARs. The information about the coverage is not provided to ARs in a static way (i.e., by means of manual configuration, which could be not feasible in large wireless networks), but it is dynamically learned on the basis of (i) the knowledge of the L2 connectivity from MNs, and (ii) the success of previous handover events. This information is maintained (and updated) in tables locally stored at the ARs, and described below. In summary, the procedure allows associating the geographical proximity of an AR with the participation to a given multicast group. The advantage of such a procedure is that it is able to automatically self-construct this geographical mapping and also to react to variations of the coverage (e.g., the activation/deactivation of APs). The entire process is distributed and based on local exchange of update messages. For more details on such a procedure, readers should refer to [3].
Access Router Discovery and Selection in Advanced Wireless Networks
385
A CARD table related to a given AR reports the following information: (a) the L2 IDs and the RAT identifier of the APs connected to the AR; (b) the relevant service capabilities; (c) a statistic parameter which provides a sort of coverage information at layer 2; (d) the L2 ID and the RAT identifier of each geographically adjacent AP; (e) the IP address of the relevant ARs; (f) the associated service capabilities and the parameter reporting the probability of successfully completing an handover.
3
The TAR Selection Algorithm
The TAR selection may be triggered by three events: 1. upon explicit request from the customer; 2. periodically, decided by the current AR, with period TTAR, which can be adjusted by the AR dynamically, on the basis of the current load, with the aim of balancing it over the APs. In particular, each MN is assigned a period equal to
TTAR
SC −δ = max TD ⋅ 1 − e C
, T , min TAR
(1)
where SC is the amount of bandwidth available in the link from the wireless interface of the AP to the output port of the relevant AR, C is the capacity of the AP, TD and δ are design parameters. The higher the available network resources, the longer the time period TTAR. The value of TTAR is firstly determined at connection setup, then it is updated at each TAR event according to the current load of the AR-AP pair the MN is attached to. When the amount of traffic increases, the frequency of TAR events increases as well; 3. upon explicit request from MN, when it detects that the received power level PW is rapidly decreasing. In particular, this request is sent when such a power is below a threshold PWopt. We consider the MN outside the coverage area when PW gets below the receiver sensitivity, PWmin. When one of the events listed above occurs, since the handover is managed by the AR, the MN is required to send its handover preferences to the current AR. Two types of information are sent as preferences: (i) which types of RAT the MN is able to hand over to; (ii) the L2 IDs which have been received by the MN during the latest Tbeacon seconds. At this point, the AR has all the needed information to run the TAR. The proposed TAR algorithm aims to select a subset of maximum N CARs, according to a score standing, computed by means of a metric. The current AR notifies the MN of the list of the ARs (with the relevant APs) and the MN can try the handover. The metric represents the criterion that provides the quality measure, M TAR (APh, s , APz ,k ) , of an expected handover from the current APh,s to a target APz,k. TAR driven handovers may happen only towards the APs which have an entry in the tables managed by the current AR. The score is associated with a candidate ARz-APz,k pair for a handover from the APh,s . It ranges in the interval [0, 1], and its expression is given by multiplying the following three functions:
386
N. Blefari-Melazzi et al.
β SC z,k min 1, e C − 1 f 1 (SC z,k ) = 0
if SC z,k ≥ B otherwise
PW z , k − PWmin −γ P − PW f 2 (PW z ,k ) = 1 − e T z ,k if PW z,k > PWmin 0 otherwise
(
(2)
)
f 3 PrAP(h,s)→ AP(z,k) = PrAP(h,s)→ AP(z,k) = N HO,SUCC / N HO,TOT
(3)
(4)
With reference to relation (2), B represents the MN bandwidth demand to satisfactorily support the current communication session, SCz,k is the amount of available bandwidth in the link from the wireless interface of APz,k to the output port of the relevant AR, C is the capacity of APz,k, and β is a design parameter. The higher the value of β, the higher the score associated with the available bandwidth (SC), normalized by the capacity of the AP considered. In addition, if the network access (i.e., the new AR-AP pair) cannot accommodate the new flow, its score is zero. With reference to relation (3), PT is the standard value of the transmission power associated with a RAT, PWz,k is the received power from the APz,k, and γ is a design parameter similar to β. Clearly, the higher the value of γ, the higher the sensitivity of the score function to power levels below PWopt. With reference to relation (4), PrAP(h,s)→ AP(z,k) is the estimation of the handover success probability from APh,s to APz,k. This probability value should approximate the percentage of the APh,s coverage area which overlaps the APz,k coverage area. It is worth noting that, for APs of the RAT currently used, f3 is always set to 1, while, in the case of different RATs, f2 is always set to 1. The expression of the failure probability of the whole CARD/TAR process is
PrF = PrF1 + PrF 2 = (1 − PrE ) ⋅ (1 − PrN ) + PrE ⋅ PrRec
(5)
where PrE is the probability that the TAR process returns an empty TAR list, PrN is the probability to successfully hand over within the Nth attempt, and PrRec is the probability that the MN, out of the coverage of the previous AP, finds another overlooked AP to hand over to by means of self-reconfiguration, i.e., without the assistance from the network, thus performing a plain MIP handover.
4
Simulation Results
In this section, we present some simulation results showing the effectiveness of the proposed CARD/TAR approach. More details can be found in [3]. The network topology consists of a number of APs and ARs. We envision the presence of three different RATs, the capacities of which are C1=10 Mbps, C2=5 Mbps, C3=2 Mbps, respectively. The network area is a square with side of 150 meters. We have run simulations over two different coverage maps. In the first one (sparse coverage), all the area is covered by at least one RAT. In the second network
Access Router Discovery and Selection in Advanced Wireless Networks
387
1
Handover success probability at the first attempt
0.98
(a)
0.96
0.94
P1, Dense Cov P , Sparse Cov 1
0.92
0.9
0.88
0.86
0.84 N=3 TD = 30 s 0.82
0.8
0
500
1000
1500 2000 Simulation time (seconds)
2500
3000
2500
3000
1
Handover success probability within the third attempt
0.98
(b)
0.96
0.94
0.92
0.9
0.88
P , Dense Cov 3 P3, Sparse Cov
0.86
0.84 N=3 TD = 30 s 0.82
0.8
0
500
1000
1500 2000 Simulation time (seconds)
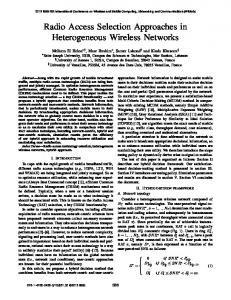
Fig. 1. Successful handover probability in both coverage cases: (a) at the first attempt; (b) by the third attempt.
0.6 Dense Cov, Inter−Technology Dense Cov, Global Sparse Cov, Inter−Technology Sparse Cov, Global
Handover Failure Probability
0.5
0.4
0.3
0.2
0.1
0
0
500
1000
1500 2000 Simulation time (seconds)
2500
3000
Fig. 2. Failure probability of the CARD/TAR procedure and of inter-technology handover attempts: dense and sparse coverage cases.
388
N. Blefari-Melazzi et al.
configuration (dense coverage) the whole area is covered by at least one AP for each RAT. Each call is associated with a bandwidth demand equal to 128 Kbps. In order to limit the number of calls rejected and handovers failed due to lack of resources, the amount of offered traffic is equal to 30% of the total capacity. The mobility model used to simulate the MNs position is the Gauss-Markov one [2]. For what concerns the CARD/TAR parameters we have made the following choices: N=3, TD=30 s, 8 8 8 Tbeacon=0.5 s, β=0.866, γ1=3.28·10 , γ2=1.46·10 , and γ3=1.8·10 , for RATi. Fig. 1 shows the probability to successfully hand over at the first and by third attempt in the dense and sparse coverage. It is worth noting that the estimated values of probability are associated with a 95% confidence interval, not shown in figures to improve their clearness. We can see that, after a brief transient period needed for selfconstructing the CARD tables, the probabilities of successfully handing over to the best-scored CARs rapidly converges to values close to 1. Clearly, the probability to successfully hand over increases with the number of attempts. We remark that performance of the CARD/TAR procedure is very satisfying for the dense wireless coverage. This is also confirmed by the global failure probability of the CARD/TAR procedure versus simulation time that is plotted in Fig. 2 together with the failure probability of inter-technology handover attempts for both coverage cases. This result was expected for two main reasons. Firstly, inter-technology handovers (the most critical ones) are not that frequent in the dense coverage case, since each RAT covers the whole area and the offered traffic load is not heavy. This means that intertechnology handovers are not solicited by load balancing actions. In fact, they are 6.24% of the total number of handovers. Secondly, in the dense coverage case, the overlapping of coverage areas of different RATs is large enough to keep the failure probability of inter-technology handover attempts low enough (around 5%, as shown in Fig. 2) to not degrade the performance of the procedure. On a total number of successful handovers equal to 164182, 128574 of them (equal to 78.31% of the total) are driven by CARD/TAR procedure. In any case, a non-zero value of the failure probability is expected, due to the intrinsic characteristic of the procedure, which, for inter-technology handovers, is blind with respect to the movement direction of driven MNs. In this regard, Fig. 2 also shows the probability to fail an inter-technology handover attempt, which results to be about 26%. As regards the sparse coverage case, the percentage of inter-technology handovers (equal to 13.37%) and the probability to fail them increase with respect to the dense coverage case (see Fig. 2). This is due to a lower number of APs and, then, to a minor overlapping of coverage areas between different RATs. The consequence is a decrease of driven handovers (equal to 68.92% on a total number of 98651) and an increase of the probability of CARD/TAR failure, which is now approximately 8%, as shown in Fig. 2.
References 1. M. Liebsch, A. Singh, H. Chaskar, D. Funato, E. Shim, “Candidate access router discovery”, Internet Draft, work in progress, June 2003. 2. T. Camp, J. Boleng, V. Davies, “A survey of mobility models for ad hoc network research”, Wireless Communication & Mobile Computing, 2(5), pp. 483–502, 2002. 3. D. Di Sorte, M. Femminella, L. Piacentini, G. Reali, "Target access router selection in advanced mobility scenarios", Technical Report, D.I.E.I., University of Perugia, available at the URL: .