Jul 30, 2004 - The light curves show a clear achromatic flattening at 50 days after the explosion. We interpret this flattening as resulting from the blast wave ...
Accurate Calorimetry of GRB 030329 D. A. Frail1 , A. M. Soderberg2 , S. R. Kulkarni2 , E. Berger2 , S. Yost3 , D. W. Fox2 & F. A. Harrison3
arXiv:astro-ph/0408002v1 30 Jul 2004
ABSTRACT We report late-time observations of the radio afterglow of GRB 030329. The light curves show a clear achromatic flattening at 50 days after the explosion. We interpret this flattening as resulting from the blast wave becoming transrelativistic. Modeling of this transition enables us to make estimates of the energy content of the burst, regardless of the initial jet structure or the distribution of initial Lorentz factors of the ejecta. We find, in accordance with other events, that GRB 030329 is well-described by an explosion with total energy of a few times 1051 erg expanding into a circumburst medium with a density of order unity. Subject headings: gamma-ray bursts: specific (GRB 030329) – radio continuum: general – cosmology: observations
1.
Introduction
To fully understand the progenitors of gamma-ray bursts (GRB) and the workings of the central engines that power them, we must first understand their energetics. The wide dispersion in isotropic GRB energies, once corrected for their jet-like geometry, results in a narrowly-clustered radiated energy Eγ ≃ 1.3 × 1051 erg (Bloom, Frail & Kulkarni 2003; Frail et al. 2001). Likewise, the kinetic energy EK of the outflow, as derived from the afterglow emission (Wijers & Galama 1999; Kumar 2000; Freedman & Waxman 2001), is clustered around a similar value (Panaitescu & Kumar 2002; Berger, Kulkarni & Frail 2003). The close agreement between the values of Eγ and EK have lead to the prevailing view that GRB 1
National Radio Astronomy Observatory, Socorro, NM 87801
2
Division of Physics, Mathematics and Astronomy, 105-24, California Institute of Technology, Pasadena, CA 91125 3
Space Radiation Laboratory 220-47, California Institute of Technology, Pasadena, CA 91125, USA
–2– explosions draw from a standard energy reservoir with a total budget of order a few times 1051 erg. GRB 030329 appeared to challenge this view. A distinct break in the optical and X-ray light curves at t ∼ 0.5 d (Price et al. 2003; Tiengo et al. 2003) if interpreted as a jet, gives an opening angle θj = 5◦ and a radiated energy (corrected for the narrow opening angle) Eγ = 5 ×1049 erg – nearly 30 times below the “standard” value. GRB 030329 is also an order of magnitude under-energetic as measured by the geometrically-corrected X-ray luminosity (Berger, Kulkarni & Frail 2003). Other low energy outliers in the Eγ distribution (Bloom, Frail & Kulkarni 2003) and X-ray luminosity distribution do exist. These energy outliers are important for understanding the diversity of cosmic explosions. They may represent genuine low energy events, a long-lived central engine, the viewing of a jet slightly off axis, or events for which the efficiency of converting the kinetic energy in the shock to radiation is low. For GRB 030329 two different mechanisms have been proposed, both of which increase increase EK to about 1051 erg. To explain the continued rise of the radio emission over the following week, Berger et al. (2003) introduced a wide-angle jet (θj = 17◦ ) with a lower Lorentz factor than the narrow jet but carrying ∼ 10× more energy. This led Berger et al. (2003) to conclude that GRBs share a common energy scale only when the total energy, including that in mildly relativistic ejecta, is considered. Another variant of the standard energy hypothesis is to include a long-lived central engine. This was first proposed to account for an extended bright phase of afterglow emission of GRB 021004 (Fox et al. 2003). Granot, Nakar & Piran (2003) and Piran, Nakar & Granot (2004) have argued that such model could also explain the bumps in the optical light curves (Lipkin et al. 2004) and the rising radio light curves (qualitatively at least). The above discussion shows that there are grounds to question the simplest hypothesis for GRB explosions. Further progress on the nature of the central engines will most certainly involve measuring and modeling the temporal and angular behavior of the energy release. Nonetheless, the total energy yield of these explosions is perhaps the most important bulk parameter of cosmic explosions. Fortunately, as has been noted in the past (Frail, Waxman & Kulkarni 2000), late-time radio observations offer us precisely this opportunity. Here, we report on observations of the radio afterglow of GRB 030329 on a timescale of 60 days to 366 days. Using these observations in conjunction with the earlier radio data (Berger et al. 2003), we are able to infer a geometry-independent estimate of the total energy of GRB 030329.
–3– 2.
Observations and Results
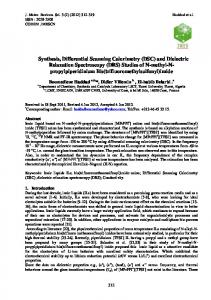
All observations were made with the Very Large Array (VLA)1 and reduced following standard practice (e.g., Frail, Waxman & Kulkarni 2000). A summary of the flux density measurements are in Table 1. In Figure 1 we plot the radio light curves supplemented with our earlier data from Berger et al. (2003) and Sheth et al. (2003). A significant flattening of the late-time radio light curves at t > ∼ 50 d can be seen, especially when compared to the steep decline measured at early times at higher frequencies (22.5-250 GHz) where the temporal slope α ≃ −2 (with F ∝ tα ) at t > 10 days. This flattening is achromatic, except at 1.43 GHz where the light curve was still rising, reaching a maximum near 300 d. A joint temporal and spectral power-law fit of the form F (ν, t) ∝ tα ν β for t > ∼ 75 d at 4.86, 8.46, 15 and 22.5 GHz gives α = −1.20 ± 0.06 and β = −0.58 ± 0.08. A similar flattening of the X-ray emission is seen by XMM-Newton in which the decay index changed from αX = −1.86 ± 0.06 to αX = −1.40 ± 0.15 between 1.24 and 37 days and 37 and 258 days after the burst (Tiengo et al. 2003; Tiengo et al. 2004). The late-time X-ray spectral index βX = 1.17 ± 0.04. The difference in the radio/X-ray spectral slopes, β − βX = 0.59 ± 0.09 is of the right magnitude (∆β = 0.5) if these bands lie on either side of the synchrotron cooling frequency, i.e. νR < νc < νX . The simplest explanation for an achromatic flattening of afterglow light curves at late times is that the blast wave has become trans-relativistic. Such a transition occurs when the rest mass energy swept up by the expanding shock becomes comparable to the initial kinetic energy of the ejecta. Given the jet parameters of GRB 030329, this is predicted to occur roughly at a time tN R ≃ tj /θj2 ≃ 60 d (Frail, Waxman & Kulkarni 2000). In the non-relativistic regime the temporal index in a constant density medium (ISM) is αN R = (21 − 15p)/10 for ν < νc or αN R = (4 − 3p)/2 for ν > νc ; here p is the energy index of the electrons accelerated into a shock, and it is related to the spectral slope p = −2β for ν > νc , and p = 1 − 2β for ν < νc . In contrast, in the relativistic regime, the flux is expected to steeply decline, t−p independent of frequency. Similar expressions exist for a a wind-blown medium (WIND) whose density varies as the inverse square of the radius: αN R = (5 − 7p)/6 for ν < νc or αN R = (8 − 7p)/6 for ν > νc (Livio & Waxman 2000). Applying the above expressions for ν < νc to the radio measurements of α and β gives p = 2.16 ± 0.16, αN R = −1.14 ± 0.24 (ISM) and αN R = −1.69 ± 0.19 (WIND). Thus the observed flattening of the radio light curves (α = −1.20 ± 0.06) is consistent with a constant 1
The VLA is operated by the National Radio Astronomy Observatory, a facility of the National Science Foundation operated under cooperative agreement by Associated Universities, Inc.
–4– density medium, but a wind-blown medium predicts a decay that steeper than expected. A wind-blown medium is rejected at the 2.5σ level. Applying the same expressions to the X-ray measurements where ν > νc , we derive p = 2.34 ± 0.08, αN R = −1.51 ± 0.18 (ISM) and αN R = −1.40 ± 0.09 (WIND). By themselves, the X-ray data is not able to distinguish between models while the radio favors the ISM model. Given this good agreement (both in the timescale and the magnitude of the flattening) with the expectations of a jet expanding in a constant density medium, we are motivated to consider more detailed models in the following sections.
3.
Modeling the Broadband Afterglow
Initially the blast wave is expanding relativistically and thus we can use the extensive machinery developed for afterglow modeling (e.g., Wijers & Galama 1999; Chevalier & Li 2000; Panaitescu & Kumar 2002). The details of our specific method are given in Yost et al. (2003). Briefly, the blast wave is assumed to accelerate a power-law distribution of electrons N(γe ) ∝ γe−p with energy index p above some minimum energy γm . The emitted spectrum (synchrotron and possibly inverse Compton) at any time t can be described by the peak flux and several break frequencies whose evolution depends on the shock dynamics. Prior to the jet break time tj the evolution is identical to a spherically symmetric shock (Sari, Piran & Narayan 1998), while for tj < t < tN R the evolution is described by a jet expanding in a constant density medium (Sari, Piran & Halpern 1999). After tN R the evolution of the break frequencies is governed by Sedov-Taylor dynamics (e.g., Frail, Waxman & Kulkarni 2000) and discussed in the next section. To allow a smooth transition of the light curves, the normalization of the emission spectrum is determined by the equations for the jet model at t = tN R . A total of six physical parameters were fitted for; the isotropic equivalent energy E52 of the jet, its half opening angle θj , the circumburst density n, the electron energy index p, and the fraction of the shock energy in electrons ǫe and in magnetic fields ǫB . We used only the radio and X-ray data since the optical data are dominated by the supernova 2003dh at late times. We show the results of our fit in Figure 1 and summarize the model parameters in Table 2. Also in Table 2 is the best-fit jet model from Berger et al. (2003). The calculation of θj from Berger et al. (2003) was originally derived using the isotropic gamma-ray energy and some assumed radiative efficiency. To be internally consistent we have re-computed θj in Table 2 directly from the E52 and n using the formalism of Sari, Piran & Halpern (1999).
–5– 4.
Modeling the Afterglow at Late Times
As noted above, after tNR the blast wave becomes non-relativistic. On about the same timescale the side-ways expansion of the jet becomes important and eventually the blast wave becomes spherical. Modeling the afterglow emission at late stages thus offer the distinct advantage of the inferred parameters being independent of the relative orientation of the axis of the jet and the line of sight to the observer. We follow the methodology of Frail, Waxman & Kulkarni (2000) (Appendix A) and Berger et al. (2004). Essentially the primary observable is the synchrotron self-absorbed radio spectrum with the peak flux density (fν ), the optical depth (τν ) and the characteristic synchrotron frequency (νm ). These parameters, in turn, are determined by the values of four physical parameters at t = tNR : the magnetic field (BNR ), the shock radius (rNR ), the minimum Lorentz factor of the electrons (γm,NR ) and the number density of the radiating electrons (ne,NR ). The evolution of the self-absorbed spectrum is governed by the dynamics of the blast wave. In particular, at late times the blast wave evolution is well described by the Sedov-von Neumann-Taylor (SNT) solution (Zel’dovich & Raizer 2002): r = rNR (t/tNR )2/5 ; speed (in units of speed of light, c) β = βNR (t/tNR )−3/5 ; B = BNR (t/tNR )−3/5 and γm = γm,NR (t/tN R )−6/5 . We drop the NR subscript hereafter for clarity. There are four unknown parameters but usually only three observables (but see §4.3). Thus we must introduce additional constraints to fully specify a solution. We consider three possible constraints and these are discussed in turn.
4.1.
Equipartition
The standard approach in radio astronomy is to appeal to equipartition for an additional constraint. This means equating the fraction of energy in relativistic electrons, Ee = [(p − 1)/(p − 2)] × ne γm me c2 V to the energy in magnetic fields, EB = B 2 V /8π or ǫe = ǫB . Here, V is the volume within the shell of emitting electrons, V = 4πr 3 /η cm3 , where r/η is the thickness of the shell and we use the standard (thin shell) assumption that η ≈ 10. The density n = ne × 3/η where 3/η is the shock compression factor. Under the assumption of equipartition we find the following best-fit solution for rest −0.024 −0.0059 G, cm, implying Bep ≈ 0.18 νm,9 frame physical parameters: rep ≈ 3.5 × 10¹⁷ νm,9 −0.56 0.51 −3 0.52 0.52 γm,ep ≈ 42 νm,9 , ne,ep ≈ 5.9 νm,9 cm and ǫe,ep νm,9 = ǫB,ep νm,9 ≈ 0.08 for values of p ≈ 2.2 and tNR ≈ 50 days.
–6– As a consistency check, we note that applying Equation 13 of (Frail, Waxman & Kulkarni −0.0059 2000) gives βep ≈ 1.25 νm,9 and thus we confirm that it is appropriate to apply the SNT solution at tNR . Because νm drops below our lowest frequency just before tNR , the model parameters are given in terms of νm,9 which is normalized to 1 GHz at tNR for p = 2.2, in accordance with our relativistic modeling (§3). Using the model constraints above we derive Emin = −0.065 Ee,ep + EB,ep ≈ 1.3 × 1050 νm,9 erg. The total energy in the ejecta (including shocked −0.59 protons), derived from the Sedov-Taylor energy equation is EST,ep ≈ 8.5 × 1050 νm,9 erg.
4.2.
Consistency with the Sedov-Taylor Solution
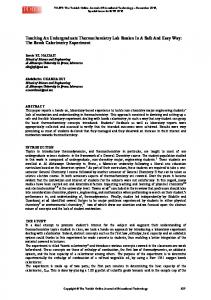
Instead of adopting the equipartition assumption in §4.1, we can use the more general constraint that the energy in the electrons and magnetic field does not exceed the thermal energy (Frail, Waxman & Kulkarni 2000), Ee + EB ≤ EST /2. This constraint is a logical consequence of our assumption that the blast wave can be described by a Sedov-Taylor solution at late times. For radii above (below) rep , the summed energy rises steeply as r 11 (r −6 ) when EB > Ee (EB < Ee ). With this method we can probe the parameter space away from equipartition and derive a range of allowed values for EST . Figure 2 shows the dependence of EST and (Ee +EB ) on radius. As can be seen from the Figure, the permitted values of the Sedov-Taylor energy are EST ≈ 0.64 − 2.2 × 1051 erg, corresponding to radius values of r ≈ 2.2 − 4.0 × 1017 cm. This range of radii implies the following ranges for the physical parameters: B ≈ 0.027−0.30 G, ne ≈ 2.3 − 160 cm−3 , β ≈ 0.78 − 1.4, ǫe ≈ 4.4 × 10⁻² − 0.49, ǫB ≈ 1.7 × 10⁻⁴ − 0.45.
4.3.
The Fourth Observable - Cooling Frequency
Late-time X-ray observations (Tiengo et al. 2004) as in §3 allow us to constrain the cooling frequency νc , and hence determine the radius of the blastwave. In particular, X-ray observations allow us to model the evolution of the cooling frequency, νc ∝ B −3 t−2 (Frail, Waxman & Kulkarni 2000). For the same value of νm,9 used above: r ≈ 3.6 × 1017 cm, B ≈ 0.21 G, γm ≈ 39, ne ≈ 4.3 cm−3 and ǫe ≈ 0.064, ǫB ≈ 0.13 (Table 2). The total energy 50 in the ejecta EST ≈ 7.8+2.2 erg. The uncertainty in the energy is dominated by the −1.6 × 10 flux density error of the X-ray observations at t ∼ 60 days.
–7– 5.
Angular Size of the Afterglow
Comparison of our derived size with the observed size offers the opportunity to directly verify models. Normally such a comparison is inaccurate since the expected angular sizes are small and until recently, they were inferred from interstellar scintillation observations (e.g., Frail et al. 1997). However, Taylor et al. (2004) have directly determined the size of the fireball for GRB 030329, measuring an angular diameter θ = 172 ± 43 µas at t = 83.3 d. Using Sedov-Taylor expansion (i.e., r ∝ t2/5 ) to scale to tN R =50 d, and assuming a Lambda cosmology (H0 = 71 km/s/Mpc, ΩM = 0.27, ΩΛ = 0.73), the angular-diameter distance of GRB 030329 at z = 0.1685 is dA = 589 Mpc and its radius r = (6.2 ± 1.5) × 1017 cm. Thus it appears that the VLBA measurement is at odds with the radius estimates deduced above, albeit at only 2σ significance (see Figure 2). To better understand this difference (and to extract more robust estimates of r and EST /n), it would be useful to jointly fit the evolution of the apparent size of GRB 030329 (Oren, Nakar & Piran 2004) together with the evolution of the afterglow emission.
6.
Discussion and Conclusions
Continued monitoring of the afterglow of GRB 030329 has revealed an achromatic flattening (§2) of the light curves whose magnitude and timescale are consistent with a jet-like outflow which is undergoing a dynamical transition to trans-relativistic expansion. We have modeled the entire dataset (1-366 d) and derive a total kinetic energy of 9.0 × 1050 erg (§3). This estimate agrees with a previous estimate of 6.7 × 1050 erg, based on observations from 1-64 d (Berger et al. 2003). Thus our analysis is consistent with earlier conclusions that GRB 030329 was not an under-energetic burst (Berger et al. 2003; Granot, Nakar & Piran 2003). We also attempted to derive an independent estimate of the energy using only those observations beyond t > tN R . The Sedov-Taylor analysis (§4) traces all ejecta regardless of the initial jet structure or the distribution of initial Lorentz factors of the ejecta. This accurate calorimetric method has now been applied to GRB 030329, GRB 970508 and GRB 980703 (Frail, Waxman & Kulkarni 2000; Berger et al. 2004). In this particular case, the value of this approach is limited by the uncertainty in the exact value of the synchrotron peak frequency νm . Using the X-ray data as an added constraint (§4.3), and adopting νm =1 GHz at tN R we derive an energy of 7.8 × 1050 erg. Strictly speaking the kinetic energies given above are upper limits since they are derived at a fixed time (tN R ). The fireball undergoes radiative losses especially prior to the time
–8– when the evolution is in the fast cooling regime (Sari, Piran & Narayan 1998). We estimate from our full model in §3 that this fast-to-slow cooling transition occurs at t = 0.03 d. At this time the total isotropic energy E52 = 2.0 × 1052 erg and the geometrically-corrected energy EK = 2.2 × 1051 erg. The energy (isotropic or otherwise) drops to 42% of this value at tj and 37% at tN R . With further observations of GRB 030329 we have an opportunity to look for departures in the standard blastwave model. At present, the physical parameters of the blastwave derived from only the first two months (Table 2 and Berger et al. 2003) provide a remarkably good prediction of its subsequent behavior for up to a year later. Deviations may be expected to occur at late times because of an injection of additional energy by slower moving ejecta, an evolution in the microphysical parameters of the shock (p, ǫe , ǫB ) with time, or a change in the density structure of circumburst medium. The current estimates of the energy and other physical parameters of GRB 030329 are accurate at best to a factor of two. While a more quantitative analysis (e.g., Yost et al. 2003) is needed, we can already rule out order of magnitude changes in EK , ǫe and ǫB . Identifying changes in the density structure is more difficult because between 1 day and 1 year the blast wave samples only a small range of radii in its rest frame (∼0.1 to 0.4 pc). However, at its present rate of decay the afterglow of GRB 030329 will be visible at centimeter wavelengths for the next decade. Thus the prospects for tracing the continued evolution of GRB 030329 are excellent. DAF wishes to thank Pawan Kumar for his hospitality at the University of Texas, Austin during which time this paper was begun. We acknowledge NSF and NASA grants for support.
REFERENCES Berger, E., Kulkarni, S. R., and Frail, D. A. 2003, ApJ, 590, 379. Berger, E. et al. 2003, Nature, 426, 154. Berger, E. et al. 2004, Ap J, submitted. Bloom, J. S., Frail, D. A., and Kulkarni, S. R. 2003, ApJ, 594, 674. Chevalier, R. A. and Li, Z. 2000, ApJ, 536, 195. Fox, D. W. et al. 2003, Nature, 422, 284.
–9– Frail, D. A., Kulkarni, S. R., Nicastro, S. R., Feroci, M., and Taylor, G. B. 1997, Nature, 389, 261. Frail, D. A. et al. 2001, ApJ, 562, L55. Frail, D. A., Waxman, E., and Kulkarni, S. R. 2000, ApJ, 537, 191. Freedman, D. L. and Waxman, E. 2001, ApJ, 547, 922. Goodman, J. 1997, New Astr., 2(5), 449. Granot, J., Nakar, E., and Piran, T. 2003, Nature, 426, 138. Kumar, P. 2000, ApJ, 538, L125. Lipkin, Y. M. et al. 2004, ApJ, 606, 381. Livio, M. and Waxman, E. 2000, ApJ, 538, 187. Oren, Y., Nakar, E., and Piran, T. 2004, MNRAS submitted, astro-ph/0406277. Panaitescu, A. and Kumar, P. 2002, ApJ, 571, 779. Piran, T., Nakar, E., and Granot, J. 2004, Gamma-Ray Burst Symposium, Santa Fe; astroph/0312138. Price, P. A. et al. 2003, Nature, 423, 844. Sari, R., Piran, T., and Halpern, J. P. 1999, ApJ, 519, L17. Sari, R., Piran, T., and Narayan, R. 1998, ApJ, 497, L17. Sheth, K., Frail, D. A., White, S., Das, M., Bertoldi, F., Walter, F., Kulkarni, S. R., and Berger, E. 2003, ApJ, 595, L33. Taylor et al. 2004, ApJ in press; astro-ph/0405300. Tiengo, A., Mereghetti, S., Ghisellini, G., Rossi, E., Ghirlanda, G., and Schartel, N. 2003, A&A, 409, 983. Tiengo, A., Mereghetti, S., Ghisellini, G., Tavecchio, F., and Ghirlanda, G. 2004, A&A Submitted, astro-ph/0402644. Wijers, R. A. M. J. and Galama, T. J. 1999, ApJ, 523, 177. Yost, S. A., Harrison, F. A., Sari, R., and Frail, D. A. 2003, ApJ, 597, 459.
– 10 – Zel’dovich, Y. B. and Raizer, Y. P. 2002, Physics of Shock Waves and High Temperature Hydrodynamic Phenomena, (Mineola, NY: Dover).
This preprint was prepared with the AAS LATEX macros v5.2.
– 11 –
Table 1. Observational Summary
2003 2003 2003 2003 2003 2003 2003 2003 2003 2003 2003 2003 2003 2003 2003 2003 2004 2004 2004 2004 2004
Date (UT) (1)
∆t (days) (2)
F1.43 (µJy) (3)
F4.86 (µJy) (4)
F8.46 (µJy) (5)
F15.0 (µJy) (6)
F22.5 (µJy) (7)
Jun. 10.00 Jun. 15.00 Jun. 25.01 Jun. 30.94 Jul. 09.02 Jul. 27.88 Aug. 06.06 Aug. 11.96 Aug. 25.89 Sep. 18.79 Sep. 22.74 Sep. 27.75 Oct. 06.73 Oct. 30.72 Dec. 02.58 Dec. 07.58 Jan. 31.53 Feb. 05.36 Feb. 26.27 Mar. 06.33 Mar. 29.41
72.52 1009±116 4808±67 3454±69 2328±207 ··· 77.52 1111±84 4613±66 3572±54 2680±200 ··· 87.53 ··· · · · 3016±31 2100±165 1650±65 93.46 1360±40 3290±57 2130±55 ··· ··· 101.54 ··· · · · 2299±65 1729±182 1290±65 120.40 ··· · · · 1190±35 ··· ··· 129.58 1276±69 1955±62 ··· ··· ··· 135.48 ··· · · · 1525±56 997±171 794±119 149.41 1677±66 1677±55 1277±51 ··· ··· 173.31 3470±65 1590±52 1122±45 ··· ··· 177.26 ··· · · · 1002±91 436±200 374±166 182.27 2240±66 1600±46 1050±38 ··· ··· 191.25 2450±58 1407±44 931±41 ··· ··· 215.24 1709±52 1154±43 874±44 ··· ··· 248.10 1276±40 999±32 637±33 ··· ··· 253.10 1541±41 949±32 696±31 ··· ··· 308.05 1240±54 ··· 686±38 ··· ··· 312.88 1800±53 1029±26 675±24 ··· ··· 333.79 1360±96 865±33 547±27 ··· ··· 342.85 1075±124 886±45 447±33 ··· ··· 365.93 904±102 767±34 528±29 ··· ···
Table columns are (1) Epoch of observation; (2) time in days from burst, (3) flux density at 1.43 GHz, (4) flux density at 4.86 GHz, (5) flux density at 8.46 GHz, (6) flux density at 15 GHz, and (7) flux density at 22.5 GHz. ∗
Note. — To maximize sensitivity, the full VLA bandwidth (100 MHz) was recorded
– 12 – in each of two hands of circular polarization. The amplitude scale was calibrated with observations of J1331+303 (3C 286), while phase calibration was achieved with frequent observations of J1051+2119 at all frequencies except for 1.43 GHz where J1016+2037 was used instead.
– 13 –
Table 2. Best Fit Parameters For Different Models
a
Model
Range (d)
2
χ /dof
b
tj (d)
Rel. 1-64 5133/164 10 Full 1-366 3245/241 14 Non-Rel 50-366 5313/75 N/A
tN R (d)
EK c (erg)
θj n (rad) (cm−3 )
N/A 48 50
0.67 0.90 0.78
0.45 0.47 N/A
3.0 2.2 1.3
p
ǫe
2.2 0.19 2.2 0.17 2.2 0.06
ǫB (%) 4.2 7.4 13
a
From top to bottom, the parameters are given for the relativistic model by Berger et al. (2003), the full evolution model from §3, and the non-relativistic model from §4.3. b
The large χ2 for these fits is affected by intensity variations induced by density inhomogeneities in the ionized interstellar medium of our galaxy (Goodman 1997). Diffractive scintillation dominates at early times, while the fluctuations in the latetime 1.43 GHz light curve are likely due to large scale refractive effects. c
The blastwave kinetic energy in units of 1051 ergs. The first two models have been corrected for collimation by multiplying the isotropic equivalent energy by (1 − cos θj ). The energies for the first two models are calculated at tj , while the last model is the Sedov-Taylor energy calculated at tN R .
– 14 –
Flux Density (µJy)
105
104
103
102 10 100 Time After Burst (days) Fig. 1.— Radio light curves of the afterglow of GRB 030329. From bottom to top the measurements are were taken at 1.43 GHz (green square), 4.86 GHz (blue triangle), 8.46 GHz (red circle), 15.3 GHz (black diamond), 22.5 GHz (green diamond), 43 GHz (blue circle), 100 GHz (red triangle), 250 GHz (black square). The data have been scaled relative to the 8.46 GHz measurements by ν β , where β is the spectral slope between 4.86 and 22.5 GHz for t > ∼ 75 d (§2). The solid lines are the predicted emission from a jet expanding into a constant density medium (see §3). The flattening of the light curves beyond t∼50 days occurs when the jet expansion becomes sub-relativistic. Although this model captures the gross evolution of the observed light curves (the rise to maximum, the initial steep decay at high frequencies and the flattening of the optically thin light curves at late times), the unprecedented high signal-to-noise of this data does, however, show some deficiencies of our model. In addition to the expected fluctuations at low frequencies due to interstellar scintillation, there are real variations at higher frequencies such as the “bump” between 50 and 60 day seen at 15 GHz. Owing to our simplistic treatment, the model also under predicts (or over predicts) the flux density at different transition times when the evolution changes abruptly.
– 15 –
Fig. 2.— Dependence of energy on radius at t = tNR ≈ 50 days as described in Section 4. The sum of the energy in electrons and magnetic fields, Ee + EB , is minimized near the equipartition radius. The Sedov-Taylor energy scales with the unknown radius as EST ∝ r −2 . The permitted range of kinetic energy values are defined where (Ee + EB ) ≤ EST /2 and are marked by the bounded solid line. Here we are adopting νm,NR =1 GHz. The radius of the shock, as measured from VLBI observations of Taylor et al. (2004) at t ≈ 83.3 days (and scaled down to t ≈ 50 days as r ∝ t0.4 ) is shown by the vertical shaded band; it is a factor of ∼ 2 times larger (1.8σ significance) than that predicted by our NR modeling. Including the additional constraint of the X-ray observations (Tiengo et al. 2004), we are able to constrain the radius to 3.6 ± 0.5 × 1017 cm (vertical shaded band) – nearly equal to the equipartition 50 value. This implies a slightly lower energy of EST ≈ 7.8+2.2 erg. −1.6 × 10