http://genomebiology.com/2002/3/7/research/0034.1
Research
Jo Vandesompele, Katleen De Preter, Filip Pattyn, Bruce Poppe, Nadine Van Roy, Anne De Paepe and Frank Speleman
comment
Accurate normalization of real-time quantitative RT-PCR data by geometric averaging of multiple internal control genes
Address: Center for Medical Genetics, Ghent University Hospital 1K5, De Pintelaan 185, B-9000 Ghent, Belgium.
Published: 18 June 2002 Genome Biology 2002, 3(7):research0034.1–0034.11
reviews
Correspondence: Frank Speleman. E-mail:
[email protected]
Received: 20 December 2001 Revised: 10 April 2002 Accepted: 7 May 2002
The electronic version of this article is the complete one and can be found online at http://genomebiology.com/2002/3/7/research/0034 reports
© 2002 Vandesompele et al., licensee BioMed Central Ltd (Print ISSN 1465-6906; Online ISSN 1465-6914)
Abstract
Background
analysis of thousands of genes in two differentially labeled RNA populations [1], while real-time RT-PCR provides the simultaneous measurement of gene expression in many different samples for a limited number of genes, and is especially suitable when only a small number of cells are available [2-4]. Both techniques have the advantage of speed, throughput and a high degree of potential automation compared to conventional quantification methods, such as northern-blot analysis, ribonuclease protection assay, or
information
Gene-expression analysis is increasingly important in many fields of biological research. Understanding patterns of expressed genes is expected to provide insight into complex regulatory networks and will most probably lead to the identification of genes relevant to new biological processes, or implicated in disease. Two recently developed methods to measure transcript abundance have gained much popularity and are frequently applied. Microarrays allow the parallel
interactions
Conclusions: The normalization strategy presented here is a prerequisite for accurate RT-PCR expression profiling, which, among other things, opens up the possibility of studying the biological relevance of small expression differences.
refereed research
Results: We outline a robust and innovative strategy to identify the most stably expressed control genes in a given set of tissues, and to determine the minimum number of genes required to calculate a reliable normalization factor. We have evaluated ten housekeeping genes from different abundance and functional classes in various human tissues, and demonstrated that the conventional use of a single gene for normalization leads to relatively large errors in a significant proportion of samples tested. The geometric mean of multiple carefully selected housekeeping genes was validated as an accurate normalization factor by analyzing publicly available microarray data.
deposited research
Background: Gene-expression analysis is increasingly important in biological research, with realtime reverse transcription PCR (RT-PCR) becoming the method of choice for high-throughput and accurate expression profiling of selected genes. Given the increased sensitivity, reproducibility and large dynamic range of this methodology, the requirements for a proper internal control gene for normalization have become increasingly stringent. Although housekeeping gene expression has been reported to vary considerably, no systematic survey has properly determined the errors related to the common practice of using only one control gene, nor presented an adequate way of working around this problem.
2 Genome Biology
Vol 3 No 7
Vandesompele et al.
competitive RT-PCR. Nevertheless, these new approaches require the same kind of normalization as the traditional methods of mRNA quantification. Several variables need to be controlled for in gene-expression analysis, such as the amount of starting material, enzymatic efficiencies, and differences between tissues or cells in overall transcriptional activity. Various strategies have been applied to normalize these variations. Under controlled conditions of reproducible extraction of good-quality RNA, the gene transcript number is ideally standardized to the number of cells, but accurate enumeration of cells is often precluded, for example when starting with solid tissue. Another frequently applied normalization scalar is the RNA mass quantity, especially in northern blot analysis. There are several arguments against the use of mass quantity. The quality of RNA and related efficiency of the enzymatic reactions are not taken into account. Moreover, in some instances it is impossible to quantify this parameter, for example, when only minimal amounts of RNA are available from microdissected tissues. Probably the strongest argument against the use of total RNA mass for normalization is the fact that it consists predominantly of rRNA molecules, and is not always representative of the mRNA fraction. This was recently evidenced by a significant imbalance between rRNA and mRNA content in approximately 7.5% of mammary adenocarcinomas [5]. Also, it has been reported that rRNA transcription is affected by biological factors and drugs [6-8]. Further drawbacks to the use of 18S or 28S rRNA molecules as standards are their absence in purified mRNA samples, and their high abundance compared to target mRNA transcripts. The latter makes it difficult to accurately subtract the baseline value in real-time RT-PCR data analysis. To date, internal control genes are most frequently used to normalize the mRNA fraction. This internal control - often referred to as a housekeeping gene - should not vary in the tissues or cells under investigation, or in response to experimental treatment. However, many studies make use of these constitutively expressed control genes without proper validation of their presumed stability of expression. But the literature shows that housekeeping gene expression - although occasionally constant in a given cell type or experimental condition - can vary considerably (reviewed in [9-12]). With the increased sensitivity, reproducibility and large dynamic range of real-time RT-PCR methods, the requirements for a proper internal control gene have become increasingly stringent. In this study, we carried out an extensive evaluation of 10 commonly used housekeeping genes in 13 different human tissues, and outlined a procedure for calculating a normalization factor based on multiple control genes for more accurate and reliable normalization of gene-expression data. Furthermore, this normalization factor was validated in a comparative study with frequently applied microarray scaling factors using publicly available microarray data.
Results Expression profiling of housekeeping genes Primers were designed for ten commonly used housekeeping genes (ACTB, B2M, GAPD, HMBS, HPRT1, RPL13A, SDHA, TBP, UBC and YWHAZ) (see Table 1 for full gene name, accession number, function, chromosomal localization, alias, existence of processed pseudogenes, and indication that primers span an intron; see Table 2 for primer sequences). Special attention was paid to selecting genes that belong to different functional classes, which significantly reduces the chance that genes might be co-regulated. The expression level of these 10 internal control genes was determined in 34 neuroblastoma cell lines (independently prepared in different labs from different patients), 20 short-term cultured normal fibroblast samples from different individuals, 13 normal leukocyte samples, 9 normal bone-marrow samples, and 9 additional normal human tissues from pooled organs (heart, brain, fetal brain, lung, trachea, kidney, mammary gland, small intestine and uterus). The raw expression values are available as a tab-delimited file (see Additional data files).
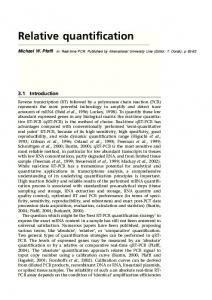
Single control normalization error To determine the possible errors related to the common practice of using only one housekeeping gene for normalization, we calculated the ratio of the ratios of two control genes in two different samples (from the same tissue panel) and termed it the single control normalization error, E (see Materials and methods). For two ideal internal control genes (constant ratio between the genes in all samples), E equals 1. In practice, observed E values are larger than 1 and constitute the erroneous E-fold expression difference between two samples, depending on the particular housekeeping gene used for normalization. E values were calculated for all 45 two-by-two combinations of control genes and 865 two-bytwo sample combinations within the available tissue panels (neuroblastoma, fibroblast, leukocyte, bone marrow and a series of normal tissues from Clontech; that is, a total of 38,925 data points) (Figure 1). In addition, the systematic error distribution was calculated by analysis of repeated runs of the same control gene. The average 75th and 90th percentile E values are 3.0 (range 2.1-3.9), and 6.4 (range 3.0-10.9), respectively.
Gene-stability measure and ranking of selected housekeeping genes It is generally accepted that gene-expression levels should be normalized by a carefully selected stable internal control gene. However, to validate the presumed stable expression of a given control gene, prior knowledge of a reliable measure to normalize this gene in order to remove any nonspecific variation is required. To address this circular problem, we developed a gene-stability measure to determine the expression stability of control genes on the basis of non-normalized expression levels. This measure relies on the principle that the expression ratio of two ideal internal control genes is
http://genomebiology.com/2002/3/7/research/0034.3
Table 1 Internal control genes evaluated in this study Name
Function
Localization
Pseudogene*
Primers†
ACTB
NM_001101
Beta actin
Cytoskeletal structural protein
7p15-p12
+
S
510455
B2M
NM_004048
Beta-2-microglobulin
Beta-chain of major histocompatibility complex class I molecules
15q21-q22
-
S
51940
GAPD
NM_002046
Glyceraldehyde-3phosphate dehydrogenase
Oxidoreductase in glycolysis and gluconeogenesis
12p13
+
D
510510
HMBS
NM_000190
Hydroxymethyl-bilane synthase
Heme synthesis, porphyrin metabolism
11q23
-
D
Porphobilinogen 245564 deaminase
HPRT1
NM_000194
Hypoxanthine phosphoribosyl-transferase 1
Purine synthesis in salvage pathway
Xq26
+
D
345845
RPL13A
NM_012423
Ribosomal protein L13a
Structural component of the large 60S ribosomal subunit
19q13
+
D
SDHA
NM_004168
Succinate dehydrogenase complex, subunit A
Electron transporter in the TCA cycle and respiratory chain
5p15
+
D
375812
TBP
NM_003194
TATA box binding protein
General RNA polymerase II transcription factor
6q27
-
D
280735
UBC
M26880
Ubiquitin C
Protein degradation
12q24
-
D
Tyrosine 3-monooxygenase/ tryptophan 5-monooxygenase activation protein, zeta polypeptide
Signal transduction by binding to phosphorylated serine residues on a variety of signaling molecules
2p25
+
S§
23 kDa highly basic protein
IMAGE‡
-
510582 416026
Primer sequences for internal control genes Forward primer
Reverse primer
ACTB
CTGGAACGGTGAAGGTGACA TGCTGTCTCCATGTTTGATGTATCT TGCACCACCAACTGCTTAGC GGCAATGCGGCTGCAA TGACACTGGCAAAACAATGCA CCTGGAGGAGAAGAGGAAAGAGA TGGGAACAAGAGGGCATCTG ATTTGGGTCGCGGTTCTTG ACTTTTGGTACATTGTGGCTTCAA
AAGGGACTTCCTGTAACAATGCA TCTCTGCTCCCCACCTCTAAGT GGCATGGACTGTGGTCATGAG GGGTACCCACGCGAATCAC GGTCCTTTTCACCAGCAAGCT TTGAGGACCTCTGTGTATTTGTCAA CCACCACTGCATCAAATTCATG TGCCTTGACATTCTCGATGGT CCGCCAGGACAAACCAGTAT
GAPD HMBS† HPRT1 RPL13A SDHA UBC YWHAZ
interactions
Symbol*
refereed research
Table 2
deposited research
Phospholipase A2
*Presence (+) or absence (-) of a retropseudogene in the genome determined by BLAST analysis of the mRNA sequence using the high-throughput genomic sequences database (htgs) or human genome as database. †Localization of forward and reverse primer in different exons (D) or the same exon (S). ‡IMAGE cDNA clone number according to [14]. §A single-exon gene.
B2M
reports
YWHAZ NM_003406
Alias
reviews
Accession number
comment
Symbol
*TBP primer sequences are described in [24]. †HMBS primer sequences kindly provided by E. Mensink and L. van de Locht (Nijmegen, The Netherlands).
to decreasing expression stability. For every control gene we determined the pairwise variation with all other control genes as the standard deviation of the logarithmically transformed expression ratios, and defined the internal control gene-stability measure M as the average pairwise
information
identical in all samples, regardless of the experimental condition or cell type. In this way, variation of the expression ratios of two real-life housekeeping genes reflects the fact that one (or both) of the genes is (are) not constantly expressed, with increasing variation in ratio corresponding
4 Genome Biology
Vol 3 No 7
Vandesompele et al.
Cummulative distribution (%)
100 80 60 Neuroblastoma Normal pool Leukocyte Bone marrow Fibroblast Systematic error
40 20
0
2
4 6 8 10 Single control normalization error E
12
Figure 1 Single control normalization error values (E) were calculated as the ratio of the ratio of two control genes in two different samples (see Materials and methods), and summarized here as cumulative distribution plots for the different tissue panels, pointing at considerable variation in housekeeping gene expression.
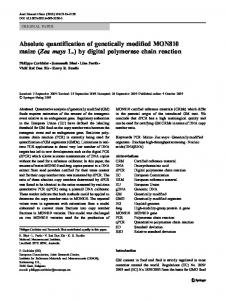
variation of a particular gene with all other control genes. Genes with the lowest M values have the most stable expression. Assuming that the control genes are not co-regulated, stepwise exclusion of the gene with the highest M value results in a combination of two constitutively expressed housekeeping genes that have the most stable expression in the tested samples. To manage the large number of calculations, we have written a Visual Basic Application (VBA) for Microsoft Excel - termed geNorm - that automatically calculates the gene-stability measure M for all control genes in a given set of samples (geNorm is freely available from the authors on request). The program enables elimination of the worst-scoring housekeeping gene (that is, the one with the highest M value) and recalculation of new M values for the remaining genes. Using this VBA applet, we ranked the ten control genes in the five tissue panels tested according to their expression stability (Figure 2, Table 3). In addition, the systematic variation was calculated as the pairwise variation, V, for repeated RT-PCR experiments on the same gene, reflecting the inherent machine, enzymatic and pipet variation.
Normalization factor calculation based on the geometric mean of multiple control genes We concluded that in order to measure expression levels accurately, normalization by multiple housekeeping genes instead of one is required. Consequently, a normalization factor based on the expression levels of the best-performing housekeeping genes must be calculated. For accurate averaging of the control genes, we propose to use the geometric
mean instead of the arithmetic mean, as the former controls better for possible outlying values and abundance differences between the different genes. The number of genes used for geometric averaging is a trade-off between practical considerations and accuracy. It is obvious that an accurate normalization factor should not include the rather unstable genes that were observed in some tissues. On the other hand, it remains relatively impractical to quantify, for example, eight control genes when only a few target genes need to be studied, or when only minimal amounts of RNA are available. Furthermore, it is a waste of resources to quantify more genes than necessary if all genes are relatively stably expressed and if the normalization factor does not significantly change whether or not more genes are included. Taking all this into consideration, we recommend the minimal use of the three most stable internal control genes for calculation of an RT-PCR normalization factor (NFn, n = 3), and stepwise inclusion of more control genes until the (n + 1)th gene has no significant contribution to the newly calculated normalization factor (NFn+1). To determine the possible need or utility of including more than three genes for normalization, the pairwise variation Vn/n+1 was calculated between the two sequential normalization factors (NFn and NFn+1) for all samples within the same tissue panel (with aij=NFn,i and aik=NFn+1,i, n the number of genes used for normalization (3 £ n £ 9), and i the sample index; see Equations 2 and 3 in Materials and methods). A large variation means that the added gene has a significant effect and should preferably be included for calculation of a reliable
http://genomebiology.com/2002/3/7/research/0034.5
Average expression stability M
1.0
comment
1.2
0.8 reviews
0.6 0.4 0.2 10
9
3
2 reports
8 6 5 7 4 Number of remaining control genes
Figure 2 Average expression stability values (M) of remaining control genes during stepwise exclusion of the least stable control gene in the different tissue panels (black circle, neuroblastoma; white circle, normal pool; white square, bone marrow; black square, leukocyte; gray circle, fibroblast; gray square, systematic error). See also Table 3 for the ranking of the genes according to their expression stability.
Control genes ranked in order of their expression stability* Fibroblast
Leukocyte
Bone marrow
Normal pool
B2M
HMBS
ACTB
ACTB
B2M
RPL13A
B2M
HMBS
B2M
ACTB
RPL13A
HPRT1
HMBS
YWHAZ
TBP
SDHA
SDHA
TBP
RPL13A
YWHAZ
TBP
TBP
SDHA
UBC
HMBS
ACTB
RPL13A
GAPD
TBP
UBC
UBC
GAPD
HPRT1
HPRT1
SDHA
YWHAZ
B2M
YWHAZ
HMBS
HPRT1 - GAPD
HPRT1 - GAPD UBC - YWHAZ
UBC - RPL13A SDHA - GAPD
*Increasing from top to bottom; the two most stable control genes in each cell type, for example HPRT1 and GAPD in fibroblasts, cannot be ranked in order because of the required use of gene ratios for genestability measurements.
Validation of proposed real-time RT-PCR normalization factors To assess the validity of the established gene-stability measure, that is, that genes with the lowest M values have indeed the most stable expression, we determined the genespecific variation for each control gene as the variation coefficient of the expression levels after normalization. This
information
ACTB
interactions
Neuroblastoma
refereed research
Table 3
factors, reflecting the effect of adding an (n+1)th gene (Figure 3a). It is apparent that the inclusion of a fourth gene has no significant effect (that is, low V3/4 value) for leukocytes, fibroblasts and bone marrow. This is also illustrated by the nearly perfect correlation between NF3 and NF4 values, as shown for fibroblasts in Figure 3b. On the basis of these data, we decided to take 0.15 as a cut-off value, below which the inclusion of an additional control gene is not required. For neuroblastoma and the pool of normal tissues, one and two additional genes, respectively, are necessary for reliable normalization (see also Figure 3b). The high V8/9 and V9/10 values for the normal pool, neuroblastoma and leukocytes corroborate very well the findings obtained by stepwise exclusion of the worst-scoring control gene (Figure 2). This analysis showed an initial steep decrease in average M value, pointing at two aberrantly expressed control genes for leukocytes and one unstable gene for neuroblastoma and the pool of normal tissues. Furthermore, the need to include additional control genes for these last two tissue panels is in keeping with the high variation in controlgene expression, as evidenced from Figure 2.
deposited research
normalization factor. For all tissue types, normalization factors were calculated for the three most stable control genes (that is, those with the lowest M value) and for seven additional factors by stepwise inclusion of the most stable remaining control gene. Pairwise variations were subsequently calculated for every series of NFn and NFn+1 normalization
6 Genome Biology
Vol 3 No 7
(a)
Vandesompele et al.
0.30 V3/4
V4/5
V5/6
V6/7
V7/8
V8/9
V9/10
Pairwise variation V
0.25 0.20 0.15 0.10 0.05
A
Fibroblast V3/4 = 0.109 r = 0.989
Neuroblastoma V4/5 = 0.138 r = 0.970
NF3 C
Normal pool V3/4 = 0.251 r = 0.867
NF3
B
NF4 NF6
NF4
Scatterplots of normalization factors
NF4
(b)
NF5
Normal pool Leukocyte Neuroblastoma Fibroblast Bone marrow
Normal pool V5/6 = 0.148 r = 0.983
D
NF5
Figure 3 Determination of the optimal number of control genes for normalization. (a) Pairwise variation (Vn/n+1) analysis between the normalization factors NFn and NFn+1 to determine the number of control genes required for accurate normalization (arrowhead = optimal number of control genes for normalization). (b) Selected scatterplots of normalization factors before (x-axis) and after (y-axis) inclusion of an (n + 1)th control gene (r = Spearman rank correlation coefficient). Low variation values, V, correspond to high correlation coefficients. It is clear that there is no need to include more than three, four or five control genes for fibroblast (A), neuroblastoma (B) and the normal pooled tissues (D), respectively. In contrast, panel C demonstrates that inclusion of at least a fourth control gene is required for the normal pooled tissues.
coefficient should be minimal for proper housekeeping genes. Three different normalization factors were calculated, based on the geometric mean of three genes with, respectively, the lowest (NF3(1-3)), the highest (NF3(8-10)), and intermediate M values (NF3(6-8)) (as determined by geNorm). We
subsequently determined the average gene-specific variation of the three genes with the most stable expression (that is, the lowest variation coefficient) for each normalization factor and within each tissue panel (Figure 4a). It is clear that the gene-specific variation in all tissue panels is by far
http://genomebiology.com/2002/3/7/research/0034.7
(b) 1.6
60 NF3(1-3)
NF3(6-8)
NF3(8-10)
40 30 20 10
NF5
1.4
NFM