Available on line at Association of the Chemical Engineers of Serbia AChE www.ache.org.rs/CICEQ
Chemical Industry & Chemical Engineering Quarterly
Chem. Ind. Chem. Eng. Q. 20 (4) 531−539 (2014)
YONG SUN1 GANG YANG2 ZHI-HUA JIA3 CHAO WEN4 LIAN ZHANG1 1
Monash University Department of Chemical Engineering, VIC Australia 2 National Engineering Laboratory of Hydrometallurgical Cleaner Production Technology, Institute of Process Engineering, Chinese Academy of Sciences, Beijing, China 3 College of Life Sciences, Northwest A&F University, Yangling, China 4 School of Information Science and Technology, Northwest University, Xi’an, China SCIENTIFIC PAPER UDC 633.15:66.094.941:54 DOI 10.2298/CICEQ130911035S
CI&CEQ
ACID HYDROLYSIS OF CORN STOVER USING HYDROCHLORIC ACID: KINETIC MODELING AND STATISTICAL OPTIMIZATION Article Highlights • Kinetic parameters of models for predicting xylose, glucose, furfural, acetic acid were obtained • The corn stover during hydrolysis was characterized by FTIR, XRD and SEM techniques 3 • A 2 five-level Central Composite Design was used for optimization • The validation of the statistical model indicates good agreement Abstract
The hydrolysis of corn stover using hydrochloric acid was studied. The kinetic parameters of the mathematical models for predicting the yields of xylose, glucose, furfural and acetic acid were obtained, and the corresponding xylose generation activation energy of 100 kJ/mol was determined. The characterization of corn stover using different techniques during hydrolysis indicated an effective removal of xylan and slight alterations of the structures of cellulose and lignin. A 23 five-level central composite design (CCD) was used to develop a statistical model for the optimization of process variables including acid concentration, pretreatment temperature and time. The optimum conditions determined by this model were found to be 108 °C for 80 min with acid concentration of 5.8%. Under these conditions, the maximised results were the following: xylose 19.93 g/L, glucose 1.2 g/L, furfural 1.5 g/L and acetic acid 1.3 g/L. The validation of the model indicated good agreement between the experimental results and the predicted values. Keywords: hydrochloric acid, corn stover, kinetics, statistical modeling.
Corn is the third most widely planted crop in China. The corresponding by-product, corn stover, is produced in large quantities annually [1]. One of the most widely adopted approaches for the utilization of corn stover in China is to produce livestock feed [2]. With the depletion of fossil resources and for the sake of national security and environmental protection that come with the exploration and consumption of fossil resources, attention is being paid to the development of alternative solutions of using renewable biomass
Correspondence: G. Yang, National Engineering Laboratory of Hydrometallurgical Cleaner Production Technology, Institute of Process Engineering, Chinese Academy of Sciences, Beijing, 100190, China. E-mail:
[email protected] Paper received: 11 September, 2013 Paper revised: 3 November, 2013 Paper accepted:13 November, 2013
such as corn stover as feedstock for fuel and chemical production [3]. Acid hydrolysis is widely used to treat lingocellulosic materials to obtain mono-sugars. This pretreatment usually yields solutions rich in hemicellulosesderived sugars. Among these mono-sugars, pentose (D-xylose) and hexose (glucose) are predominant, and a large number of microorganisms have been proven to possess the capability to ferment pentose and hexoses into value-added products such as fuel ethanol and organic acid [4]. The hemicellulosic hydrolysis of different lignocellulosic materials, such as rice straw, sugarcane bagasse, silage, Eucaliptus wood etc. [5-7], has been reported. It is widely accepted that the optimum conditions for minimum monosaccharide decomposition to furans and degradation of cellulose is highly dependent upon the type of raw materials and operational conditions. There are
531
Y. SUN et al.: ACID HYDROLYSIS OF CORN STOVER…
some studies of parametric investigation of using traditional method of one factor at a time for dilute hydrochloric acid hydrolysis of corn stover [8]. However, comprehensive studies of kinetic modeling of dilute hydrochloric acid hydrolysis of corn stover followed by using statistical tools for optimization of multiple factors by combining experimental designs with interpolation by second-degree polynomial equations, to our best knowledge, has rarely been reported before. In addition, one of the main disadvantages of using hydrochloric acid as catalyst for hydrolysis is its high expense for transport. In the case of biomass utilization, the process will be more cost-effective when the site for the production of hydrochloric acid is close to the biomass processing site [9]. Recently, we have developed a novel acid-base coupled production process, which employed boron salts as the recycling intermediate for the conversion of KCl together with the steam into the alkaline (K2CO3) and acid (HCl) [10]. According to our economical analysis upon current process parameters, the cost-effective availability of hydrochloric acid on-site is achievable, especially for the small or medium scale plant. It is believed that this process will be very suitable for on-site pretreatment and utilization of biomass on a small scale [11]. This is another initiative of this work. EXPERIMENTAL Materials The corn stover was harvested from Hebei province, China and was milled to approximately 5 cm in length. The major compositions of obtained corn stover are shown in Table 1. Table 1. Main composition of corn stover Component
Content, wt.%
Cellulose
35
Xylan
20
Lignin
10
Ash
4
Protein
9
Wax
3
Chem. Ind. Chem. Eng. Q. 20 (4) 531−539 (2014)
Dilute acid hydrolysis The experiment was conducted in a 1.5 L automatic mechanical stirring titanium autoclave system using heating transfer oil bath. In this study, the reactor was loaded with 100 g of dry corn stover and 1 L hydrochloric acid solution. The acid concentration, pretreatment temperature, and time range were 2–7%, 95–125 °C and 25–240 min, respectively. Characterization of the raw material, hydrolyzate The raw material was analyzed by the following methods. For cellulose and hemicelluloses, the standard Van Soest method was applied. The lignin content was analyzed by the Klason method. After hydrolysis, the solid was separated and pH was adjusted by adding Ca(OH)2. The resulting hydrolysis solutions was centrifuged and filtered, then was injected into HPLC with 10 times dilution 1/10 V/V. FT-IR Analysis. The Spectrum GX (Perkin-Elmer USA 2003) infrared spectrometer was used for the study of the surface functional groups. Disc was prepared by mixing 0.5 mg sample with 200 mg of KBr (Merck, for spectroscopy) in an agate mortar and then pressing the result mixture at 2 MPa for 1 min. The samples were scanned in the spectra range of 4000– –370 cm-1. X-Ray diffraction (XRD) analysis. XRD patterns were obtained with a Philips X’pert diffractometer using CuKα radiation at a wavelength of λ = 1.5406 Å, the thin powder sample was placed onto an oriented monocrystalline quartz plate and scanned from 10 to 90°. SEM morphology. Surface morphology was examined using a Hitachi S-450 scanning electron microscope. The high performance liquid chromatography (HPLC) for xylose, glucose, acetic acid were performed using Agilent 1100 HPLC with transgenomic ION-300 column (oven temperature maintained at 45 °C at a flow rate of 0.4 ml/min, mobile phase 0.005 N sulfuric acid and RID detector. The furfural was analyzed using UV-Vis spectroscopy by a LabTech UV1000 spectrometer at 280 nm. Experimental design and statistical analysis
The result shows a typical grass type precursor with relatively larger amount of hemicellulose content. The hydrochloric acid was obtained from the acidbase coupled process with a concentration of 20 wt.%. It was diluted to concentrations for experimental purposes.
532
A central composite design (CCD) with three independent variables was investigated to study the response pattern and to determine the optimum combination of acid concentration, pretreatment temperature, and pretreatment time to maximise sugar recovery. The design with three independent variables at five different levels, six axial points and six central points (total 20 runs) was adopted to find offset,
Y. SUN et al.: ACID HYDROLYSIS OF CORN STOVER…
Chem. Ind. Chem. Eng. Q. 20 (4) 531−539 (2014)
linear, quadratic and interaction terms of the following equation: 3
3
3
i =1
i =1
i < j , j =2
Y = b0 + bi X i + bii X i 2 + bij X i X j
(1)
The range and levels of variables optimized are shown in Table 2. Table 2. Range and levels of independent process variables used for CDD -1
0
1
β
Temperature, °C
X1
95
105
110
120
125
Acid concentration, %
X2
2
4
6
6.5
7
Time, min
X3
20
60
120
180
240
Independent variable
Symbol -β
The statistical significance of regression terms was checked by analysis of variance, ANOVA. Kinetic models The kinetic experiment was conducted with 2% hydrochloric acid as catalyst at different temperatures from 105–125 °C. The liquid solid ratio was kept at 10. At 20, 40, 60, 180, 240 and 300 min, the hydrolyzates were taken from the reaction media and analyzed. In this paper we adopted the widely accepted model, which was first introduced to model cellulose hydrolysis [12]: k1 k2 Xylan ⎯⎯ → Xylose ⎯⎯→ Decomposites
The concentrations of xylose (Y), glucose (G), furfural (F) and acetic acid (Ac) as functions of time can be expressed as:
Y =
k 1[Ym 0 ] −k1t (e − e −k 2t ) k 2 − k1
(2)
G = G0 (1 − e −k 3t )
(3)
F = F0 (1 − e −k 4t )
(4)
Ac = Ac 0 (1 − e −k 4t )
(5)
where Ym0 is the maximum potential xylans in corn stover (in this study, we fixed it at 21 g/L), k1–k5 are kinetic parameters, and G0, F0, Ac0 are the potential concentrations of glucose, furfural and acetic acid, respectively. The detailed derivation of the models of each compound can be found in the literature [13]. The nonlinear regression analysis was performed in MATLAB using a generic algorithm in regional and global optimization.
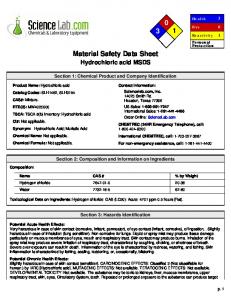
RESULTS AND DISCUSSION Kinetic modeling during hydrolysis The concentrations of xylose, glucose, furfural and acetic acid released at different temperatures and times are shown in Figure 1. The corresponding obtained kinetic parameters are shown in Table 3. The kinetics of xylose concentrations at different temperature behaves differently when compared with glucose. The concentrations of xylose will reach a plateau (around 20 g/L) and then experience a progressive decrease. This was due to decomposition and subsequent side reaction that occurrs as hydrolysis continues [14]. This also indicates that a relatively shorter hydrolysis duration around 60 min is favorable for the maximum generation of xylose and minimum concentrations of degradation byproducts when reaction temperature is over 115 °C. While for the concentration of glucose, furfural and acetic acid, the concentration increases progressively reaching about 6, 6 and 2 g/L, respectively, at 300 min at 125 °C. By fitting experimental data into Eqs. (2)-(5), we obtained the model constants consequently. Table 3 lists the kinetic parameters of individual compounds. By comparing the values of k1 and k2, the generation of xylose was more accelerated with the increase of the hydrolysis temperature comparing that with the rate of xylose decomposition. However, since the temperature of reaction triggers both the generation and degradation of xylose, the secondary degradation reaction could be intensified substantially with a further increase of temperature, which results in the decrease of final yield of pentose. By applying Arrhenius power law, the corresponding activation energy (100 kJ/mol) of generation of xylose was obtained. This value is often lower than the activation energy of wood-based materials such as birch wood and hardwood [15-16] and comparable to the activation energy of using sugar cane as substrate [17]. This also indicates that the corn stover is an easy processed raw material for xylose production. In terms of glucose yield, the values of both G0 and k3 increase with temperature. At relative low temperature, the obtained glucose (3–4 g/L) mainly comes from glucan, which is susceptible to the hydrolysis. As temperature increases and reaction continues, the degradation of cellulose will begin to contribute to the generation of glucose. The selectivity of hydrochloric acid hydrolysis, of which the xylose concentration is relatively high while leaving most cellulose and lignin in solid phase, is comparable to the results in literature [18]. For the kinetics of furfural, the F0 and k4 increase with temperature. At relative low hydrolysis temperature, the
533
Y. SUN et al.: ACID HYDROLYSIS OF CORN STOVER…
32
24 20 16 12 8
Glucose
o
105 C o 115 C o 125 C
6
Glucose Concentration/g/L
Xylose Concentration/g/L
Xylose
o
105 C o 115 C o 125 C
28
CI&CEQ 20 (4) 531−539 (2014)
4
2
4 0
0
50
100
150
200
250
0
300
0
50
100
Furfural
o
Furfural Concentration/g/L
4
2
0
0
50
100
150
200
250
200
250
2.5 2.0 1.5 1.0 0.5 0.0
300
0
50
100
150
200
250
Time/min
Time/min
Figure 1. Kinetic model fit for products produced during hydrolysis at different temperatures. Table 3. Kinetic and statistical parameters for xylose, glucose, furfural and acetic acid concentration Temperature, °C
k1 / min-1
k2×103 / min-1
r2
Xylose 105
0.028
0.510
0.9668
115
0.069
0.631
0.9567
125
0.093
0.780
0.9277
Glucose
k3 / min-1
G0 / g L
105
0.0101
3.88
0.9438
115
0.0124
4.02
0.9261
125
0.0231
5.13
0.9399
–1
Furfural
k4 / min-1
F0 / g L
105
0.008
2.95
0.9472
115
0.007
4.20
0.9455
125
0.003
–1
9.90
0.8981
Acetic acid k5 / min
-1
Ac0 / g L–1
105
0.031
2.41
0.9522
115
0.043
2.88
0.9675
125
0.050
3.42
0.9184
534
300
Acetic Acid
o
105 C o 115 C o 125 C
3.0
Acetic Acid Concentration/g/L
105 C o 115 C o 125 C
6
150
Time/min
Time/min
300
Y. SUN et al.: ACID HYDROLYSIS OF CORN STOVER…
CI&CEQ 20 (4) 531−539 (2014)
lower values of F0 and k4 are obtained. Since furfural is an inhibitor of the growth of microbes for the downstream fermentation, the condition that minimizes the generation of furfural is favorable. For the kinetics of acetic acid production, the range of Ac0 varies narrowly from 1.5–2 g/L. At relative low hydrolysis temperature, the lower value of Ac0 and k5 is obtained, indicating the relatively lower hydrolysis temperature favors the condition that minimizes the acetic acid in hydrolysate. For all the models, r2 was higher than 90%, indicating good agreement between experimental data and predicted data. These kinetic experiments, which were carried out under different variable conditions such as pretreatment temperature and time, can also be employed for defining the levels of independent process variables to be used for process optimization.
vibration within plane of pentose. As reaction continues, the intensity of those bands decreases, indicating the generation of xylose from hemicellulose composite during the reaction. The band of out plane vibration of glucose hexo-ring at 1400 and 900 cm-1 were slightly changed as reaction continues indicating that the structure of cellulose was also affected during reaction. The spectra of solid present bands at 1630, 1140 and 835 cm-1, which are the characteristic of HGS grass lignin [20]. As the reaction continues, the intensity of those bands begins to decrease indicating the lignin librating during hydrolysis. This also agrees with the observation of hydrolysates that solution of hydrolysate becomes brown as hydrolysis continues. The XRD spectroscopy of the corn stover solid at different duration times at 115 °C is shown in Figure 3. The crystalline degree of the cellulose was crystallographically characterized by means of X-ray diffraction using the following equation:
Characterization of the solid residues during reaction In this paper, we chose 110 °C as the characterization temperature, because it is a relatively less severe condition to hemicelluloses and cellulose during hydrolysis. The FT-IR spectroscopy of the corn stover solid at different duration times at 110 °C is shown in Figure 2. The spectra of solid at different reaction duration time presents a band at 1250 cm-1, which represents the characteristic band of C-H bending vibration within plane of hemicellulose [19]. As reaction coninues, the intensity of those bands decreases, indicating the removal of hemicellulose composite during the reaction. The spectra of solid at different reaction duration presents bands at 1050 and 890 cm-1, which represent the characteristic bands of C-H bending
C =
Ic Ic + Ia
× 100
(6)
where Ic is the intensity of cellulose crystallite in the (002) plane, while Ia is the intensity at 2θ = 19°. As the reaction continues, the crystalline degree of the cellulose slightly changes, indicating the cellulosic crystallite was not significantly affected during the reaction. This also agrees well with the HPLC analysis that using hydrochloric acid as catalyst for hydrolysis shows good selectivity for xylose generation and less destructive degradation of cellulose. The XRD pattern of corn stover also provides sharp bands from 40 to 80°, which indicates the existence of plant ash such as Si, Al and Ca bound with organic tissues in corn
CS
% Transmittance
300min 120min 80min 50min 30min
4000
3500
3000
2500 2000 1500 Wavenumber(cm )
1000
500
Figure 2. FTIR Spectra of corn stover during hydrolysis at different duration at 110 °C, where CS represents the raw corn stover.
535
Y. SUN et al.: ACID HYDROLYSIS OF CORN STOVER…
Chem. Ind. Chem. Eng. Q. 20 (4) 531−539 (2014)
CS
Intensity
300min 120min 80min 50min 30min 10
20
30
40
50
60
70
80
90
2 Theta Figure 3. XRD Spectra of corn stover during hydrolysis at different duration at 110 °C, where CS represents the raw corn stover.
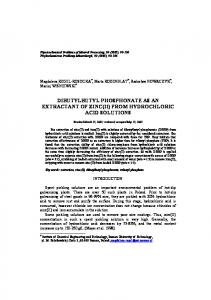
stover. The SEM morphologies of corn stover before and after reaction (300 min) are illustrated in Figure 4. The surface of corn stover is more rigid, smooth and compact before reaction (Figure 4a). After the hydrolysis for 300 min, the surface becomes more irregular and rough (Figure 4b) due to the removal of hemicelluloses and slightly exposure of lignin and cellulose. This indicates that the acid pretreatment makes more accessible sites to the downstream process, such as cellulase treatment, biological delignification, etc. In order to further validate the characterization results, analysis of composition of hemicelluloses, lignin and cellulose after dilute acid treatment were performed. Comparing the results with the original composition from Table 1 indicated that more than 90% xylan was effectively removed, while about 90% lignin and 95% cellulose still remained in the solid residue after acid hydrolysis. All these characterization results together with the HPLC results indicate that hemicellulose was effectively removed, while the lignin and cellulose mostly remained structurally unchanged during dilute acid hydrolysis. This implies
(a)
that dilute hydrochloric acid is an effective catalyst for selectively generation of xylose while keeping by-products such as glucose and furfural at reasonable low level. Statistical analysis and process optimization The experimental results associated with interactions between each independent variable are shown in Table 4. Equation (1) was applied to the set data for multiple linear regressions to determine the optimum conditions for dilute hydrochloric acid hydrolysis of corn stover that results in the maximum value of xylose. By applying multiple regression analysis to experimental data, the following second degree polynomial was found to represent relationship between xylose and acid concentration, pretreatment time and temperature:
Y = 62 − 1.01X 1 + 1.42 X 2 + 0.41X 3 + 0.02 X 1X 2 − −0.001X 1X 3 + 0.04 X 2 X 3 + 0.003 X 12 − 2
−1.5 X 2 − 0.0001X 3
2
(b)
Figure 4. SEM Morphology of corn stover at 115 °C; a) before reaction; b) after 300 min.
536
(7)
Y. SUN et al.: ACID HYDROLYSIS OF CORN STOVER…
Chem. Ind. Chem. Eng. Q. 20 (4) 531−539 (2014)
Table 4. Three factor central composite design with response of dependent variables Run
Code values
Response
X1
X2
X3
1
0
0
-β
2
-1
-1
+1
19.42
3
0
0
0
19.52
10.25
4
-1
+1
-1
14.82
5
+1
+1
-1
16.12 17.56
6
0
-β
0
7
0
+β
0
20.21
8
-1
+1
+1
20.88
9
+1
-1
+1
17.98
10
+β
0
0
20.92
11
+1
+1
+1
21.12
12
-1
-1
-1
9.88
13
+1
-1
-1
20.13
14
0
0
+β
20.81
15
-β
0
0
17.18
16
0
0
0
19.11
17
0
0
0
13.68
18
0
0
0
14.01
19
0
0
0
15.78
20
0
0
0
15.06
Analysis of variance (ANOVA) was carried out to assess the significance of the fit of the second order polynomial for the concentration of xylose (Supplemental Table, available from the author upon request). A model F-value of 16.87 and a very low probability value ((Prob>F) less than 0.0001) imply significant model fit. In addition, the model did not show lack of fit and present high determination coefficients R2 = = 0.952 indicating that 95.2% of the variability was explained by the model. The Supplemental Table presents the results obtained after carrying out ANOVA. The values of probability less than 0.05 indicate that the model terms are significant. Values greater than 0.1 indicate model terms are not significant. From regression model of xylose concentration, the model terms X1, X2, X3, X12, X22 and X32 were also significant with probability >95%. X1X2 are also significant indicating the interaction between reaction temperature and acid concentration is important. However, the values of probability for interaction between X1X3 and X2X3 are over 0.1 indicating those interactions are not significant to xylose concentration, which means these insignificances only apply to this specific experimental conditions. The “Lack of Fit F-value” of 0.64 implies that there is insignificant lack of fit. To obtain the optimum conditions for hydrochloric acid hydrolysis of corn stover, the regression
coefficients were used to generate the response surface plots from the model in Figure 5. In Figure 5a, with increase of acid concentration from 1 to 6% while reaction temperature was fixed at 110 °C, the maximum xylose concentration (20 g/L) was achieved at concentration around 5.5%. In Figure 5b shows the interaction between reaction temperature and duration at a fixed acid concentration of 4%. It can be observed that the xylose concentration generally increases with increasing the reaction temperature. In terms of the influence of reaction time, at lower reaction temperature, xylose concentration increases as reaction continues. With further increase of temperature, this trend begins to change, and xylose concentration profile begins to drop as reaction duration reaches 60 min. The maximum xylose concentration (20.8 g/L) was achieved at 105 °C for 150 min. Figure 5c shows the interaction between reaction temperature and acid concentration at fixed reaction duration of 120 min, with the increase of temperature and acid concentration, the xylose concentration increases. The maximum xylose concentration was obtained for the acid concentration of 7% and reaction temperature 110 °C. To find the critical value, the partial differential was done according to Eq. (7). The optimum condition was obtained at the following value: 108 °C for
537
Y. SUN et al.: ACID HYDROLYSIS OF CORN STOVER…
(a)
Chem. Ind. Chem. Eng. Q. 20 (4) 531−539 (2014)
(b)
(c)
Figure 5. Response surface and contour plots of modeled xylose concentration as a function of: a) reaction time and acid concentration at fixed temperature of 110 °C; b) reaction time and reaction temperature at fixed acid concentration of 4%; c) acid concentration and reaction temperature at fixed reaction time of 120 min.
80 min with acid concentration of 5.8%. In order to validate the developed statistical model, experiments were duplicated at the obtained optimum condition. The obtained analytical results are the following: xylose 19.93 g/L, glucose 1.2 g/L, furfural 1.5 g/L, acetic acid 1.3 g/L. These values agree well with the values predicted from models. The result hydrolysate indicates low concentration of toxic substances (fufural and acetic acid are all less than 1.5 g/L) and provides high quality of substrate for the subsequent biochemical processing.
funds of institute of processes engineering of Chinese Academy of Sciences (No: 062702) is also appreciated. REFERENCES [1]
Y. Sun, J. Wei, M.S. Yao, G. Yang, Asia-Pac. J. Chem. Eng. 7 (2012) 547-554
[2]
X. You, The Production and Application of Xylitol, Chinese Light Industry Publishing House, Beijing, 1984
[3]
A. McAloon, F. Taylor, W. Yee, Determining the Cost of Producing Ethanol from Corn Starch and Lignocellulosic Feedstocks, Technical Report from National Renewable Energy Laboratory, Washington, D.C., 2000
[4]
B. Hahn-Hägerdal, M. Galbe, M.F. Gorwa-Grauslund, G. Lidén, G. Zacchi, Trends Biotechnol. 24 (2006) 549-556
[5]
T.C. Hsu, G.L. Guo, W.H. Chen, W.S. Hwang, Bioresour. Technol. 101 (2010) 4907-4913
[6]
R. Velmurugan, K. Muthukumar, Bioresour. Technol. 102 (2011) 7119-7123
[7]
H.E. Grethlein, Biotechnol. Adv. 2 (1984) 43-62
[8]
A.M. Dean, PhD Thesis, Missouri University of Science and Technology, 1981
[9]
G. Yang, PhD Thesis, Institute of Process Engineering, CAS, Beijing, 2005
[10]
Z.H. Li, Sci. Chin. 2 (2009) 12-17
[11]
Y. Sun, G. Yang, J.P. Zhang, M.S. Yao, Chem. Ind. Chem. Eng. Q. 18 (2012) 137-145
[12]
J.F. Saeman, Ind. Eng. Chem. Res. 37 (1945) 43-52
[13]
A. Herrera, S.J. Tellez-Luis, J.A. Ramirez, M. Vazquez, J. Cereal. Sci. 37 (2003) 267-274
[14]
A. Herrera, S.J. Tellez-Luis, J.J Gonzalez-Cabriales, J.A. Ramirez, M. Vazquez, J. Food. Eng. 63 (2004) 103-109
[15]
M.T. Maloney, T.W. Chapman, A.J. Baker, Biotechnol. Bioeng. 27 (1985) 355-361
CONCLUSIONS The kinetic study indicates that corn stover is a good feedstock for xylose production with xylose generation activation energy of 100 kJ/mol. Both FTIR and XRD characterization techniques indicate that the hydrochloric acid is an effective catalyst with high selectivity of xylose generation and produces less destructive effects on cellulose and lignin. A 23 five-level central composite design (CCD) was used to develop a statistical model for optimization of process variables which are acid concentration, pretreatment temperature and time. The optimum conditions using this model are 108 °C for 80 min with acid concentration of 5.8%. Under these conditions, the obtained analytical results are the following: xylose 19.93 g/L, glucose 1.2 g/L, furfural 1.5 g/L and acetic acid 1.3 g/L. Acknowledgements Financial support for this work was provided by National High Technology Research and Development Program 863 (2011AA060703). The Innovation
538
Y. SUN et al.: ACID HYDROLYSIS OF CORN STOVER…
Chem. Ind. Chem. Eng. Q. 20 (4) 531−539 (2014)
[16]
S.B. Kim, D.M. Yum, S.C. Park, Bioresour. Technol. 72 (2000) 289-294
[19]
Y. Sun, J.P. Zhang, G. Yang, Z.H. Li, Spectrosc. Spect. Anal. 27 (2007) 1997-2000
[17]
G. Bustos, J.A. Ramírez, G. Garrote, M. Vázquez, Appl. Biochem. Biotech. 104 (2003) 51-68
[20]
Y. Sun, G. Yang, M.S. Yao, J.P Zhang, Chem. Eng. Technol. 35 (2012) 309-316.
[18]
G.L. Cao, N.Q. Ren, A.J. Wang, D.J. Lee, W.Q. Guo, B.F. Liu, Y. Feng, Q.L Zhao, Int. J. Hydrogen Energy 34 (2009) 7182-7188
YONG SUN1 GANG YANG2 ZHI-HUA JIA3 CHAO WEN4 LIAN ZHANG1 1
Monash University Department of Chemical Engineering, VIC Australia 2 National Engineering Laboratory of Hydrometallurgical Cleaner Production Technology, Institute of Process Engineering, Chinese Academy of Sciences, Beijing, China 3 College of Life Sciences, Northwest A&F University, Yangling, China 4 School of Information Science and Technology, Northwest University, Xi’an, China NAUČNI RAD
KISELA HIDROLIZA KUKURUZOVINE POMOĆU HLOROVODONIČNE KISELINE: KINETIČKO MODELOVANJE I STATISTIČKA OPTIMIZACIJA U radu je proučavana hidroliza kukuruzovine pomoću hlorovodonične kiseline. Dobiveni su kinetički parametri matematičkih modela za predviđanje prinosa ksiloze, glukoze, furfurala i sirćetne kiseline. Takođe, određena je energija aktivacije stvaranja ksiloze od 100 kJ/mol. Karakterizacija kukuruzovine različitim tehnikama tokom hidrolize ukazuje na efikasno uklanjanje ksilana i male promene struktura celuloze i lignina. Za razvoj statističkog modela za optimizaciju procesnih promenljivih, kao što su koncentracija kiseline, temperatura predtretmana i vreme hidrolize, korišćen je centralni kompozitni dizajn 23 sa 5 nivoa. Optimalni uslovi utvrđeni ovim modelom su: 108 °C, 80 min i koncentracija kiseline od 5,8%. Pod ovim uslovima, dobijaju se sledeći maksimalni rezultati: ksiloza 19,93 g/L, glukoza 1,2 g/L, furfural 1,5 g/L i sirćetna kiselina 1,3 g/L. Validacija modela pokazuje dobro slaganje između eksperimentalnih rezultata i predviđenih vrednosti. Ključne reči: hlorovodonična kiselina, kukuruzovina, kinetika, statističko modelovanje.
539