Actionable Knowledge Discovery for Threats Intelligence Support using a Multi-Dimensional Data Mining Methodology Olivier Thonnard Royal Military Academy Polytechnic Faculty Brussels, Belgium
[email protected]
Abstract This paper describes a multi-dimensional knowledge discovery and data mining (KDD) methodology that aims at discovering actionable knowledge related to Internet threats, taking into account domain expert guidance and the integration of domain-specific intelligence during the data mining process. The objectives are twofold: i) to develop global indicators for assessing the prevalence of certain malicious activities on the Internet, and ii) to get insights into the modus operandi of new emerging attack phenomena, so as to improve our understanding of threats. In this paper, we first present the generic aspects of a domain-driven graph-based KDD methodology, which is based on two main components: a clique-based clustering technique and a concepts synthesis process using cliques’ intersections. Then, to evaluate the applicability of this approach to our application domain, we use a large dataset of real-world attack traces collected since 2003. Our experimental results show that significant insights can be obtained into the domain of threat intelligence by using this multi-dimensional knowledge discovery method.
Keywords: Internet threat intelligence, domain-driven data mining, knowledge discovery
1. Introduction Recently, the security community has been facing what appears to be highly organized and professional malicious activities on the Internet. It has been reported that, motivated by financial profit, today’s cybercriminals seem to be building a new and growing underground economy by offering commoditization of activities such as the sale of 0day exploits and new yet-undetected malware, the sale of compromised hosts, spamming, phishing, etc [12]. For se-
Marc Dacier Symantec Research Labs Sophia Antipolis, France marc
[email protected]
curity researchers, this leads to the observation of increasingly coordinated attack activities, which are often related to botnets [37], stealthy multi-headed worms [29] or other sophisticated emerging threats. Client’s applications, typically web-browsers and email applications, become also a common infection vector for propagating new malwares that in turn aim at scanning and recruiting more vulnerable machines into zombie armies, which seem to be the preferred weapon of cybercriminals today. There are several data collection initiatives that offer plausible indicators supporting those claims. However, these data sources are often built in an ad-hoc way to study a specific problem. In fact, the security community seems to lack two important things regarding threats evaluation: i) unbiased, meaningful and publicly available data about Internet threats, and ii) global threat analysis techniques that can offer real scientific answers to open questions and speculations circulating in the community. Similarly to criminal forensics, the security analyst needs to synthesize different pieces of evidence in order to investigate the root causes of attack phenomena. This is a tedious, lengthy and informal process mostly relying on the analysts expertise. For those reasons, we seek to develop a multi-dimensional knowledge discovery and data mining (KDD) methodology that should help us to improve, in a more systematic way, our understandings of new Internet threats. Our idea consists in i) extracting relevant nuggets of knowledge by mining a complex dataset according to different properties considered as relevant by a domain expert; and in ii) synthesizing those pieces of knowledge so as to create higher-level concepts describing the underlying phenomena. The remainder of this paper is organized as follows: in Section 2, we report on related work. In Section 3, we present the theoretical foundations of our method. Section 4 describes our experimental environment. Section 5 presents the lessons learned when applying our technique to a large dataset of real-world attack traces. Finally, we conclude in
Section 6.
2. Related Work This work is at the crossroads of several domains of expertise. Regarding Internet threats, there are, broadly speaking, three main approaches to monitor, collect and analyze network threats: i) low- or high-interaction honeypots [35, 34, 36, 1, 42], which are vulnerable computers intentionally set up as traps to attract and observe attackers on the Internet; ii) the so-called Internet telescopes, or darknets [27, 39, 38, 33, 8], which are used in order to monitor all unsolicited traffic directed to unused IP subnets; and iii) projects of collecting and sharing firewall and IDS logs gathered from a very large number of heterogeneous sources [11]. This work builds upon a broad experience in this specific security domain [25, 23, 29, 31, 30]. Then, in [32], we investigated the usability of a clique-based technique to group together network traces that share some specific features, namely packet inter-arrival times (IAT’s), and more recently in [41] we developed an efficient graph-based clustering method to extract groups of correlated attack time series from an extensive honeynet dataset. We acknowledge the seminal work of Yegneswaran and colleagues on “Internet situational awareness” [44], in which they explore ways to integrate honeypot data into daily network security monitoring, with the purpose of effectively classifying and summarizing the data to provide ongoing situational awareness. Their approach aims at providing tactical information, usable for the day to day operations whereas we are interested in strategic information that reveal long term trends and the modus operandi of the attackers. Another closely related work is BotMiner [14], a general botnet detection framework that is independent of botnet C&C protocol and structure, and requires no a priori knowledge of botnets. The authors developed a prototype system that is based on: i) a two-steps clustering (based on X-Means) of C&C communication and activity flows of bots, so as to detect similarity patterns; and ii) the combination of both types of patterns by means of cross-correlation. Our research is different as we do not focus exclusively on the problem of detecting botnets, but instead we aim at understanding the higher-level modus operandi of global attack phenomena (e.g., which “communities” of machines are possibly involved in what type of activities, on which networks they are hosted, etc.). In the past ten years, a growing number of research projects have applied data mining to various problems in the security field, but almost exclusively in intrusion detection rather than honeynets. Furthermore, most research has focused on the construction and the improvement of operational IDSs via data mining techniques, rather than on the discovery of new and fundamental insights into the nature of attacks [3]. Only a few well-known data mining techniques
(e.g., association rules, frequent episode rules or clustering algorithms) have been widely used in intrusion detection, either on raw network data (such as ADAM [2], MADAM ID [21], and [22]), or on intrusion alerts streams [18, 10]. Our work is very different, both in terms of techniques and objectives. We seek to develop a domain-driven knowledge discovery method that could help us to better understand and characterize the modus operandi of Internet threats from a global perspective, rather than focusing on a technique to improve the detection rate of an IDS on one given network. Finally, some facets of our work are related to some other graph-theoretical data mining techniques, such as the hypergraph model used for clustering of data in a highdimensional space [15], or the hyperclique pattern discovery approach for mining association patterns [43, 16]. In both cases, all data properties are used together in the graph partitioning algorithm to create hypergraph structures, while in our case we adopt a bottom-up approach by combining different sets of one-dimensional cliques obtained for each property separately.
3. A Methodology for Multi-Dimensional Knowledge Mining 3.1. Overview This section presents our approach in general terms which will be instantiated according to our concrete application domain requirements in Section 5. The proposed methodology consists of two steps: 1) An unsupervised clique-based clustering of data objects according to well-defined properties. This component aims at finding all groups of highly similar patterns within an object dataset with respect to a single property each time. A domain expert is required to define the possible interesting properties of the dataset. The clusters are formed via the extraction of maximal cliques from a graph. 2) A concepts synthesis process using cliques’ intersections, which can be seen as a data fusion process by which different combinations of dataset properties are computed so as to create higher-level concepts. The clustering in step 1 is not applied directly to the raw datasets but to complex data patterns we derive from it. By “complex pattern”, we mean an aggregated, higherlevel data structure that already represents a certain abstraction of the dataset. A complex pattern is supposed to carry some semantic regarding the measured phenomena. Statistical distributions, for example the geographical distribution
of a sampled population, or the aggregated time series of a dynamic process, are some examples of complex patterns, as opposed to simple numerical or categorical features such as the weight, the color or a stock value. Each such pattern is represented as a node in a graph where every edge represents a similarity relationship between two nodes. A graph-based clustering is then performed via the extraction of cliques, which are complete subgraphs, for all properties identified as potentially relevant by a domain expert. The idea is to create N sets of cliques where the members of each clique share a highly similar characteristic pattern created along one of the N defined properties. Following the clustering process, we synthesize the patterns by combining different sets of cliques. This leads to the creation of meta-groups, which are termed concepts, and where group members have one or more similarity patterns in common. The original cliques are considered as groups of dimension 1. Meta-groups of dimension 2 (resp. 3,. . . , N ) are obtained by combining 2 (resp. 3,. . . , N ) properties. A detailed description of each component of the methodology is provided in the next paragraphs.
3.2. Clique-based Clustering The first component of our knowledge mining methodology involves a graph-theoretic clustering. Typical clustering tasks involve the following steps [17]: i) feature selection and/or extraction, and pattern representation; ii) definition of a similarity measure between patterns; iii) grouping similar patterns; iv) data abstraction (if needed), to provide a compact representation of each cluster; v) the assessment of the clusters quality and coherence (if needed). In any clustering task, we must select certain features characterizing relevant aspects of the dataset, i.e., salient features that may provide meaningful patterns. Those patterns are represented with feature vectors, which are usually built with formatted data series, or simply arrays of values. There are two key aspects in the clustering process herein presented: i) even complex patterns, such as statistical distributions, may be easily used in the clustering algorithm, and ii) the types of features used to create different patterns may (and even should) be quite different, introducing thus a certain diversity in the classification. Once the sets of patterns are created, we need to measure the similarity between two patterns. For that purpose, several types of similarity distances are available (e.g., Mahalanobis, Minkowski, Pearson or Spearman correlations, jackknife correlation, etc.). Clearly, the choice of a similarity metric must be carefully determined in consideration of the original data series and the expected properties of the clusters, such as the cluster size, quality, or consistency. In Section 5, we
present a few similarity measures we use in practice in our domain-specific application. The following step consists in grouping all patterns that look very similar. There exists a plethora of clustering algorithms for doing this. We use here an unsupervised graph-theoretic approach to formulate the problem, and the clustering is then performed by extracting maximal weighted cliques from a graph. To the best of our knowledge, this type of clustering has not been widely covered in previous KDD applications, yet it is in our opinion a convenient and appropriate formulation for solving domain-driven data mining problems, and it has several advantages over other more classical approaches such as K-Means or Bayesian classification, especially when dealing with high-dimensional datasets [15]. A graph is a structure that comprises a set of vertices (or nodes) connected by links called edges, which can be directed or undirected. A clique is defined as an induced sub-graph of a (un)directed graph in which the vertices are fully connected. A clique is maximal if it is not contained within any other clique. Hence, finding the largest group of similar elements in a data set can now be transformed into the problem of searching for complete subgraphs where the vertices represent the patterns, and the links express the similarity relationships between those vertices. This is a classical NP-complete problem studied in graph-theory, also known as the maximal clique problem (MCP) [4]. Because of its NP-hard complexity, many approximate algorithms for solving the MCP have been developed, like local search heuristics, Hopfield network, Ant Colony Optimization, and the heuristic based genetic algorithm, among others. In this clique-based clustering, we use the dominant sets approach of Pavan et al. [28], which proved to be an effective method for finding maximal weighted cliques. This means that the weight of every edge is also taken into consideration by the algorithm, as it seeks to discover maximal cliques whose total weight is maximized. This generalization of the MCP is also known as the maximum weight clique problem (MWCP). This approximate method for solving the MWCP aims at finding iteratively dominant sets of maximally similar nodes in the graph. We can show that dominant sets are equivalent to maximum weighted cliques, but finding those dominant sets is far easier to compute. Indeed, this can be done with a continuous optimization technique, which applies replicator dynamics (from evolutionary game theory). As a result, we can solve the problem of extracting dominant sets by simply making a particular temporal expression converge. Let for instance A be a non-negative real-valued n × n matrix that represents the adjacency matrix of the graph introduced here above, and consider the following dynamical system represented
with its discrete time equation: xi (t + 1) = xi (t) ·
(Ax(t))i , i = 1, ..., n x(t)T Ax(t)
Starting from an arbitrary initial state, this replicator dynamical system will eventually be attracted by the nearest asymptotically stable point. As it has been proven in [28], this corresponds to a dominant set, hence to a maximum weight clique. In our global knowledge discovery process, for the N identified properties, we apply this clique-based clustering on each edge-weighted graph.
3.3. Concepts Synthesis via Cliques Intersections The second component of our methodology is similar to a dynamic data fusion process. Starting from all sets of cliques, the idea is to combine k sets out of the N dimensions, with k = 2, ..., N , in order to discover actionable knowledge about certain phenomena. To introduce this concepts synthesis, let us consider some notions used in Formal Concept Analysis (FCA). There is a strong parallel between our KDD method and FCA, since the cliques, and any combination thereof, can be seen as the formal representation of concepts describing a certain phenomenon (or at least some aspect hereof). In FCA [13], a concept is defined as the combination of both an object cluster, which comprises all objects that share a common subset of attributes, and a property cluster, which is the set of all properties shared by all the object clusters. Let us consider for example a set of objects O = {O1 , . . . , On }, and a set of properties P = {P1 , P2 , . . . , PN } with: P1 = {p1,1 , . . . , p1,k1 }, P2 = {p2,1 , . . . , p2,k2 }, . . . PN = {pN,1 , . . . , pN,kn } The different subsets of patterns {pi,j } correspond to the different feature vectors that are extracted for each property Pi . A basic example of dataset properties and their associated patterns could be as follows: P = {color, shape, nr edges}, and :
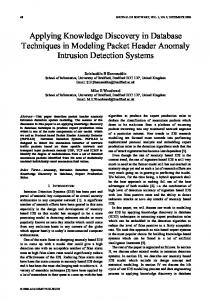
Figure 1. An example of concept lattice, represented with a Hasse diagram. In total, 14 concepts have been constructed via the extraction of maximal cliques (in light grey) from the initial dataset containing 10 objects. In each concept, the first line of the label represents the members of the concept (or the extent), and the second line is the pattern(s) of the concept (or the intent).
of a boolean concept lattice, but we generalize rather to the case of properties characterized by discrete sets of attributes. It is worth noting that, in our domain application, while relevant properties can be defined by a domain expert, the subsets of potential patterns related to those properties (i.e., the {pi,j }) are completely unknown prior the execution of the clique-based clustering. So, the patterns are discovered via the extraction of cliques along each dataset property. The complete set of concepts is called the concept lattice, and it can be represented with a Hasse diagram. This is illustrated in Figure 1 for a simple case of 10 objects characterized by three properties, each containing one or two different patterns. The boxes filled in light grey can be seen here as the initial cliques (i.e., the dimension-1 concepts), which allowed to extract the a priori unknown patterns for each dataset property.
P1 = {blue, red, yellow} P2 = {line, square, circle, ellipse} P3 = {0, 1, 2, 3, 4, 5, others} An example of a dimension 3-concept can be defined as the set of all objects sharing the following (unordered) values for the 3 properties: {red, square, 4}. With this example, we emphasize also the fact that we do not consider the case
Note that there exist many algorithms for generating concept lattices [20], but to the best of our knowledge, our method is the first one that relies on maximal cliques to achieve this goal by discovering a priori unknown intents in a dynamic fashion. Moreover, another advantage is its extensibility. That is, when a practitioner finds a new dataset property to be of interest for the knowledge discovery process, (s)he only needs to include a new set of cliques, inde-
pendently of the existence of previous concepts or cliques. As a result, new combined viewpoints, and thus new formal concepts, are immediately available for assisting the root cause analysis of the phenomena.
4. Honeynet Environment We describe here the specific dataset we used to validate our multi-dimensional data mining methodology. This unique dataset is made of network attack traces and has been collected in the context of the Leurre.com Project [25, 35], a global distributed honeynet. A honeypot is a security resource whose value lies in being probed, attacked, or compromised [40]. Honeypots should have no production value and hence should not see any legitimate traffic or activity. Whatever they capture can then be considered as malicious or at least suspicious. By extension, a network of interconnected honeypots has been termed “honeynet”. Since 2003, a distributed set of identical honeypot platforms, based on honeyd [36], has been deployed in many different countries and on various academic and industrial IP subnets. Recently, a second phase of the project was started with the deployment of high-interaction honeypots based on the ScriptGen [24, 23] technology, in order to enrich the network conversations with the attackers and to intercept code injections, which may lead in some cases to the retrieval of malicious binaries used by the attackers. The Leurre.com dataset is publicly available for any researcher under the condition of a Non-Disclosure Agreement that aims at protecting the privacy of the partners involved in the deployment of those honeypot platforms. A platform runs three virtual honeypots, each one has its own public IP address and they emulate different operating systems (two Windows and one Linux machine) with various common services faking to be open. The collected traffic, including the payloads of the packets, is automatically stored into an Oracle database. The network traces are also enriched with contextual information (geographical location of the attackers, ISP’s, domain names, etc). All IP sources are grouped into so-called attack clusters [31] built according to the network traces they have left when talking to the honeypot. Each such cluster is defined thanks to network characteristics such as the number of virtual machines targeted on a platform by a given IP, the number of packets and bytes sent to each honeypot, the attack duration, the average inter-arrival time between packets, the associated port sequence being probed by the attacker, and the packet payload (when available). Our work builds upon this notion of clusters, as defined in [31], but in the rest of this document, to avoid any ambiguity with our own clique-based clustering technique, we use the expression attack profile or simply attack instead of cluster. In other terms, an attack profile, or attack, consists
of a group of IP addresses that have targeted at least one of the Leurre.com platforms and have left very similar network traces when talking to that platform. In [29], it has been shown that the IPs found in a given attack profile could be linked to distinct attack phenomena happening during successive, limited periods of time on each sensor. In the rest of this paper, we use the terms attack events to refer to the subset of IPs from a given attack profile on a sensor, and observed within a specific time window identified thanks to the method presented in [29]. Namely, the experiments presented in this paper are based on 351 attack events found in a timeframe spanning from September 2006, until June 2008. Those attack events have targeted 36 different sensors, which are located in 20 different countries and spread over 18 subnetworks on the Internet. In this dataset we observed a total of 282,363 distinct sources, distributed over 136 different types of attack profiles.
5. KDD Application for Threats Intelligence Support 5.1. Clique-based Clustering We first present the different properties that we have selected to cluster the attack events together. We motivate this choice based on domain experience in monitoring malicious traffic. Then, for each dimension, we briefly describe how we have applied the clique-based clustering, more specifically: i) which type of patterns (and representation hereof) do we consider, ii) how can we measure the similarities between them, and iii) what are the results in terms of cliques and what type of insights do they deliver. In the last section, we take advantage of cliques’ intersections to synthesize higher-level concepts describing some attack phenomena observed on our sensors. 5.1.1 Geolocalization of Attackers. The geographical location of the attackers can be used to identify attack activities having a specific pattern in terms of originating countries. Such information can be important to identify, for instance, botnets that are located in a limited number of countries. It is also a way to confirm the existence, or not, of so-called safe harbors for the hackers.
Patterns Selection. For every attack event, we generate a feature vector that represents the attacking sources’ distribution of all IPs found in that attack event, grouped by country of origin (in absolute values). Concretely, for each attack event, we build an histogram whose elements are labeled with the ISO 3166-1 country codes and we identify how many source IPs belong to each country (Figure 2-Left illustrates such a geographical pattern).
Distance Metric for Frequency Data. To measure how similar two attack events are, with respect to that specific property, we need an appropriate distance metric. In this case, we rely on non-parametric statistical tests to compare those empirical distributions (i.e., the histograms). In our application, for each pair of distributions, we use a combination of three different statistical tests to obtain the distance: first, we compute the maximal p-value according to the Pearson’s χ2 test and the Kolmogorov-Smirnov (KS) test, and secondly we validate this result with the KullbackLeibler divergence. χ2 and Kolmogorov-Smirnov are among the most commonly used non-parametric statistical methods for testing the null hypothesis (H0) that the frequency distribution of certain observations of a sample is consistent with a particular hypothesized distribution (also called a test of “goodness of fit”). In other words, those tests are used to determine whether two underlying one-dimensional probability distributions differ in a significant way. The output of both tests is a p-value, which is compared against a given significance level to decide if the investigator can safely reject the null hypothesis. Low probability values lead to the rejection of H0. Inversely, p-values that are largely above the significance level can be interpreted as an indication of a very strong relationship between the two samples, which means that both samples are very likely coming from the same population. From our observations, the p-values given by both tests (χ2 and Kolmogorov-Smirnov) are usually very close to each other. Still, under certain circumstances, they can also differ substantially. To solve this issue, we validate the significance of the obtained p-values by computing the Kullback-Leibler divergence (also known as the relative entropy [19]) between both distributions. When this divergence tends to be large, we set the similarity value to zero, whatever the result of χ2 or KS might be; otherwise we keep the maximal p-value as measurement as the similarity degree between the two patterns. This technique appears to be, at least for the datasets we deal with, a quite robust and reliable metric for comparing categorical frequency data. Geographical Cliques. Running the clique-based clustering on the initial dataset of 351 attack events delivers 45 cliques containing between 2 and 23 attack events. In total, 273 attack events (77%) have been classified into those cliques, accounting for 66% of the total volume of sources. The largest cliques contain about twenty different attack events having exactly the same geographical distribution. From those results, we observe that geographical cliques provide good indications of the prevalence of certain countries to be involved in different specific activities (e.g., US, China, Canada, Korea, Taiwan, Italy, France, Germany, Great-Britain, Brasil, Japan and Russia). Moreover, geo-
graphical cliques can be useful to identify communities of machines used to perform a given type of activity. Surprisingly enough, we observe also groups of targeted attacks coming from rather small or unexpected countries, such as Poland, Hungary, Romania, Pakistan, Argentina or India1 .
Figure 2. Left: the pattern of a geographical clique of attack events. Right: the pattern of a subnets clique (the labels are the anonymized /8 subnets). All attack events belonging to a same clique have the very same pattern.
Figure 3. The pattern of a platforms clique of attack events, in which all events have a distribution similar to this one (regarding the targeted platforms in this case).
5.1.2 Netblocks of Origin. The source IP network block is another property that nicely complements the geolocation as described before. Instead of giving insight on possible geostrategic decisions made by the hackers, they can typically reveal some strategies in the propagation model of the malwares. Indeed, attackers’ IP subnets can provide a good indication of the spatial “uncleanliness” of certain networks, i.e., the tendency for compromised hosts to stay clustered within unclean networks, especially for zombie machines belonging to botnets as demonstrated in [7]. Previous studies have also demonstrated that some worms show a clear bias in their propagation scheme, such as a tendency 1 More details about the cliques can be found in an extended technical report available from the Eurecom website (http://www.eurecom.fr/people/dacier.en.htm).
for scanning machines of the same (or nearby) network so as to optimize their propagation [6]. So, for each attack event, we create a feature vector representing the distribution of IP addresses grouped by considering the /8 subnet (which means the first 8-bytes prefix of each IP address). An example of such vector, obtained for a given clique of attack events, is given in Figure 2 (Right). Since we have signed a non-disclosure agreement, we have changed the subnet values while maintaining, as much as possible, the relationships between the discovered netblocks (e.g., consecutive subnets values). As explained in the previous section, we can use the same statistical distances to measure the similarity degree between a pair of subnets histograms. Subnets Cliques. From the output of the clique-based clustering applied to the subnets dimension, we obtain about 30 cliques; they contain in total 262 attack events (75% of the dataset) accounting for 56% of the total volume of sources. A few cliques are fairly large: about fifty attack events grouped in the same clique and having all the very same subnet distribution. Here also, we observe again many relevant relationships within the attack dataset regarding this dimension. For example, the characteristics of some of those cliques (e.g., the targeted port sequences, etc.), and an additional in-depth analysis, have lead us to conclude that the sources involved in those cliques were apparently members of a larger botnet that has been active during an extended period of time (about three months) in a given Internet region. Those subnets cliques revealed also a sort of dynamism in the affected IP regions (due to new bot infections and computers cleaning) during the lifetime of the botnet, with still some stable clustered IP zones of bot infected machines (i.e., in “unclean networks”). 5.1.3 Attack Time Series. Time series analysis can also provide useful information about the underlying attack phenomena [41]. By “attack time series” we mean an aggregated source count for an attack on a given sensor, in a given timeframe. This dataset property can provide indications about synchronized activities targeting different sensors. It can also reveal some typical pattern related to a botnet activity [9]. Finally, discovering synchronized probes on completely different TCP ports (and thus, a priori unrelated attacks) might help to identify multi-headed worms [29], which combine different exploits in a single piece of software. To include this attack dimension, we have created, for each attack event, a feature vector where each element represents the aggregated source count per day for that specific attack on a given sensor. There are numerous appropriate techniques to compute the similarity between time series, such as singular value decomposition (SVD), piecewise aggregate approximation (PAA), discrete Fourier transform,
wavelets, etc. The method we use in this application is an adapted version of SAX (symbolic aggregate approximation) [26]. It falls in the category of PAA techniques which tend to approximate time series by segmenting them into time intervals of equal size and summarizing each of these intervals by its mean value. Each time series (usually of complex shape) is thus replaced by a quantized vector of symbolic values whose shape is by far simpler to process when measuring the similarities among time series. Moreover, SAX provides a lower-bounding distance measure that is easy to interpret, and which can be used in the clustering to decide if two time series are similar or not. More details about the SAX technique can be found in [26], and we refer the interested reader to [41] for a more detailed description of our SAX adaptation. Cliques of Time Series. The clique-based clustering applied to the 351 events delivered 82 cliques of time series encompassing 92% of the attacking sources, which already confirms the highly organized aspect of activities related to Internet attacks. As noted in [41, 29], we observe only three types of temporal pattern in the resulting cliques: (i) a few “voluminous” cliques containing attacks with a continuous activity pattern, primarily due to Messenger Spammers (on UDP ports 1026-1028) and some classical network worms (e.g., Allaple, Slammer, etc.); (ii) cliques involving attacks in the form of sustained bursts, mainly due to large botnet attack waves or multi-headed worms; and (iii) a very large number of small cliques related to ephemeral attacks targeting one or a few sensors on the same day, due either to small botnet probes, targeted scan activities or misconfigurations in some rare cases. Figure 4 illustrates the pattern of a clique of the second type, where 21 attack events have targeted 5 different sensors on well-known Windows ports (445T and 139T) for a period of 20 days in December 2006. Even though they target different IP subnets, all those attack events exhibit a quite perfect synchronization. In the light of our detailed analyses, this was attributed to an attack wave of a botnet coming mainly from China, Canada and US. 5.1.4 Targeted Platforms. Apparently, some recent crimeware toolkits are now able to deliver a specific type of malware to different geographical regions [5]. By using this new feature, cybercriminals can thus set up well targeted campaigns by delivering specialized crimeware in specific geographical regions. Indeed, malware may benefit from being adapted to, e.g., the local version of an operating system or application. Therefore, it seems important to look at relationships that may exist between attack events and the platforms they have been observed on. Attack events are defined per platform. To calculate a feature vector representing the distribution of platforms, we decided to group all strongly correlated attack events within
5.2. Concepts Synthesis
Figure 4. The patterns of an extracted clique of attack time series targeting Windows ports and ICMP (I, I-445T, I-445T-139T). Note the almost perfect synchronization of the attacks on 5 different sensors located in 4 different IP subnets.
its time window of existence, and we then used this group of attack events to create the feature vector representing the proportion of platforms that have been targeted. Fig 3 illustrates the kind of pattern we are looking for in this dimension. Here again, we can use the statistical distance measures introduced previously (in Section 5.1.1) to compare two frequency distributions.
Platforms Cliques. The experiments indicate that 284 events (encompassing 70% of the sources) could be clustered into only 17 cliques for this dimension. According to our in-depth analysis, those cliques helped to discover some nice phenomena too. One such example is related to a large series of ephemeral attack events on high (unusual) TCP ports that were always launched against the very same platform, and where each individual attack event had a quite high intensity but a very short duration (one or two days). A security analyst would most probably disregard such suspicious traffic since each traffic peak is targeting a quite unusual TCP port (on which there is no well-known application running), and unlike worm propagation, those attack events do not sustain an activity over a long period of time. So, without this platform viewpoint, it would be actually very hard to get a global overview of such long-term and stealthy phenomenon. Another finding related to this viewpoint is that several groups of platforms seem to be targeted in a very similar way (thus, by coordinated sources), probably because of their IP proximity, and this hostile traffic represents, in total, a significant volume (70%).
So far, we have created N sets of cliques, i.e., one set of cliques for each relevant attack property. As suggested here above, each clique pattern can hold a piece of actionable knowledge about an attack phenomenon, but in some cases the security analyst will have to synthesize different pieces of evidence in order to perform a root causes analysis, and to really understand what happened. Therefore, we can take advantage of all one-dimensional cliques to construct higher-level concepts by simply computing cliques’ intersections. Based on the type of phenomenon under scrutiny, the practitioner may include any number of properties in order to create concepts containing more or less semantic meaning. Moreover, those concepts have by construction some relationships with other super- or sub-concepts (from a lower/higher combination level), so a concept lattice can be built dynamically to represent the connections between those different concepts describing certain phenomena. Based on the initial sets of cliques obtained via the clique-based clustering, we have computed the total number of combinations that could, in theory, be derived from those dimension-1 concepts. As this is essentially a combinatorial problem, the theoretical number of combinations grows very quickly, even with as few as 4 dimensions. Indeed, more than 2 millions combinations could exist in theory, based on the number of cliques we have obtained. In practice though, we observe that the number of concepts synthesized at each level is not excessive, and in total we obtain only 0.04% of the theoretical number of combinations. This indicates also that the selected attack properties are not equally distributed and thus seem to carry some meaningful semantics on the observed phenomena, since many cliques’ combinations are empty. While the analysis of raw network traces (composed of millions of packets) on each sensor would definitively be impractical, now we observe that the analysis of those concepts can easily provide a more global insight into the real-world phenomena that have caused the attack traffic. To illustrate this, we provide two such examples here under. Attack concepts analysis - Two case-studies. Table 1 gives an overview of three interesting concepts. The first two concepts belong to the dimension 4 whereas the last one is of dimension 2. Concepts 1 and 2 justify our initial design choice which was to use attack events, as opposed to attack profiles, for the atomic objects of our datasets. These two concepts are made of nine attack events, each. These nine attack events belong to the same type of attack profile observed over consecutive periods of time. In fact, it is as if we were observing two consecutive waves of the same attack against the same set of targets. The first wave lasts for 30 days in Febru-
Id
Dim.
Nr Events (Extent)
1
4
9
2
4
9
3
2
48
Date (duration) 2008-01-20 (30 days) 2008-03-11 (7 days) 2006-09-21 (262 days)
Time Series p.m. p.m.
p.m.
Platforms distri. 32,21,27,61,59, 49,48,80,63 32,21,27,61,59, 49,48,80,63 50
Patterns (intent) Geographical distri
Subnets distri
Nr Sources
Port Sequences 5900T (VNC)
HU,PL,FR,BR
86,84,85,90,83,87,89,203
880
KR,US,CA,DE
123,89,87,61,90,91,213,222
3,456
5900T (VNC)
12,305
9763T, 15264T, 29188T, 6134T, 6769T, 7690T 1755T, 50656T, 64264T, 32878T, 64783T, 18462T, 4152T, 25083T, 9661T, 25618T, 28238T, 38009T, 53842T, 64697T, 46030T
87,82,83,84,151, 80,81,85,213,others
-
Table 1. Some examples of concepts obtained at different semantic levels (the real subnets of origin have been anonymized).
ary while the second starts in March and lasts for only seven days. One could be tempted to consider these two waves as part of a single phenomenon. If that was the case, relaxing the constraint on the time series analysis, i.e. inspecting dimension-3 concepts, would result in having those various attack events ending up in the same concept. This is not what happens. Indeed, the geographical distribution and the subnet distributions also differ between these two concepts. In other terms, even if the modus operandi as well as the targets appeared to be the same, the origins were clearly different. Figuring out if this can be explained by two different botnets being controlled by the same entity or two distinct entities using the same tool lies outside the scope of this paper as it pertains to forensics activities. What matters here is that the approach revealed simply and clearly an important element that can help in the understanding of the observed phenomena.
The second case, illustrated with the concept 3 in Table 1, justifies our motivation to look not only at all dimension-1 and dimension-N concepts, but also to analyze the concepts obtained in between, as there are also phenomena that can emerge at those intermediary semantic levels. There are 48 events involved in concept 3, and all of them have targeted the very same sensor (located in China) at different dates, in the form of very ephemeral spikes of activity, and now they all seem to originate from the same IP netblocks. By raising the dimensional level, this phenomenon would not appear as clearly since the events’ time series are not correlated. The events involved in this concept could at first sight appear as Internet noise; but now, a new type of phenomenon clearly emerges. Since it has lasted for at least 262 days, it is quite unlikely that it is due to a pure random process or to background noise. At this stage, there is no obvious reason that could further explain the intent of this fairly large community of machines (12,305 sources), and more viewpoints are probably needed to refine our concept-based root cause analysis. However, those simple examples demonstrate that our technique can effectively highlight stealthier phenomena that would otherwise stay hidden in the Internet background noise.
6. Conclusions The global analysis of Internet threats is clearly a complex but critical problem, and thus appropriate analysis methods are required in order to effectively get insights into the modus operandi of new emerging attack phenomena. In this work, we have presented a multi-dimensional knowledge discovery and data mining method that can help us to improve our understandings of new Internet threats. Our method consists in (i) extracting meaningful nuggets of knowledge by mining a complex dataset according to different properties considered as relevant; and in (ii) synthesizing those pieces of knowledge at different dimensional levels, so as to create a concept lattice that can best describe real-world phenomena for a domain expert. An experimental validation on real-world attack traces has shown that significant insights can be obtained into the threats intelligence domain thanks to this approach. The analysis of the concepts has revealed the importance of finding the appropriate association of concepts to understand the underlying phenomena. As future work, we seek to develop algorithms and heuristics that can take advantage of the concept lattice to highlight systematically all relevant attack phenomena found at different dimensional levels. The objective is to further improve the concept-based root cause analysis, and, more importantly, to facilitate the work of the security analyst.
References [1] P. Baecher, M. Koetter, T. Holz, M. Dornseif, and F. Freiling. The nepenthes platform: An efficient approach to collect malware. In Proceedings of the 9th International Symposium on Recent Advances in Intrusion Detection (RAID), 2006. [2] D. Barbar`a, J. Couto, S. Jajodia, L. Popyack, and N. Wu. Adam: A testbed for exploring the use of data mining in intrusion detection. In ACM SIGMOD Record, 30(4), pages 15–24, 2001. [3] D. Barbar´a and S. Jajodia, editors. Applications of Data Mining in Computer Security, volume 6 of Advances in Information Security, chapter Data Mining For Intrusion Detection - A Critical Review. Springer, 2002. [4] I. Bomze, M. Budinich, P. Pardalos, and M. Pelillo. The maximum clique problem. In Handbook of Combinatorial Optimization, volume 4. Kluwer Academic Publishers, Boston, MA, 1999.
[5] Finjan Malicious Code Research Center. Web security trends report q1/2008, http://www.finjan.com/content.aspx?id=827, sep 2008. [6] Z. Chen, L. Gao, and K. Kwiat. Modeling the spread of active worms. In Proceedings of IEEE INFOCOM, 2003. [7] M. P. Collins, T. J. Shimeall, S. Faber, J. Janies, R. Weaver, M. De Shon, and J. Kadane. Using uncleanliness to predict future botnet addresses. In IMC ’07: Proceedings of the 7th ACM SIGCOMM conference on Internet measurement, pages 93–104, New York, NY, USA, 2007. ACM. [8] SRI International Cyber-TA Honeynet Project. ta.org/honeynet, [july 2008].
www.cyber-
[9] D. Dagon, C. Zou, and W. Lee. Modeling botnet propagation using time zones. In Proceedings of the 13th Annual Network and Distributed System Security Symposium (NDSS’06), February 2006. [10] H. Debar and A. Wespi. Aggregation and correlation of intrusiondetection alerts. In RAID ’00: Proceedings of the 4th International Symposium on Recent Advances in Intrusion Detection, pages 85– 103, London, UK, 2001. Springer-Verlag. [11] DShield. http://www.dshield.org, sep 2008. [12] J. Franklin, V. Paxson, A. Perrig, and S. Savage. An inquiry into the nature and causes of the wealth of internet miscreants. In CCS ’07: Proceedings of the 14th ACM conference on Computer and communications security, pages 375–388, New York, NY, USA, 2007. ACM. [13] B. Ganter, G. Stumme, and R. Wille. Formal Concept Analysis: Foundations and Applications. Lecture Notes in Artificial Intelligence, no. 3626, Springer-Verlag, 2005. [14] G. Gu, R. Perdisci, J. Zhang, and W. Lee. BotMiner: Clustering analysis of network traffic for protocol- and structure-independent botnet detection. In Proceedings of the 17th USENIX Security Symposium, 2008. [15] E-H. Han, G. Karypis, V. Kumar, , and B. Mobasher. Clustering in a high-dimensional space using hypergraph models. Technical report, Department of Computer Science, University of Minnesota, 1997.
[24] C. Leita, K. Mermoud, and M. Dacier. Scriptgen: an automated script generation tool for honeyd. In Proceedings of the 21st Annual Computer Security Applications Conference, 2005. [25] C. Leita, V.H. Pham, O. Thonnard, E. Ramirez-Silva, F. Pouget, E. Kirda, and Dacier M. The Leurre.com Project: Collecting Internet Threats Information Using a Worldwide Distributed Honeynet. In Proceedings of the WOMBAT Workshop on Information Security Threats Data Collection and Sharing, WISTDCS 2008. IEEE Computer Society press, April 2008. [26] J. Lin, E. Keogh, S. Lonardi, and B. Chiu. A symbolic representation of time series, with implications for streaming algorithms. In Proceedings of 8th ACM SIGMOD workshop on Research Issues in data mining and knowledge discovery, California, USA, 2003. [27] D. Moore, C. Shannon, G.M. Voelker, and S. Savage. Network telescopes: Technical report. CAIDA, April, 2004. [28] M. Pavan and M. Pelillo. A new graph-theoretic approach to clustering and segmentation. In Proceedings of IEEE Conference on Computer Vision and Pattern Recognition, 2003. [29] V. Pham, M. Dacier, G. Urvoy Keller, and T. En Najjary. The quest for multi-headed worms. In DIMVA 2008, 5th Conference on Detection of Intrusions and Malware & Vulnerability Assessment, July, 2008, Paris, France, Jul 2008. [30] F. Pouget. Distributed system of honeypot sensors : Discrimination and correlative analysis of attack processes. PhD thesis, Ecole Nationale Sup´erieure des T´el´ecommunications (ENST), Paris., 2006. [31] F. Pouget and M. Dacier. Honeypot-based forensics. In AusCERT2004, AusCERT Asia Pacific Information technology Security Conference 2004, 23rd - 27th May 2004, Brisbane, Australia, 2004. [32] F. Pouget, M. Dacier, J. Zimmerman, A. Clark, and G. Mohay. Internet attack knowledge discovery via clusters and cliques of attack traces. Journal of Information Assurance and Security, Volume 1, Issue 1, March, 2006. [33] Team Cymru Darknet Project. http://www.cymru.com/darknet/, [july 2008].
[16] Y. Huang, H. Xiong, W. Wu, and Z. Zhang. A hybrid approach for mining maximal hyperclique patterns. IEEE International Conference on Tools with Artificial Intelligence (ICTAI), 0:354–361, 2004.
[34] The Honeynet Project. http://www.honeynet.org, [july 2008].
[17] A.K. Jain and R.C. Dubes. Algorithms for Clustering Data. PrenticeHall advanced reference series, 1988.
[36] N. Provos. A virtual honeypot framework. In Proceedings of the 13th USENIX Security Symposium, 2004.
[18] K. Julisch and M. Dacier. Mining intrusion detection alarms for actionable knowledge. In Proceedings of the 8th ACM International Conference on Knowledge Discovery and Data Mining, 2002.
[37] M. Abu Rajab, J. Zarfoss, F. Monrose, and A. Terzis. A multifaceted approach to understanding the botnet phenomenon. In IMC ’06: Proceedings of the 6th ACM SIGCOMM conference on Internet measurement, pages 41–52, New York, NY, USA, 2006. ACM.
[19] S. Kullback and R. A. Leibler. On information and sufficiency. Annals of Mathematical Statistics 22: 79-86., 1951. [20] S. Kuznetsov and S. Obiedkov. Algorithms for the construction of concept lattices and their diagram graphs. In PKDD ’01: Proceedings of the 5th European Conference on Principles of Data Mining and Knowledge Discovery, pages 289–300, London, UK, 2001. Springer-Verlag. [21] W. Lee and S. J. Stolfo. Combining knowledge discovery and knowledge engineering to build IDSs. In RAID ’99: Proceedings of the 3th International Symposium on Recent Advances in Intrusion Detection, 1999.
[35] The Leurre.com Project. http://www.leurrecom.org, [july 2008].
[38] J. Riordan, D. Zamboni, and Y. Duponchel. Building and deploying billy goat, a worm-detection system. In Proceedings of the 18th Annual FIRST Conference, 2006. [39] Internet Motion Sensor. http://ims.eecs.umich.edu/, [july 2008]. [40] L. Spitzner. Honeypots: Tracking Hackers. Addison-Wesley, 2002. [41] O. Thonnard and M. Dacier. A framework for attack patterns’ discovery in honeynet data. Journal of Digital Investigation, 5S:S128– S139, 2008. [42] T. Werner. Honeytrap. http://honeytrap.mwcollect.org/, [july 2008].
[22] W. Lee, S.J. Stolfo, and K.W. Mok. A data mining framework for building intrusion detection models. In Proceedings of the 1999 IEEE Symposium on Security and Privacy, pages 120–132, 1999.
[43] H. Xiong, Pang-Ning Tan, and V. Kumar. Hyperclique pattern discovery. Data Mining and Knowledge Discovery Journal, 13(2):219– 242, 2006.
[23] C. Leita and M. Dacier. Sgnet: a worldwide deployable framework to support the analysis of malware threat models. In Proceedings of the 7th European Dependable Computing Conference (EDCC 2008), 2008.
[44] V Yegneswaran, P Barford, and V Paxson. Using honeynets for internet situational awareness. In Fourth ACM Sigcomm Workshop on Hot Topics in Networking (Hotnets IV), 2005.