1
arXiv:1503.08479v1 [cs.CR] 29 Mar 2015
Active Authentication on Mobile Devices via Stylometry, Application Usage, Web Browsing, and GPS Location Lex Fridman∗ , Steven Weber† , Rachel Greenstadt† , Moshe Kam‡ ∗ Massachusetts Institute of Technology
[email protected] † Drexel University {sweber@coe, greenie@cs}.drexel.edu ‡ New Jersey Institute of Technology
[email protected]
Abstract—Active authentication is the problem of continuously verifying the identity of a person based on behavioral aspects of their interaction with a computing device. In this study, we collect and analyze behavioral biometrics data from 200 subjects, each using their personal Android mobile device for a period of at least 30 days. This dataset is novel in the context of active authentication due to its size, duration, number of modalities, and absence of restrictions on tracked activity. The geographical colocation of the subjects in the study is representative of a large closed-world environment such as an organization where the unauthorized user of a device is likely to be an insider threat: coming from within the organization. We consider four biometric modalities: (1) text entered via soft keyboard, (2) applications used, (3) websites visited, and (4) physical location of the device as determined from GPS (when outdoors) or WiFi (when indoors). We implement and test a classifier for each modality and organize the classifiers as a parallel binary decision fusion architecture. We are able to characterize the performance of the system with respect to intruder detection time and to quantify the contribution of each modality to the overall performance. Index Terms—Multimodal biometric systems, insider threat, intrusion detection, behavioral biometrics, decision fusion, active authentication, stylometry, GPS location, web browsing behavior, application usage patterns
I. I NTRODUCTION According to a 2013 Pew Internet Project study of 2076 people [1], 91% of American adults own a cellphone. Increasingly, people are using their phones to access and store sensitive data. The same study found that 81% of cellphone owners use their mobile device for texting, 52% use it for email, 49% use it for maps (enabling location services), and 29% use it for online banking. And yet, securing the data is often not taken seriously because of an inaccurate estimation of risk as discussed in [2]. In particular, several studies have shown that a large percentage of smartphone owners do not lock their phone: 57% in [3], 33% in [4], 39% in [2], and 48% in this study. Active authentication is an approach of monitoring the behavioral biometric characteristics of a user’s interaction with the
device for the purpose of securing the phone when the pointof-entry locking mechanism fails or is absent. In recent years, continuous authentication has been explored extensively on desktop computers, based either on a single biometric modality like mouse movement [5] or a fusion of multiple modalities like keyboard dynamics, mouse movement, web browsing, and stylometry [6]. Unlike physical biometric devices like fingerprint scanners or iris scanners, these systems rely on computer interface hardware like the keyboard and mouse that are already commonly available with most computers. In this paper, we consider the problem of active authentication on mobile devices, where the variety of available sensor data is much greater than on the desktop, but so is the variety of behavioral profiles, device form factors, and environments in which the device is used. Active authentication is the approach of verifying a user’s identity continuously based on various sensors commonly available on the device. We study four representative modalities of stylometry (text analysis), application usage patterns, web browsing behavior, and physical location of the device. These modalities were chosen, in part, due to their relatively low power consumption. In the remainder of the paper these four modalities will be referred to as TEXT , APP , WEB , and LOCATION , respectively. We consider the trade-off between intruder detection time and detection error as measured by false accept rate (FAR) and false reject rate (FRR). The analysis is performed on a dataset collected by the authors of 200 subjects using their personal Android mobile device for a period of at least 30 days. To the best of our knowledge, this dataset is the first of its kind studied in active authentication literature, due to its large size [7], the duration of tracked activity [8], and the absence of restrictions on usage patterns and on the form factor of the mobile device. The geographical colocation of the participants, in particular, makes the dataset a good representation of an environment such as a closed-world organization where the unauthorized user of a particular device will most likely come from inside the organization. We propose to use decision fusion in order to asynchronously
2
integrate the four modalities and make serial authentication decisions. While we consider here a specific set of binary classifiers, the strength of our decision-level approach is that additional classifiers can be added without having to change the basic fusion rule. Moreover, it is easy to evaluate the marginal improvement of any added classifier to the overall performance of the system. We evaluate the multimodal continuous authentication system by characterizing the error rates of local classifier decisions, fused global decisions, and the contribution of each local classifier to the fused decision. The novel aspects of our work include the scope of the dataset, the particular portfolio of behavioral biometrics in the context of mobile devices, and the extent of temporal performance analysis. The remainder of the paper is structured as follows. In §II, we discuss the related work on multimodal biometric systems, active authentication on mobile devices, and each of the four behavioral biometrics considered in this paper. In §III, we discuss the 200 subject dataset that we collected and analyzed. In §IV, we discuss four biometric modalities, their associated classifiers, and the decision fusion architecture. In §V, we present the performance of each individual classifier, the performance of the fusion system, and the contribution of each individual classifier to the fused decisions. II. R ELATED W ORK
approach is that an arbitrary number of classifiers can be added without re-training the classifiers already in the system. This modular design allows for multiple groups to contribute drastically different classification schemes, each lowering the error rate of the global decision.
B. Mobile Active Authentication With the rise of smartphone usage, active authentication on mobile devices has begun to be studied in the last few years. The large number of available sensors makes for a rich feature space to explore. Ultimately, the question is the one that we ask in this paper: what modality contributes the most to a decision fusion system toward the goal of fast, accurate verification of identity? Most of the studies focus on a single modality. For example, gait pattern was considered in [7] achieving an EER of 0.201 (20.1%) for 51 subjects during two short sessions, where each subject was tasked with walking down a hallway. Some studies have incorporated multiple modalities. For example, keystroke dynamics, stylometry, and behavioral profiling were considered in [13] achieving an EER of 0.033 (3.3%) from 30 simulated users. The data for these users was pieced together from different datasets. To the best of our knowledge, the dataset that we collected and analyzed is unique in all its key aspects: its size (200 subjects), its duration (30+ days), and the size of the portfolio of modalities that were all tracked concurrently with a synchronized timestamp.
A. Multimodal Biometric Systems The window of time based on which an active authentication system is tasked with making a binary decision is relatively short and thus contains a highly variable set of biometric information. Depending on the task the user is engaged in, some of the biometric classifiers may provide more data than others. For example, as the user chats with a friend via SMS, the text-based classifiers will be actively flooded with data, while the web browsing based classifiers may only get a few infrequent events. This motivates the recent work on multimodal authentication systems where the decisions of multiple classifiers are fused together [9]. In this way, the verification process is more robust to the dynamic nature of human-computer interaction. The current approaches to the fusion of classifiers center around max, min, median, or majority vote combinations [10]. When neural networks are used as classifiers, an ensemble of classifiers is constructed and fused based on different initialization of the neural network [11]. Several active authentication studies have utilized multimodal biometric systems but have all, to the best of our knowledge: (1) considered a smaller pool of subjects, (2) have not characterized the temporal performance of intruder detection, and (3) have shown overall significantly worse performance than that achieved in our study. Our approach in this paper is to apply the Chair-Varshney optimal fusion rule [12] for the combination of available multimodal decisions. The strength of the decision-level fusion
C. Stylometry, Web Browsing, Application Usage, Location Stylometry is the study of linguistic style. It has been extensively applied to the problems of authorship attribution, identification, and verification. See [14] for a thorough summary of stylometric studies in each of these three problem domains along with their study parameters and the resulting accuracy. These studies traditionally use large sets of features (see Table II in [15]) in combination with support vector machines (SVMs) that have proven to be effective in high dimensional feature space [16], even in cases when the number of features exceeds the number of samples. Nevertheless, with these approaches, often more than 500 words are required in order to achieve adequately low error rates [17]. This makes them impractical for the application of real-time active authentication on mobile devices where text data comes in short bursts. While the other three modalities are not well investigated in the context of active authentication, this is not true for stylometry. Therefore, for this modality, we don’t reinvent the wheel, and implement the n-gram analysis approach presented in [14] that has been shown to work sufficiently well on short blocks of texts. Web browsing, application usage, and location have not been studied extensively in the context of active authentication. The following is a discussion of the few studies that we are aware of. Web browsing behavior has been studied for the purpose of understanding user behavior, habits, and interests [18]. Web browsing as a source for behavioral biometric data was
3
III. DATASET The dataset used in this work contains behavioral biometrics data for 200 subjects. The collection of the data was carried out by the authors over a period of 5 months. The requirements of the study were that each subject was a student or employee of Drexel University and was an owner and an active user of an Android smartphone or tablet. The number of subjects with each major Android version and associated API level are listed in Table I. Nexus 5 was the most popular device with 10 subjects using it. Samsung Galaxy S5 was the second most popular device with 6 subjects using it. Android Version 4.4 4.1 4.3 4.2 4.0.4 2.3.6 4.0.3 2.3.5 2.2
API Level 19 16 18 17 15 10 15 10 8
Subjects 143 16 15 9 5 4 3 3 2
TABLE I: The Android version and API level of the 200 devices that were part of the study. A tracking application was installed on each subject’s device and operated for a period of at least 30 days until the subject came in to approve the collected data and get the tracking application uninstalled from their device. The following data modalities were tracked with 1-second resolution: •
Text typed via soft keyboard.
•
Apps visited.
•
Websites visited.
•
Location (based on GPS or WiFi).
The key characteristics of this dataset are its large size (200 users), the duration of tracked activity (30+ days), and the geographical colocation of its participants in the Philadelphia area. Moreover, we did not place any restrictions on usage patterns, on the type of Android device, and on the Android OS version (see Table I). There were several challenges encountered in the collection of the data. The biggest problem was battery drain. Due to
the long duration of the study, we could not enable modalities whose tracking proved to be significantly draining of battery power. These modalities include front-facing video for eye tracking and face recognition, gyroscope, accelerometer, and touch gestures. Moreover, we had to reduce GPS sampling frequency to once per minute on most of the devices. Event Text App Web Location
Frequency 23,254,478 927,433 210,322 143,875
TABLE II: The number of events in the dataset associated with each of the four modalities considered in this paper. A TEXT event refers to a single character entered on the soft keyboard. An APP events refers to a new app receiving focus. A WEB event refers to a new url entered in the url box. A LOCATION event refers to a new sample of the device location either from GPS or WiFi. Table II shows statistics on each of the four investigated modalities in the corpus. The table contains data aggregated over all 200 users. The “frequency” here is a count of the number of instances of an action associated with that modality. As stated previously, the four modalities will be referred to as TEXT , APP , WEB , and “location.” For TEXT , the action is a single keystroke on the soft keyboard. For APP, the action is opening or bringing focus to a new app. For WEB, the action is visiting a new website. For LOCATION, no explicitly action is taken by the user. Rather, location is sampled regularly at intervals of 1 minute when GPS is enabled. As Table II suggests, TEXT events fire 1-2 orders of magnitude more frequently than the other three. 600
Duration of Active Interaction (Hours)
considered in [19] to achieve average identification FAR/FRR of 0.24 (24%) on a dataset of 14 desktop computer users. Application usage was considered in [8], where cellphone data (from 2004) from the MIT Reality Mining project [20] was used to achieve 0.1 (10%) EER based on a portfolio of metrics including application usage, call patterns, and location. Application usage and movements patterns have been studied as part of behavioral profiling in cellular networks [8], [21], [22]. However, these approaches use position data of lower resolution in time and space than that provided by GPS on smartphones. To the best of our knowledge, GPS traces have not been utilized in literature for continuous authentication.
500
400
300
200
100
0
200 Users (Ordered from Least to Most Active)
Fig. 1: The duration of time (in hours) that each of the 200 users actively interacted with their device.. The data for each user is processed to remove idle periods when the device is not active. The threshold for what is considered an idle period is 5 minutes. For example, if the time between event A and event B is 20 minutes, with no other events in between, this 20 minutes is compressed down to 5 minutes. The date and time of the event are not changed but the timestamp used in dividing the dataset for training and testing (see §V-A) is updated to reflect the new time between event A and event B. This compression of idle times is performed
4
in order to regularize periods of activity for cross validation that utilizes time-based windows as described in §V-A. The resulting compressed timestamps are referred to as “active interaction”. Fig. 1 shows the duration (in hours) of active interaction for each of the 200 users ordered from least to most active. Table III shows three top-20 lists: (1) the top-20 apps based on the amount of text that was typed inside each app, (2) the top20 apps based on the number of times they received focused, and (3) the top-20 website domains based on the number of times a website associated with that domain was visited. These are aggregate measures across the dataset intended to provide an intuition about its structure and content, but the top-20 list is the same as that used for the the classifier model based on the WEB and APP features in §IV.
each modality, and the classifiers that were used to map these features into binary decision space. A binary classifier is constructed for each of the 200 users and 4 modalities. In total, there are 800 classifiers, each producing either a probability that a user is valid P (H1 ) (or a binary decision of 0 (invalid) or 1 (valid). The first class (H1 ) for each classifier is trained on the valid user’s data and the second class (H0 ) is trained on the other 199 users’ data. The training process is described in more detail in §V-A. For APP, WEB, and LOCATION, the classifier takes a single instance of the event and produces a probability. For multiple events of the same modality, the set of probabilities is fused across time using maximum likelihood: H ∗ = argmax
Y
P (xt |Hi ),
(1)
i∈{0,1} x ∈Ω t
where Ω = {xt |Tcurrent − T (xt ) ≤ ω}, ω is a fixed window size in seconds, T (xt ) is the timestamp of event xt , and Tcurrent is the current timestamp. The process of fusing classifier scores across time is illustrated in Fig. 3.
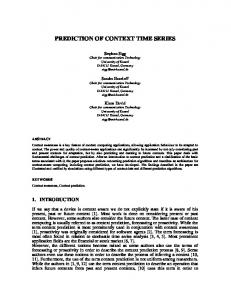
Fig. 2: An aggregate heatmap showing a selection from the dataset of GPS locations in the Philadelphia area. Fig. 2 shows a heat map visualization of a selection from the dataset of GPS locations in the Philadelphia area. The subjects in the study resided in Philadelphia but traveled all over United States and the world. There are two key characteristics of the GPS location data. First, it is relatively unique to each individual even for people living in the same area of a city. Second, outside of occasional travel, it does not vary significantly from day to day. Human beings are creatures of habit, and in as much as location is a measure of habit, this idea is confirmed by the location data of the majority of the subjects in the study. IV. C LASSIFICATION AND D ECISION F USION A. Features and Classifiers The four distinct biometric modalities considered in our analysis are (1) text entered via soft keyboard, (2) applications used, (3) websites visited, and (4) physical location of the device as determined from GPS (when outdoors) or WiFi (when indoors). We refer to these four modalities as TEXT, APP , WEB , and LOCATION , respectively. In this section we discuss the features that were extracted from the raw data of
1) Text: As Table IIIa indicates, the apps into which text was entered on mobile devices varied, but the activity in majority of the cases was communication via SMS, MMS, WhatsApp, Facebook, Google Hangouts, and other chat apps. Therefore, TEXT events fired in short bursts. The tracking application captured the keys that were touched on the keyboard and not the autocorrected result. Therefore, the majority of the typed messages had a lot of misspellings and words that were erased in the final submitted message. In the case of SMS, we also were able to record the submitted result. For example, an SMS text that was submitted as “Sorry couldn’t call back.” had associated with it the following recorded keystrokes: “Sprry coyld cpuldn’t vsll back.” Classification based on the actual typed keys in principle is a better representation of the person’s linguistic style. It captures unique typing idiosyncrasies that autocorrect can conceal. As discussed in §II, we implemented a one-feature n-gram classifier from [14] that has been shown to work well on short messages. It works by analyzing the presence or absence of n-grams with respect to the training set. 2) App and Web: The APP and WEB classifier models we construct are identical in their structure. For the APP modality we use the app name as the unique identifier and count the number of times a user visits each app in the training set. For the WEB modality we use the domain of the URL as the unique identifier and count the number of times a user visits each domain in the training set. Note that, for example, “m.facebook.com” is a considered a different domain than “www.facebook.com” because the subdomain is different. In this section we refer to the app name and the web domain as an “entity”. Table IIIb and Table IIIc show the top entities aggregated across all 200 users for APP and WEB respectively. For each user, the classification model for the valid class is constructed by determining the top 20 entities visited by
5
App Name com.android.sms com.android.mms com.whatsapp com.facebook.orca com.google.android.talk com.infraware.polarisviewer4 com.android.chrome com.facebook.katana com.snapchat.android com.google.android.gm com.htc.sense.mms com.tencent.mm com.motorola.messaging com.android.calculator2 com.verizon.messaging.vzmsgs com.groupme.android com.handcent.nextsms com.jb.gosms com.sonyericsson.conversations com.twitter.android
Keys Per App 5,617,297 5,552,079 4,055,622 1,252,456 1,147,295 990,319 417,165 405,267 377,840 271,570 238,300 221,461 203,649 167,435 137,339 134,896 123,065 118,316 114,219 92,605
App Name TouchWiz home WhatsApp Messaging Launcher Facebook Google Search Chrome Snapchat System UI Phone Gmail Messages Contacts Hangouts Home HTC Sense YouTube Xperia Home Instagram Settings
(a)
(b)
Visits 101,151 64,038 60,015 39,113 38,591 32,947 32,032 23,481 22,772 19,396 19,329 19,154 18,668 17,209 16,775 16,325 14,552 13,639 13,146 12,675
Website Domain www.google.com m.facebook.com www.reddit.com forums.huaren.us learn.dcollege.net en.m.wikipedia.org mail.drexel.edu one.drexel.edu login.drexel.edu likes.com mail.google.com i.imgur.com www.amazon.com netcontrol.irt.drexel.edu www.facebook.com banner.drexel.edu m.hupu.com t.co duapp2.drexel.edu m.ign.com
Visits 19,004 9,300 4,348 3,093 2,133 1,825 1,520 1,472 1,462 1,361 1,292 1,132 1,079 1,049 903 902 824 801 786 725
(c)
TABLE III: Top 20 apps ordered by text entry and visit frequency and top 20 websites ordered by visit frequency. These tables are provided to give insight into the structure and content of the dataset.
that user in the training set. The quantity of visits is then normalized so that the 20 frequency values sum to 1. The classification model for the invalid class is constructed by counting the number of visit by the other 199 users to those same 20 domains, such that for each of those domains we now have a probability that a valid user visits it and an invalid user visits it. The evaluation for each user given the two empirical distributions is performed by the maximum likelihood product in (1). Entities that do not appear in the top 20 are considered outliers and are ignored in this classifier. 3) Location: Location is specified as a pair of values: latitude and longitude. Classification is performed using support vector machines (SVMs) [23] with the radial basis function (RBF) as the kernel function. The SVM produces a classification score for each pair of latitude and longitude. This score is calibrated to form a probability using Platt scaling [24] which requires an extra logistic regression on the SVM scores via an additional cross-validation on the training data. All of the code in this paper is written by the authors except for the SVM classifier. Since the authentication system is written in C++, we used the Shark 3.0 machine learning library for the SVM implementation.
B. Decision Fusion Decision fusion with distributed sensors is described by Tenney and Sandell in [25] who studied a parallel decision architecture. As described in [26], the system comprises of n local detectors, each making a decision about a binary hypothesis (H0 , H1 ), and a decision fusion center (DFC) that uses these local decisions {u1 , u2 , ..., un } for a global decision about the hypothesis. The ith detector collects K observations before it makes its decision, ui . The decision is ui = 1 if the detector decides in favor of H1 and ui = −1 if it decides
in favor of H0 . The DFC collects the n decisions of the local detectors and uses them in order to decide in favor of H0 (u = −1) or in favor of H1 (u = 1). Tenney and Sandell [25] and Reibman and Nolte [27] studied the design of the local detectors and the DFC with respect to a Bayesian cost, assuming the observations are independent conditioned on the hypothesis. The ensuing formulation derived the local and DFC decision rules to be used by the system components for optimizing the system-wide cost. The resulting design requires the use of likelihood ratio tests by the decision makers (local detectors and DFC) in the system. However the thresholds used by these tests require the solution of a set of nonlinear coupled differential equations. In other words, the design of the local decision makers and the DFC are co-dependent. In most scenarios the resulting complexity renders the quest for an optimal design impractical. Chair and Varshney in [12] developed the optimal fusion rule when the local detectors are fixed and local observations are statistically independent conditioned on the hypothesis. Data Fusion Center is optimal given the performance characteristics of the local fixed decision makers. The result is a suboptimal (since local detectors are fixed) but computationally efficient and scalable design. In this study we use the Chair-Varshney formulation. The parallel distributed fusion scheme (see Fig. 3) allows each classifier to observe an event, minimize the local risk and make a local decision over the set of hypothesis, based on only its own observations. Each classifier sends out a decision of the form: ( 1, if H1 is decided ui = −1, if H0 is decided
(2)
The fusion center combines these local decisions by minimizing the global Bayes’ risk. The optimum decision rule
6
Start of Activity
text
Time text
Classifiers
text
text
text
{−1,1}
text
C1 {−1,1}
app
app
C2
web
location
web
C3
location
C4
{−1,1}
Data Fusion Center
{−1,1}
{−1,1}
Fig. 3: The fusion architecture across time and across classifiers. The TEXT, APP, WEB, and LOCATION boxes indicate a firing of a single event associated with each of those modalities. Multiple classifier scores from the same modality are fused via (1) to produce a single local binary decision. Local binary decisions from each of the four modalities are fused via (4) to produce a single global binary decision.
performs the following likelihood ratio test P (u1 , ..., un |H1 ) H1 P0 ≷ =τ P (u1 , ..., un |H0 ) H0 P1
(3)
where the a priori probabilities of the binary hypotheses H1 and H0 are P1 and P0 respectively. In this case the general fusion rule proposed in [12] is ( f (u1 , ..., un ) =
Pn 1, if a0 + i=0 ai ui > 0 −1, otherwise
•
Training on folds 1, 2, 3. Characterization on fold 4. Testing on fold 5.
•
Training on folds 2, 3, 4. Characterization on fold 5. Testing on fold 1.
•
Training on folds 3, 4, 5. Characterization on fold 1. Testing on fold 2.
(4)
with PiM , PiF representing the False Rejection Rate (FRR) and False Acceptance Rate (FAR) of the ith classifier respectively. The optimum weights minimizing the global probability of error are given by P1 a0 = log P0 M log 1−PFi , if ui = 1 Pi ai = F log 1−PMi , if ui = −1 P
algorithm. We then tested the performance of the classifiers, individually and as part of the fusion system, on the fifth fold. This phase is referred to as “testing” since this is the part that is used for evaluation the performance of the individual classifiers and the fusion system. The three phases of training, characterization, and testing as they relate to the data folds are shown in Fig. 4.
(5)
Training on folds 4, 5, 1. Characterization on fold 2. Methodology Testing on fold 3. •
(6)
i
Sensor Performance:
Training on folds 5, 1, 2. Training, Characterization, Testing Characterization on fold 3. We train, characterize, and test the binary classifier for User 1 on two classes: on fold 4. 1. Testing User 1
•
The threshold in (3) requires knowledge of the a priori probabilities of the hypotheses. In practice, these probabilities are not available, and the threshold τ is determined using different considerations such as fixing the probability of false alarm or false rejection as is done in §V-C.
2. Users 2 through 67
Class 1: Accept
Training
Characterization
Testing
60% of user 1 data
20% of user 1
20% of user 1
Training
Characterization
Testing
User 2
60% of user 2 data
20% of user 2
20% of user 2
User 3
60% of user 3 data
20% of user 3
20% of user 3
…
…
…
…
User 67
60% of user 67 data
20% of user 67
20% of user 67
User 1
V. R ESULTS A. Training, Characterization, Testing The data of each of the 200 users’ active interaction with the mobile device was divided into 5 equal-size folds (each containing 20% time span of the full set). We performed training of each classifier on the first three folds (60%). We then tested their performance on the fourth fold. This phase is referred to as “characterization”, because its sole purpose is to form estimates of FAR and FRR for use by the fusion
Class 2: Reject
5
Fig. 4: The three phases of processing the data to determine the individual performance of each classifiers and the performance of the fusion system that combines some subset of these classifiers.
7
The common evaluation method used with each classifier for data fusion was measuring the averaged error rates across five experiments; In each experiment, data of 3 folds was taken for training, 1 fold for characterization, and 1 for testing. The FAR and FRR computed during characterization were taken as input for the fusion system as a measurement of the expected performance of the classifiers. Therefore each experiment consisted of three phases: 1) train the classifier(s) using the training set, 2) determine FAR and FRR based on the training set, and 3) classify the windows in the test set.
B. Performance: Individual Classifiers
False Accept Rate (FAR)
0.5
0.2
0.1
1
4.2
7.4
10.7
13.9
17.1
20.3
23.6
26.8
30
Time Before Decision (mins)
False Reject Rate (FRR)
0.5
Location App Text Web
0.4
0.3
0.2
0.1
0
Firing Rate (per hour) 557.8 23.2 5.6 3.5
TABLE IV: The rates at which an event associated with each modality “fires” per hour. On average, GPS location is provided only 3.5 times an hour.
0.3
0
The “time before decision” is the time between the first event indicating activity and the first decision produced by the fusion system. This metric can be thought of as “decision window size”. Events older than the time range covered by the time-window are disregarded in the classification. If no event associated with the modality under consideration fires in a specific time window, no error is added to the average. Event Text App Web Location
Location App Text Web
0.4
different time windows) the FAR and FRR of the 4 classifiers averaged over the 200 users with the error bars indicating the standard deviation. The “testing fold” (see §V-A) is used for computing these error rates. The “characterization fold” does not affect these results, but is used only for FAR/FRR estimation required by the decision fusion center in §V-C.
1
4.2
7.4
10.7
13.9
17.1
20.3
23.6
26.8
30
Time Before Decision (mins)
Fig. 5: FAR and FRR performance of the individual classifiers associated with each of the four modalities. Each bar represent the average error rate for a given module and time window. Each of the 200 users has 2 classifiers for each modality, so each bar provides a value that was averaged over 200 individual error rates. The error bar indicate the standard deviation across these 200 values.
There are two notable observations about the FAR/FRR plots in Fig. 5. First, the location modality provides the lowest error rates even though on average across the dataset it fires only 3.5 times an hour as shown in Table IV. This means that classification on a single GPS coordinate is sufficient to correctly verify the user with an FAR of under 0.1 and an FRR of under 0.05. Second, the text modality converges to an FAR of 0.16 and an FRR of 0.11 after 30 minutes which is one of the worse performers of the four modalities, even though it fires 557.8 times an hour on average. At the 30 minute mark, that firing rate equates to an average text block size of 279 characters. An FAR/FRR of 0.16/0.11 with 279 characters blocks improves on the error rates achieved in [14] with 500 character blocks which in turn improved on the errors rates achieved in prior work for blocks of small text (see [14] for a full reference list on short-text stylometric analysis). C. Performance: Decision Fusion
The conflicting objectives of an active authentication system are of response-time and performance. The less the system waits before making an authentication decision, the higher the expected rate of error. As more behavioral biometric data trickles in, the system can, on average, make a classification decision with greater certainty.
The events associated with each of the 4 modalities fire at very different rates as shown in Table IV. Moreover, text events fire in bursts, while the location events fire at regularly spaced intervals when GPS signal is available. The app and web events fire at varying degrees of burstiness depending on the user. Fig. 6 shows the distribution of the number of events that fire within each of the time windows. An important takeaway from these distributions is that most events come in bursts followed by periods of inactivity. This results in the counterintuitive fact that the 1 minute, 10 minute, and 30 minute windows have a similar distribution on the number of events that fire within them. This is why the decrease in error rates attained from waiting longer for a decision is not as significant as might be expected.
This pattern of decreased error rates with an increased decision window can be observed in Fig. 5 that shows (for 10
Asynchronous fusion of classification of events from each of the four modalities is robust to the irregular rates at which
8
0.30
1 min window 10 min window 30 min window
0.25 0.20
of the fusion system improves, dropping from an equal error rate (EER) of 0.05 using the 1 minute window to below 0.01 EER using the 30 minute window.
D. Contribution of Local Classifiers to Global Decision
0.10 0.05 0.00
1
2
3
4
5
6
7
8
9
10
11
Number of Events Fired in Time Window
12
13
Fig. 6: The distribution of the number of events that fire within a given time window. This is a long tail distribution as nonzero probabilities of event frequencies above 13 extend to over 100. These outliers are excluded from this histogram plot in order to highlight the high-probability frequencies. Time windows in which no events fire are not included in this plot.
events fire. The decision fusion rule in (4) utilizes all the available biometric data, weighing each classifier according to its prior performance. Fig. 7 shows the receiver operating characteristic (ROC) curve trading off between FAR and FRR by varying the threshold parameter τ in (3).
False Accept Rate (FAR)
0.2
Individual Sensor Contribution (Ci)
0.15
1.4
Location App Text Web
1.2 1 0.8 0.6 0.4 0.2 0 1
0.1
Time Before Decision (mins) Fig. 8: Relative contribution of each of the 4 classifiers computed according to (7).
0.05
Ci =
0
0.05
0.1
0.15
30
The performance of the fusion system that utilizes all four modalities of TEXT, APP, WEB, and LOCATION is described in the previous section. Besides this, we are able to use the fusion system to characterize the contribution of each of the local classifiers to the global decision. This is the central question we consider in the paper: what biometric modality is most helpful in verifying a person’s identity under a constraint of a specific time window before the verification decision must be made? We measure the contribution Ci of each of the four classifiers by evaluating the performance of the system with and without the classifier, and computing the contribution by:
1 mins 10 mins 30 mins
0.15
0
10
0.2
False Reject Rate (FRR) Fig. 7: The performance of the fusion system with 4 classifiers on the 200 subject dataset. The ROC curve shows the tradeoff between FAR and FRR achieved by varying the threshold parameter a0 in (4). As the size of the decision window increases, the performance
Ei − E Ei
(7)
where E is the error rate computed by averaging FAR and FRR of the fusion system using the full portfolio of 4 classifiers, Ei is the error rate of the fusion system using all but the i-th classifier, and Ci is the relative contribution of the i-th classifier as shown in Fig. 8. We consider the contribution of each classifier under three time windows of 1 minute, 10 minutes, and 30 minutes. Location contributes the most in all three cases, with the second biggest contributor being web browsing. Text contributes the least for the small window of 1 minute, but improve for the large windows. App usage is the least predictable contributor. One explanation for the APP
9
modality contributing significantly under the short decision window is that the first app opened in a session is a strong and frequent indicator of identity. Therefore, its contribution is high for short decision windows. VI. C ONCLUSION In this work, we proposed a parallel binary decision-level fusion architecture for classifiers based on four biometric modalities: text, application usage, web browsing, and location. Using this fusion method we addressed the problem of active authentication and characterized its performance on a real-world dataset of 200 subjects, each using their personal Android mobile device for a period of at least 30 days. The authentication system achieved an equal error rate (ERR) of 0.05 (5%) after 1 minute of user interaction with the device, and an EER of 0.01 (1%) after 30 minutes. We showed the performance of each individual classifier and its contribution to the fused global decision. The location-based classifier, while having the lowest firing rate, contributes the most to the performance of the fusion system.
Lex Fridman is a Postdoctoral Associate at the Massachusetts Institute of Technology. He received his BS, MS, and PhD from Drexel University. His research interests include machine learning, decision fusion, and numerical optimization. Steven Weber received the BS degree in 1996 from Marquette University in Milwaukee, Wisconsin, and the MS and PhD degrees from the University of Texas at Austin in 1999 and 2003, respectively. He joined the Department of Electrical and Computer Engineering at Drexel University in 2003, where he is currently an associate professor. His research interests are centered around mathematical modeling of computer and communication networks, specifically streaming multimedia and ad hoc networks. He is a senior member of the IEEE. Rachel Greenstadt is an Associate Professor of Computer Science at Drexel University, where she research the privacy and security properties of intelligent systems and the economics of electronic privacy and information security. Her work is at ”layer 8” of the network – analyzing the content. She is a member of the DARPA Computer Science Study Group and she runs the Privacy, Security, and Automation Laboratory (PSAL) which is a vibrant group of ten researchers. The privacy research community has recognized her scholarship with the PET Award for Outstanding Research in Privacy Enhancing Technologies, the NSF CAREER Award, and the Andreas Pfitzmann Best Student Paper Award. Moshe Kam received his BS in electrical engineering from Tel Aviv University in 1976 and MSc and PhD from Drexel University in 1985 and 1987, respectively. He is the Dean of the Newark College of Engineering at the New Jersey Institute of Technology, and had served earlier (2007-2014) as the Robert Quinn professor and Department Head of Electrical and Computer Engineering at Drexel University. His professional interests are in system theory, detection and estimation,
information assurance, robotics, navigation, and engineering education. In 2011 he served as President and CEO of IEEE, and at present he is member of the Boards of Directors of ABET and the United Engineering Foundation (UEF). He is a fellow of the IEEE “for contributions to the theory of decision fusion and distributed detection.” R EFERENCES [1] M. Duggan, “Cell phone activities 2013,” Cell, 2013. [2] S. Egelman, S. Jain, R. S. Portnoff, K. Liao, S. Consolvo, and D. Wagner, “Are you ready to lock?” in Proceedings of the 2014 ACM SIGSAC Conference on Computer and Communications Security. ACM, 2014, pp. 750–761. [3] M. Harbach, E. von Zezschwitz, A. Fichtner, A. De Luca, and M. Smith, “Itsa hard lock life: A field study of smartphone (un) locking behavior and risk perception,” in Symposium on Usable Privacy and Security (SOUPS), 2014. [4] D. Van Bruggen, S. Liu, M. Kajzer, A. Striegel, C. R. Crowell, and J. D’Arcy, “Modifying smartphone user locking behavior,” in Proceedings of the Ninth Symposium on Usable Privacy and Security. ACM, 2013, p. 10. [5] C. Shen, Z. Cai, X. Guan, and J. Wang, “On the effectiveness and applicability of mouse dynamics biometric for static authentication: A benchmark study,” in Biometrics (ICB), 2012 5th IAPR International Conference on. IEEE, 2012, pp. 378–383. [6] A. Fridman, A. Stolerman, S. Acharya, P. Brennan, P. Juola, R. Greenstadt, and M. Kam, “Decision fusion for multimodal active authentication,” IEEE IT Professional, vol. 15, no. 4, July 2013. [7] M. O. Derawi, C. Nickel, P. Bours, and C. Busch, “Unobtrusive userauthentication on mobile phones using biometric gait recognition,” in Intelligent Information Hiding and Multimedia Signal Processing (IIHMSP), 2010 Sixth International Conference on. IEEE, 2010, pp. 306– 311. [8] F. Li, N. Clarke, M. Papadaki, and P. Dowland, “Active authentication for mobile devices utilising behaviour profiling,” International Journal of Information Security, vol. 13, no. 3, pp. 229–244, 2014. [9] T. Sim, S. Zhang, R. Janakiraman, and S. Kumar, “Continuous verification using multimodal biometrics,” Pattern Analysis and Machine Intelligence, IEEE Transactions on, vol. 29, no. 4, pp. 687–700, 2007. [10] J. Kittler, M. Hatef, R. Duin, and J. Matas, “On combining classifiers,” Pattern Analysis and Machine Intelligence, IEEE Transactions on, vol. 20, no. 3, pp. 226–239, 1998. [11] C.-H. Chen and C.-Y. Chen, “Optimal fusion of multimodal biometric authentication using wavelet probabilistic neural network,” in Consumer Electronics (ISCE), 2013 IEEE 17th International Symposium on. IEEE, 2013, pp. 55–56. [12] Z. Chair and P. Varshney, “Optimal data fusion in multiple sensor detection systems,” Aerospace and Electronic Systems, IEEE Transactions on, vol. AES-22, no. 1, pp. 98 –101, jan. 1986. [13] H. Saevanee, N. Clarke, S. Furnell, and V. Biscione, “Text-based active authentication for mobile devices,” in ICT Systems Security and Privacy Protection. Springer, 2014, pp. 99–112. [14] M. L. Brocardo, I. Traore, S. Saad, and I. Woungang, “Authorship verification for short messages using stylometry,” in Computer, Information and Telecommunication Systems (CITS), 2013 International Conference on. IEEE, 2013, pp. 1–6. [15] A. Abbasi and H. Chen, “Writeprints: A stylometric approach to identity-level identification and similarity detection in cyberspace,” ACM Transactions on Information Systems (TOIS), vol. 26, no. 2, p. 7, 2008. [16] A. W. E. McDonald, S. Afroz, A. Caliskan, A. Stolerman, and R. Greenstadt, “Use fewer instances of the letter ”i”: Toward writing style anonymization.” in Lecture Notes in Computer Science, vol. 7384. Springer, 2012, pp. 299–318.
10
[17] A. Fridman, A. Stolerman, S. Acharya, P. Brennan, P. Juola, R. Greenstadt, and M. Kam, “Multi-modal decision fusion for continuous authentication,” Computers and Electrical Engineering, p. Accepted, 2014. [18] R. Yampolskiy, “Behavioral modeling: an overview,” American Journal of Applied Sciences, vol. 5, no. 5, pp. 496–503, 2008. [19] M. Abramson and D. W. Aha, “User authentication from web browsing behavior.” in FLAIRS Conference, 2013. [20] N. Eagle, A. S. Pentland, and D. Lazer, “Inferring friendship network structure by using mobile phone data,” Proceedings of the National Academy of Sciences, vol. 106, no. 36, pp. 15 274–15 278, 2009. [21] B. Sun, F. Yu, K. Wu, and V. Leung, “Mobility-based anomaly detection in cellular mobile networks,” in Proceedings of the 3rd ACM workshop on Wireless security. ACM, 2004, pp. 61–69. [22] J. Hall, M. Barbeau, and E. Kranakis, “Anomaly-based intrusion detection using mobility profiles of public transportation users,” in Wireless And Mobile Computing, Networking And Communications, 2005.(WiMob’2005), IEEE International Conference on, vol. 2. IEEE, 2005, pp. 17–24. [23] S. Abe, Support vector machines for pattern classification. 2010.
Springer,
[24] A. Niculescu-Mizil and R. Caruana, “Predicting good probabilities with supervised learning,” in Proceedings of the 22nd international conference on Machine learning. ACM, 2005, pp. 625–632. [25] R. R. Tenney and J. Nils R. Sandell, “Decision with distributed sensors,” IEEE Transactions on Aerospace and Electronic Systems, vol. AES-17, pp. 501–510, 1981. [26] M. Kam, W. Chang, and Q. Zhu, “Hardware complexity of binary distributed detection systems with isolated local bayesian detectors,” IEEE Transactions on Systems Man and Cybernetics, vol. 21, pp. 565– 571, 1991. [27] A. R. Reibman and L. Nolte, “Optimal detection and performance of distributed sensor systems,” IEEE Transactions on Aerospace and Electronic Systems, vol. AES-23, pp. 24–30, 1987.