TXz elements of Xenopus (7) identified to date have all suffered insertions and/or ... element of Caenorhabditis elegans(14), one would anticipate the need to ... quence alignments were generated by the CLUSTAL V software. (20), with both fixed ...... W. L., Seo, P., Robison, K., Virk, S. & Gilbert, W. (1996). J. Mol. Bio. 257 ...
Proc. Natl. Acad. Sci. USA Vol. 93, pp. 10870-10875, October 1996 Genetics
Active transposition in zebrafish (transposable element/Danio rerio/two-dimensional gel electrophoresis/genomic transposon display)
WAN L. LAM, TIEN-SHUN LEE,
AND
WALTER GILBERT
Department of Molecular and Cellular Biology, The Biological Laboratories, Harvard University, 16 Divinity Avenue, Cambridge MA 02138
Contributed by Walter Gilbert, July 15, 1996
ABSTRACT We have identified a new family of Tcl-like transposons in the zebrafish, Danio rerio. The sequence of a candidate active transposon, deduced from sample Tzf elements, shows limited resemblance to the previously described Tdrl elements of zebrafish. Both the Tzf and the Tdr elements are extremely abundant in zebrafish. We describe here a general strategy for detecting transposition events in a complex genome and demonstrate its utility by selectively monitoring hundreds of potentially active Tzf copies in the zebrafish genome against a background of other related elements. We have followed members of a zebrafish pedigree, using this two-dimensional transposon display strategy, to identify the first examples of active transposition of such elements in vertebrates.
Although DNA-mediated transposable elements have recently been shown to exist in a variety of vertebrates (1-13), an active copy has not been found. Such transposons typically carry a transposase gene flanked by short inverted repeats, and they are widespread in the invertebrates (14-18). The P elements of Drosophila and the Tcl elements of Caenorhabditis are a significant source of mutations in these animals (14, 17). Vertebrate Tcls have been identified in agnathian (jawless) and osteichthyian (bony) fishes (3-6), as well as in amphibians (7). The Tesl element of the agnathian Eptatretus stouti (2), the Tdrl elements of the zebrafish Danio rerio (4, 5), the SALT1, Tss, and Tsg elements of salmonoids (3, 4), and the TXr and TXz elements of Xenopus (7) identified to date have all suffered insertions and/or deletions and contain stop codons in their transposase gene. Remnants (1-4, 7) of such DNA-mediated transposable elements in genes imply that they were once mobile, but demonstrating active transposition in a vertebrate genome has been an overwhelming task. Based on the transposition frequencies of the well-studied invertebrate example, the Tcl element of Caenorhabditis elegans (14), one would anticipate the need to examine thousands of progeny at many chromosomal loci to detect transposition events in a single generation. We describe here a novel transposon display strategy and its use to detect active transposition of a new vertebrate transposon family in the zebrafish.
the Sequenase system (United States Biochemical) and the CircumVent system (New England Biolabs). DNA sequences were imported into the GENETIC DATA ENVIRONMENT (19) for analysis. DNA and amino acid sequence alignments were generated by the CLUSTAL V software (20), with both fixed and floating gap penalty set at 15. Dot plot analysis of opposite DNA strands was performed, using the DOTTY PLOTTER program written by Don Gilbert (University of Indiana) to identify inverted repeats by scanning for matches of 18 in a moving window of 25 nucleotides. DNA and protein sequence data base searches were performed using various BLAST search routines (21, 22). Two-Dimensional Transposon Display. The zebrafish used in our experiments originated from the Ekwill Fish Farms (Gibsonton, FL), and they were bred and maintained by the Harvard Fish Facility. Each frozen zebrafish specimen was individually ground into powder in liquid nitrogen, resuspended in lysis buffer (20 mM Tris HCl, pH 7.5/5 mM Na2EDTA/0.5% SDS), and digested with proteinase K (0.5 mg/ml) at 50°C for several hours. DNA was precipitated from the phenol-extracted lysate with 2.5 volumes of ethanol. Zebrafish DNA was digested to completion with HaeIIIHinfl. Samples of 10-20 ,ug were separated on a nondenaturing acrylamide gel [acrylamide/6% N',N'-methylene-bisacrylamide (wt/vol); 37.5:1] in 40 mM Tris/20 mM sodium acetate/i mM Na2EDTA buffer at 7 V/cm for 13.5 hr. Each gel lane (slice) was cut and placed on top of a gel containing an ascending gradient of denaturing agents [0-28% formamide (vol/vol) and 0-5.6 M urea] in the same buffer. An apparatus (ISO-DALT system; Hoeffer) facilitated simultaneous electrophoresis of multiple gels in a 25-liter buffer chamber for 16 hr at 100 V, 1.5 A at a constant temperature of 62°C. DNA was electroblotted to nylon membrane and hybridized to an oligonucleotide probe corresponding to a part of the inverted end repeat. The membranes were washed extensively (in 50 mM sodium phosphate, pH 7.2/1% SDS) at room temperature and finally at 52°C for 2 min. Autoradiographs were scanned and analyzed using VISAGE 4.6 software from (Biolmage-Millipore). Twenty micrograms of a parental DNA mixture from two parents was compared with 10 ,tg from each diploid offspring.
MATERIALS AND METHODS
RESULTS AND DISCUSSION
Cloning and Sequence Analysis of Tzf Elements. Using a degenerate oligonucleotide probe corresponding to the amino acid sequence QQDNDPKHT-a conserved block in the transposases of C. elegan and E. stouti-we isolated several Tzf-containing lambda clones from a library of partially digested zebrafish genomic DNA library (Stratagene). Restriction fragments of interest were subcloned into plasmid vectors. DNA sequences of five Tzf elements were determined using
Tzf Elements of Zebrafish. We have identified a new Tcl-like element in zebrafish. The consensus of several homologous copies describes a 1621-bp candidate active structure, which we call Tzf (Fig. 1 A and B). This transposon resembles the recently reported zebrafish Tdrl element (4, 5) in overall structure but shares only 38% of its amino acid residues (Fig. 1B). Phylogenetic analysis of vertebrate transposases groups Tzf with the SALT1 element of Salmo solar (3) and the TXr element of Xenopus laevis (7).
The publication costs of this article were defrayed in part by page charge payment. This article must therefore be hereby marked "advertisement" in accordance with 18 U.S.C. §1734 solely to indicate this fact.
Data deposition: The sequences reported in this paper have been deposited in the GenBank data base (accession nos. U51226-U51230). 10870
Proc. Natl. Acad. Sci. USA 93 (1996)
Genetics: Lam et al.
A
10871
B TTCACS; ATCCGGA NCG TTCA.TAC rt TT f(CCtGCATTT'TTTTATGTTA" A GC>^ TT .' T'. ' .A AATGGATTaAATTAATTTATT'TC,-_rCAA'LATTCTA'V1' .A_ CCA
T AC AGrT
CCTTAT
Tzf.28
.
-+j6
Tzf.49
f"
Tz.13
1-M
Trzf.41 Tzf.44
t!477--
3W-
IMENEEEEE
EE.. ImEw-
A C AATAi 1.. ~AAAA i2L 'i".'I'TTGA .AATT GTT G TM^, s,' ,T 'l'AT>MsT
.TT.,TrC-TCAGTATTCACACCrTT.'CCCTCZ,;C-TCTAS..TT?.Cc c
11 i
T A ATS:',.CA^.i~(T GAA C.AA
;CTrAAAAA :
-W
P TSTAtTTATTT;C.TTCT.,rTT TCTC ->CC1 Ch1(-"uI TA- ; rAT Civ r C TGT r;UGT'A.-' TT' msAGT C^GATTCC'(3ACSTCNTGTTT ArGC TA CCC GTC'ri'^rP -'l'A rGC %(3CT"C PGPGTTGAC'.ATG±'1.TATTCCA ACCiAP.;We,,AUCC'PA.A'ATNCACAGACCA?AGATTC
c
ANTTT.'T,CTSGTCT''G.A5 .>.'I"'T" 'CA'"'GC AC. 'C.'GC1('(C' CTf
4,
K K
P
K
E
M G K S K E ,X TCTV.;'ll.:z .iA'T'T::-(:(.tm( '. ACA ;ATTCTC>TCA-.A'-C2.GCAr-.GCTCGGrGGA'r( 'sTTA'.AC3..A' S D'T.1r, R L; R I V S R H K A G E G Y R s yD ]- R R I V D -T H S G S S T
;4'
i
I
S
A
A
I
S
R
-L
L L
K K
V
P
"
S
V
P
H
S
A'I'G'InfrTT Gz.ac CC.-(" n.S,CCGrU'TC tTc
rfF R E
AT IV;
'1)
T
C ATCAT
rT P;
r.
JR
G
.
R
P
R ';G R ~ ~ ~ -L. A1
R
R
AM R
7'
R
S
R
A.
V
v
.t!V
A.
R
P1Ar
--V
R -'
-I
ccGTAA.C-TGUGaAG A R
r'
R
hrT
Y
K
TgA3AqCTGtCCgqG,,CArA('TAaG.trT
G RT .75TR F' ' G I P .. 2 g S~~~~~~~~~~~~
G D
't .S-
YV
N
P
:N
P
1
T
PT(G aTcgG S. L S VFR L C V) R A
L
;S.:
L
A
1.d
L
D
Aa
VA PR. T T r G C MI Z.. .a E TA. G ,C TT - S r..A Z 'T PK f 'T (, CAC CATC%T'.1_:(rCTGTA,TCGT'?ioG AG,GtCCmh, .-ACG'r'PGACCrAC"CCT(CAC-TAGGATT Hb ^' S7 G L r G .R li! A Rt P K A F F r i 'X G L' R G S A R RF /h + K A R Z C F At
rG.
rA G CT CA g C A KP HT' CS DS r-'d N E' a~~~~~~~~ A ML -',
500)
000
1500
2000
Tdr
T T
K K C .trlr
A
A
R JH
L L
'.f.;.
;(;(
L
N
AC- h. Aan:iC'aTCT( W S D INAA I t LCC'T L S D RI
G
A
R
'alN,D2
R AR
Y
_
W W
R R
-^^:
P
T
,K
G G
1.
TAACACTATTACATCTL;Ca .
..
N
T
N
T
CTC C -TACAGtoT (; iA~Gxm," STGGTGt;T,.7 G cA (C' MTX',IT16 f 'I G I P T V R JY G G G S I ML I P T V lr G G G S I M L G G
I I
R
T
L L
K
R
L
P
L
T CA,aTI E G ;j I .'G] (j M
D' T"La-T rC S A
T
H, L
l-
S1
A
--aT
L ' LA L K'
tz C~'%C TAT .s TC' C SC'A.AG; AC A CT .C C;!. ArINAA.T A;TC t z nC. D N D P K H F Q T A K i G .: isP'fF Q 14 D H D P K H T A K T U A''C wG^CGCl8 t-ACATCCCTCkA'rTCTC ,.rGtTUGCUCACC(A'C n. N" N S V N V L E W P S Q S P D
,;r-
N P N P L
N
L
C
A E
'"C
CCTC
N
V
N
V
L
E
W
P
SQ
S
P
AR R AR s) WM AF L K L t V R A TTG fJ AGAG, ACT1G(n A .;;.AG;C; SaCAst. l YnTG ;.f 7( t ,mA T(-. -. E R L C E E W A K I P R' 11R 'T ,.'L ,Q F C C E E W A K I P
K
,
L
V
L
V
A G
Y
S
Y
P
F K LR K HH
L L
T
D
C CCOA ^T
A
V
I
..'
V
I
P P
A
ATZSA.-TTCCAACTC-TC';P-AIfTAC"TCATC-'TACN~I'CT''T''a
(
T T
K
Y
K
Y
t
CilM
R
TSsUSACT'CTCTfCAC.aACATCTCA.^.-eTTCT(sAC L K I E Mi R A V H 4X
I TAC.' ' T- 3;as1.-i.--l' A N
R
'
R
(or;( w C/ 11 ;f; J G-F R F-
CTi
L
G G
G
,
L
F
i'R i-in Ijr
As?-TY
L
F
GTCT F '.T A CA T C F .h%, A 's~ G T
W
W
E E
I I
a
U Alu,TCC ^ GGAuA-.AAArCA. GC'.gc f;rJC-TTGTT'
tAA 'taTT .(t.Tr-TTGTC'-..GTTCA0
i
T
c
S.
a~~~~~~~~~~~~ CrrTTTTT.>TTO-POT(,TC!I.TTT
ATGCGGTATTCTGTGTAGAATGTTGAGGAAA'-'TAJaA,'TGAA'-TITTAATCCATTTTGGC-AAAAC"
FIG. 1. Structure of Tzf elements and comparison of two zebrafish transposons. A 1621-nt consensus DNA sequence was derived from five Tzf sequences (GenBank accession nos. U51226-U51230). The structure of the individual Tzf elements are shown inA, with arrows representing the inverted repeats and black boxes representing the transposase coding regions. Major insertions (as the number of nucleotides inserted) and deletions (as gaps) are indicated. The consensus DNA sequence shown in B is defined by majority at any given position. At the positions where two possible nucleotides could reside, both are shown in lowercase letters along with the probable amino acid translation [that would fit the multiple vertebrate Tcl transposase alignment shown in (7)]. The inverted repeats are underlined. The 340 amino acids of the Tdr transposase sequence (4, 5) are aligned below the 339 residues of the Tzf transposase translation with shared residues marked in bold and unidentified residues marked by an X. In C, the Tdr DNA sequence is plotted against the Tzf consensus, by scoring for 18 matches in a moving window of 25 nucleotides, to detect identity between their end repeats (arrows) and their transposase gene (shaded boxes). The numbers correspond to Tzf sequence positions and Tdr sequence positions (GenBank accession no. ZEFTC1).
Dot plot analysis, comparing the consensus Tzf DNA seagainst its own complementary strand, reveals a pair of 220-bp inverted repeats encompassing the deduced transposase gene. Alignment of the sequences flanking five pairs of inverted repeats identifies the presence of a TA dinucleotide at 8 of the 10 termini (presumably the other two have mutated to TC and CA), suggesting that Tzf, like Tcl and mariner, integrates at the sequence TA. Although the originally identified Tdr element appeared to have much shorter end repeats of 52 bp (4), a dot plot of opposite strands of Tdr sequence (GenBank accession no. ZEFTC1) reveals a long extension of
quence
the repeats after a small region of mismatches. [We also observe 200-bp inverted repeats in X. laevis Tcl-like transposons (7).] The Tzf and the Tdr end repeats are similar in size but very different in sequence. A dot plot of Tzf against Tdr not only shows that there is no significant sequence identity between the Tzf and the Tdr end repeats but also illustrates the low overall similarity between these two transposon types (Fig. 1C). Lowering the stringency from 18 matches to 12 matches in a moving window of 25 positions does not improve the detection of the end repeats. Genomic Transposon Display. Since a dot plot comparison of these two transposons shows a lack of conservation of their
10872
Genetics: Lam et al.
Proc. Natl. Acad. Sci. USA 93 (1996)
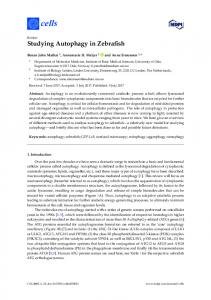
inverted end repeats (Fig. 1C), they can be monitored separately in the same genome using end repeat-specific probes, and, since the trans-acting TclA transposase of C. elegans functions by binding specifically within the inverted repeats (23), the number of potentially active Tzfs and Tdrs in the zebrafish genome can be estimated by counting the number of conserved terminal repeats. To resolve the Tzf and Tdr elements in the 2-gigabase zebrafish genome, we adopted a two-dimensional gel electrophoresis system (24-26). Digestion of genomic DNA with a pair of restriction enzymes that cuts frequently within and outside the transposon but not in the inverted repeat generates two target fragments for each transposable element. We first resolve DNA fragments by size on a nondenaturing polyacrylamide gel and then separate by base sequence composition on a denaturing gradient gel in a second dimension. After transfer of the two-dimensional pattern to a nylon membrane, target fragments appear as spots upon hybridization to a singlestranded end repeat-specific probe. Fig. 2 shows a pattern of
524 hybridization signals to the Tdr probe in a wild-type zebrafish, while more than 800 signals appear with the Tzf probe. Thus, '700 Tcl-like elements are equipped with inverted repeats and are potentially active in the zebrafish genome. We monitored Tzf loci between generations by comparing two-dimensional displays of individual offspring from a single cross to a template of the total parental DNA (father and mother, combined). The parental sample shows all the heritable Tzf alleles, and each offspring should inherit a subset. The DNA concentrations, 20 ,ug of parental and 10 jig of progeny, are such that a single heterozygous locus in the parent should appear at the same intensity in the progeny. We followed 51 randomly selected loci (spots) on 12 individual offspring displays to estimate the frequency of polymorphism. In strain Ekwill, 65% of the Tzf loci examined were polymorphic (33/51), while 35% (18/51) were homozygous in one or both parents (accounting for two of four, three of four, or four of four possible alleles) and appear in all offspring. Fig. 3 shows the data and our analysis to estimate how many single and
Tdr 00
0-P
0-
O oA
-
0
c00 0
I
.
200
300
400
500
600
700
FIG. 2. Two-dimensional transposon displays. HaeIII-Hinfl-digested zebrafish DNA (from one of the 25 offspring samples described in the Table 1 legend) was separated in two dimensions as described. Blotted DNA was first hybridized to a Tdr end repeat-specific probe (5'AAATGGTTATGTGCCTTTTTATACAGTGTATGTAAAC), then stripped and rehybridized with a Tzf end repeat probe (5'-AGCTGAAAAATCACATGTACATCAGTATTCACAGCCTTTG). The vertical axis indicates the nondenaturing dimension, while the horizontal axis indicates the denaturing dimension of the displayed image. Part of the whole 21 x 19 cm2 blot is displayed here as an 980 x 820 pixel image.
Genetics: Lam et al.
Proc. Natl. Acad. Sci. USA 93 (1996)
Tzf Polymorphisms 18
16
14
;i3or4
EO 2-homoi 0-2-het
cn
12 ') t
e
I-het
0
Q tI0
__I
-
° 8fj E
.
2
3
4
5
6
7
8
9 10 11 12
Progeny with a Specific Spot FIG. 3. Tracing Tzf loci between generations to estimate the frequency of polymorphisms. Fifty-one randomly chosen Tzf loci were monitored by comparing the two-dimensional displays of 12 offspring against the combined display of their parents, scoring for the presence of specific spots at the individual loci. The number of occurrences (number of loci out of 51 analyzed) was plotted against the frequency of progeny with a specific spot. The height of each column indicates the number of loci with that inheritance frequency. To deduce the number of single (1-het) and double (2-het) heterozygous polymorphisms from the inheritance frequency, we estimated the number of occurrences of having a specific spot present in one-half and in three-quarters of the progeny. We observed 25 (-50% of all loci) and 8 ( 15%), respectively, assuming a normal distribution with a peak at 6 (out of 12) and a peak at 9 (out of 12). The 18 spots that appear in all the progeny represent homozygozity in one or both parents. Both single homozygozity (none in the other parent) and double heterozygozity account for two of the four parental alleles. If the frequency of these two categories were ihe same, then 8 of the 18 universal spots would be attributed to single homozygozity (2-homo). The remaining 10 would be double homozygous, or homozygous in one and heterozygous in the other parent (3 or 4).
double polymorphisms there were. A single heterozygous polymorphism (on one of the four parental chromosomes) would be inherited by half the progeny as a spot of equal intensity. We estimate that 50% of the loci in Ekwill are of this type. A shared heterozygous polymorphism (one chromosomal locus in each parent) should appear as a spot of equal intensity in one-fourth of the progeny, of half intensity in one-half of the progeny, and be missing in one-fourth of the progeny. We estimate 15% of the loci in Ekwill are of this type. We expect an equivalent 15% of the loci to be homozygous in one parent and absent in the other and estimate that a last 20% occur in three or four copies; all of these would appear as nonpolymorphic in this test. Active Transposition. Does active transposition occur? To assay for new insertions, we traced anonymous Tzf-containing loci from one generation to the next. We hoped that screening all the chromosomal loci at once would eliminate any need to examine thousands of offspring. We compared the Tzf display
10873
of the total parental DNA (father and mother, mixed) with displays of 25 individual progeny from a single cross. A spot that appears in a progeny display but not in the parental sample is a candidate for a new Tzf locus. We detected 11 new Tzf loci in the 25 offspring examined. Fig. 4 shows a number of examples. A new Tzf allele unique to a single offspring could be attributed either to a mutation at a specific restriction site or to a genuine transposition event. We were surprised to observe that ten of the novel spots are present in more than one offspring (Table 1 and Fig. 4). These ten multiple occurring new Tzf alleles (in 13-63% of the offspring) happen too frequently to be attributed to random mutations at restriction sites. We further examined the combined parental display for faint signals at these 11 novel Tzf loci, and for four cases, there are faint parental spots of varying intensities (Table 1). These do not represent polymorphisms, since all alleles on the parental blot, including single heterozygous loci, should appear at equal or higher intensity than in the progeny. Could these novel spots be due to general genomic alterations, such as a change in methylation pattern? A methylation difference between parent and offspring, such that a sequence that was methylated in the parent becomes demethylated in the offspring and thus produces a novel fragment might be conjectured. However, the enzymes that we used, HaeIII and Hinfl, are not sensitive to methylation, so this cannot be a source of the tovelty. Furthermore, the spot pattern of each offspring analyzed is otherwise consistent with inheritance, and these novel spots are randomly distributed among the offspring. Another alternative interpretation would be incomplete enzymatic digestion, resulting in a fragment not being completely released from the parent, but being completely released and appearing in some of the offspring. This was controlled for by examining different exposures of several different blots of parental DNA, each blot involving an independent digestion, to see that the appearance or the lack of appearance (or faint appearance) was a consistent property, independent of the accident of digestion. None of the 11 novel spots comes in pairs. We do not have an explanation for not having detected the expected second spot, except we are certainly seeing less than half of the spots and expect a detection bias in that we can observe the phenomenon only in reasonably clear regions of the pattern. (In the pattern of Fig. 2, we can use only the outer regions.) Transposition of Tcl-like elements is frequently associated with the excision of the element from one site and its reintegration elsewhere (27, 28). Transposition events that occur during meiosis should appear as unique events in single offspring. Similarly, somatic transposition during mitosis in an offspring should appear as unique events. However, mitotic transposition in the parental germ line should lead to mosaicism of the parental germ cells and appear as recurring spots in a fraction of the offspring, although it is still not detectable in the total somatic parental DNA. A very early somatic event, which might be detectable as a faint spot in the parent, might influence all the germ cells and thus appear in half the progeny. (Such an event has to occur during the first few cell divisions to produce enough material for subsequent detection on a two-dimensional display-detection of 1/32 or 1/16 the intensity of a typical spot is challenging.) Indeed, in four cases, we observed a very faint signal in the parental sample (Table 1 and Fig. 4), and dark forms of these spots generally occurred in half the progeny. Mutation Rate Contribution. Could the background mutation rate be due to active transposition? We detected a total of 87 new spots. Correcting for the number of offspring analyzed, we estimate that there were 3.9 changes/offspring; and, on correcting for the detection efficiency of