MITSUBISHI ELECTRIC RESEARCH LABORATORIES http://www.merl.com
Adapting a Single-User, Single-Display Molecular Visualization Application for Use in a Multi-User, Multi-Display Environment
Clifton Forlines, Ryan Lilien
TR2008-019
June 2008
Abstract In this paper, we discuss the adaptation of an open-source single-user, single-display molecular visualization application for use in a multi-display, multi-user environment. Jmol, a popular, open-source Java applet for viewing PDB files, is modified in such a manner that allows synchronized coordinated views of the same molecule to be displayed in a multi-display workspace. Each display in the workspace is driven by a separate PC, and coordinated views are achieved through the passing of RasMol script commands over the network. The environment includes a tabletop display capable of sensing touch-input, two large vertical displays, and a TablePC. The presentation of large molecules is adapted to best take advantage of the different qualities of each display, and a set of interaction techniques that allow groups working in this environment to better collaborate are also presented. AVI 2008
This work may not be copied or reproduced in whole or in part for any commercial purpose. Permission to copy in whole or in part without payment of fee is granted for nonprofit educational and research purposes provided that all such whole or partial copies include the following: a notice that such copying is by permission of Mitsubishi Electric Research Laboratories, Inc.; an acknowledgment of the authors and individual contributions to the work; and all applicable portions of the copyright notice. Copying, reproduction, or republishing for any other purpose shall require a license with payment of fee to Mitsubishi Electric Research Laboratories, Inc. All rights reserved. c Mitsubishi Electric Research Laboratories, Inc., 2008 Copyright 201 Broadway, Cambridge, Massachusetts 02139
MERLCoverPageSide2
Adapting a Single-user, Single-display Molecular Visualization Application for Use in a Multi-user, Multi-Display Environment Clifton Forlines1,2, Ryan Lilien1 1
Department of Computer Science University of Toronto Toronto, ON, Canada
[email protected]
ABSTRACT In this paper, we discuss the adaptation of an open-source singleuser, single-display molecular visualization application for use in a multi-display, multi-user environment. Jmol, a popular, opensource Java applet for viewing PDB files, is modified in such a manner that allows synchronized coordinated views of the same molecule to be displayed in a multi-display workspace. Each display in the workspace is driven by a separate PC, and coordinated views are achieved through the passing of RasMol script commands over the network. The environment includes a tabletop display capable of sensing touch-input, two large vertical displays, and a TabletPC. The presentation of large molecules is adapted to best take advantage of the different qualities of each display, and a set of interaction techniques that allow groups working in this environment to better collaborate are also presented.
1. INTRODUCTION Scientists wishing to understand the function of a protein must gain an understanding of its 3D shape: unlike in design, in molecular biology function follows form. Because of the bandwidth of the human visual perception system, 3D visualization is an appropriate and widely used means of conveying protein structure, and thus protein function. Proteins are themselves not visible: they are too small to reflect visible light in a meaningful way. Rather than being a constraint, this characteristic of proteins allows the scientist to choose among a large number of visual representations for proteins and other macromolecules, each one of which highlights certain features of the structure (An overview of the many ways in which a macromolecule can be represented visually and the strengths and weaknesses of these techniques can be found in [22]). For the student or scientist, there are literally hundreds of software visualization packages to choose among. Some of the more popular packages are compared in [22]. While some choice from this diverse set should meet any single individual’s needs, groups of researchers wishing to work collaboratively with a visualization application will run into many problems. These problems stem from the single-display, single-user assumptions that most
2
Mitsubishi Electric Research Labs th 201 Broadway, 8 Floor Cambridge, MA 02139 USA
[email protected]
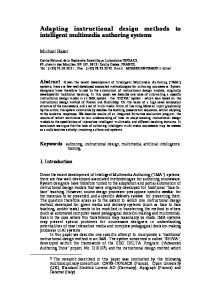
application developers make. For example, personal computer workstations typically have a single mouse and keyboard, which can be difficult to share among the members in a group. Similarly, a group oftentimes has trouble crowding around a single desktop display. While a large projected display gives a good view to every group member, this type of presentation forces everyone into a shoulder-to-shoulder position, which may not be conducive to collaboration. Finally, groups working together often pass in and out of periods of independent work, which is not possible when sharing a single application. Teams working together typically work face-to-face around a tabletop, sometimes surrounding themselves with materials hung or projected on the walls of their workspace. It seems natural that applications used by teams should be made compatible with this type of work environment. In this paper, we present an adaptation of Jmol [11], a popular open-source molecular visualization application, for use by a small group working together in a tablecentric, multi-display computational environment, such as those described in [5, 20, 24] (Figure 1). While these environments are rare today, they will likely become commonplace, and the developers of molecular visualization applications may design their tools to best take advantage of the space; however, for now the adaptation of existing tools for use in these workspaces is a worthwhile endeavor.
2. RELATED WORK 2.1 Wrapping Single-user Software Building software “wrapper” applications for multi-user settings has been the subject of much research. Greenberg [6] surveyed and discussed a large number of such projects all performed with the goal of providing shared-views among distributed, remote worksites. These projects shared the goal of ensuring that the same view is displayed on different remote machines so that separated users have a shared context for remote collaboration.
Permission to make digital or hard copies of all or part of this work for personal or classroom use is granted without fee provided that copies are not made or distributed for profit or commercial advantage and that copies bear this notice and the full citation on the first page. To copy otherwise, to republish, to post on servers or to redistribute to lists, requires prior specific permission and/or a fee. AVI'08, 28-30 May , 2008, Napoli, Italy Copyright 2008 ACM 1-978-60558-141-5...$5.00.
Figure 1. A picture of Jmol [11] displaying a hemoglobin molecule in our mutli-display, table-centric workspace.
Forlines et al. [5] demonstrated a system in which multiple instances of a geospatial application ran on multiple machines in a workspace, with each machine rendering a different view. Rather than keep the multiple instances of the software perfectly in sync, they allowed the machines to display slightly different, coordinated views of the same data with the goal of providing a group multiple point-of-views of the same geospatial location.
2.2 Multi-user Perception One well-known phenomenon about individuals’ perception is that objects are most easily recognized when presented at their canonical orientation [12]. This presents a problem with some tabletop interfaces because objects that have a strong axis of orientation may be upside-down or sideways to some people gathered around the table. While there is no inherent axis of orientation for a protein, in practice groups familiar with a particular protein tend to arbitrarily set a canonical orientation. This orientation arises organically from the users’ interaction with the molecule. Thus, although a biologist is likely familiar and fluent when dealing with an arbitrary orientation of their molecule, when given the choice they will likely adopt a single preferred orientation for a familiar protein. For these structures, vertical displays may be most appropriate for presentation to a group. Unfamiliar proteins or unfamiliar regions of a protein without a universal “up” lack this canonical orientation and may benefit from being viewed in a particular orientation. For example, when trying to identify common folds between pairs of proteins, accepted perceptual psychology theories state that it would be helpful if the features in question were aligned with one another. With each member of a group sitting at a different side of the table, they are all provided with a different point-of-view of the protein; thus, it is more likely that at least one member of the team will have an advantageous view of the target features. This potential benefit of a tabletop display is in contrast to a vertical display, on which a feature that is presented in a disadvantageous rotation for one group member is presented in a disadvantageous rotation for all group members. It would seem that a collection of horizontal and vertical displays would be best for groups dealing with both familiar and unfamiliar structures.
2.3 Benefits of Multiple Displays and New Types of Displays Multi-display workstations have become commonplace in recent years, and the performance and preferential benefits of using multiple displays has been the focus of many research projects [3, 7, 9, 21]. Similarly, large displays have been investigated, and have been found to have performance and preferential advantages [1]. The large number of pixels available in these workstations allows multiple views of a dataset to be presented simultaneously [15], which may aid not only the user’s understanding of a dataset [19], but also the coordination of a group working together [5]. For viewing 3D structures, stereoscopic displays create the illusion of depth in an image (for a good overview of stereo technologies, see [10,16]). Intuitively, using a 3D display should lead to a better understanding of 3D structures. One variation of stereoscopic displays is the immersive CAVE environment, in which a user stands within a 6-sided workspace with images projected on the walls, floor, and ceiling [2]. CAVE environments have been shown to increase performance for some spatial tasks. While both stereoscopic displays and CAVE environments should aid a molecular biologist working alone, most of these technologies are not appropriate for group use.
2.4 Molecular Visualization Cyrys Levinthal led a team of researchers at MIT in the 1960s that built the first computer system for the visualization and manipulation of molecular structures [13]. Using a monochrome oscilloscope, their system displayed molecules as simple wireframe models that rotated on the screen. Recognizing the usefulness of non-physical visualizations, many university and industrial groups built or purchased molecular visualization software to run on their department’s mainframe computers. Roger Sayle spent the early 1990s building the molecular visualization application RasMol [18] while working as a graduate student. RasMol’s distinguishing feature was that it ran fast enough on personal computers to be useful to the large number of students and scientists without access to expensive mainframe computers. While the first, RasMol is by no means the only such application: there are over a hundred freely available molecular visualization applications available as of the time of this writing. While there are many choices, these applications share the characteristic that they were built for personal computers and make the assumption that they will be used by a single-user. Similarly, most applications assume that there is only one display attached to the computer. Groups wishing to use these applications must share a single keyboard and mouse and crowd around a shared display. Perhaps most similar to this paper, John Tate led a team of researchers in the development of a collaborative molecular visualization tool called MICE, the Molecular Interactive Collaborative Environment [23]. MICE uses VRML and a webbased interface to provide distributed researchers with a single shared view of a molecular scene. Our project differs in that our goal is to provide co-located researchers with multiple, related views of a molecular scene.
3. SYSTEM OVERVIEW Figure 2 shows an overview of our system. The main component of the system is a Windows PC attached to a DiamondTouch [4] tabletop input device. Gestural commands on the tabletop control the local instance of Jmol running on the same machine. Networked client PCs running their own instances of Jmol connect to the tabletop machine on startup and receive appearance and Point-of-View (POV) scripts from the table. Finally, a second client application built to run on a TabletPC connects to the tabletop on startup and sends selection and appearance scripts to the table machine.
4. COMPONENT 1 – TABLETOP DISPLAY At the heart of the system is a DiamondTouch input device. This table is capable of sensing and distinguishing multiple points of contact from up to four group members. This table is connected to a PC that acts as the main server of our application.
Figure 2. System Overview. Our multi-user, multi-display environment contains a tabletop display, a tablet display, and two wall displays driven by the four machines pictured above.
Figure 3. The Control Bar. This control contains a representation for the current tabletop state, bookmarks for saved states, representations for each wall display in the workspace, and a trashcan for deleting bookmarks.
4.1 Gestures for Point-of-view Control To allow for quick and natural camera control, we implemented a set of gestures for controlling point-of-view on the tabletop. Touches made by any user on the table are mapped by a gesture interpreted to one of four commands. Touches with a single finger tumble the molecule on the table according to the ArcBall rotation mechanism. Touching the table with two fingers and spreading them apart zooms the camera in, while pulling them together zooms the camera out. When a user grabs the tabletop with their whole hand, their touches are interpreted as panning commands and can “drag” the molecule around in the image plane. Finally, if a user touches the table with a closed fist, they can rotate the molecule in the image plane. Many of the commands for selecting structures in a molecule and changing the visual presentation of a molecule are accessible in Jmol through a right-mouse click. To enable our users to access these commands, we added a thumb-tap gesture which results in a right-mouse click. When touching the table with ones index finger, a quick tap with ones thumb executes the command and pops up the contextual menu. One final command added to a recent version of the prototype is a single-finger dwell. After dwelling on a portion of the molecule, the tabletop responds by centering the point-of-view on the atom directly under ones fingertip. All subsequent rotations occur around this new center.
4.2 Multi-user Input Any one of four users sitting around the table can perform the gestural input described in the previous section. In our system, we choose to implement a simple floor-control mechanism that gives control of the application to the first user who touches the tabletop. All subsequent touches by other users sitting around the table are ignored until the initial participant completes their command and lifts their hands from the table.
4.3 Control Bar Along one edge of the table, the application displays a control bar that provides the group with some additional functionality to control the behavior of the wall displays and to aid in collaborative discussions. A close-up of the control bar is shown in Figure 3. The control bar is divided into three regions. On the left is a WIM (World in Miniature) representing the current state of the tabletop display. When the molecule is manipulated on the table, the appearance of this WIM updates to reflect the current state of the application. Touching and dragging this WIM into the middle region creates a new bookmark. Bookmarks are miniature WIMs that save the current state of the visualization as a script file. When bookmarks are clicked, or dragged onto the tabletop WIM, the script file is loaded and the previous state revisited. Using bookmarks, a group can easily save and return to a previous portion of the conversation – allowing groups to easily explore
tangents and forks without loosing their place. Bookmarks can be removed from this area by dragging them to the trash. On the far right of the control panel are WIMs for each of the wall displays currently connected to the system. A user can drag the tabletop WIM to a wall WIM to set the state of the wall machine, or can drag a bookmark onto a wall WIM to load that saved state on the wall machine. Finally, by clicking on any wall WIM, a user can enable / disable the point-of-view synchronization between the table and wall described in the next section. Our prototype includes a single control panel. An alternative design would replicate this tool along each edge of the table. Bookmarks could either be shared among all of the control bars, or kept separate, allowing each user to bookmark moments in the conversation that they found important individually.
5. COMPONENT 2 – WALL DISPLAY Each wall display is driven by a separate PC running Jmol and communicating to the tabletop server machine over the network. Communication messages consist mostly of RasMol script commands for changing the loaded protein or molecule, point-ofview, or appearance of the structure. By default, when a PDB file [17] is loaded on the tabletop, a load script is sent to all of the wall displays in the system. When a user alters the point of view on the tabletop, each wall display receives a message, which when executed causes them to display the same POV. While POV and load commands are synchronized among the machines in the workspace, appearance commands are not. Only when the tabletop’s appearance or a bookmark’s appearance is specifically sent to a wall display does the appearance of the wall display change. In this way, a group can easily compose the workspace to display multiple views of the same structure using different representations of the molecules (Figure 4). As pointed out by Roberts [19], by simultaneously displaying the data in multiple ways, users may understand the information through different perspectives, overcome possible misinterpretations and perform interactive investigative visualization through correlating the information among views. Two final commands from the tabletop server are listened for by the wall machines. The first command instructs the wall to ignore
Figure 4. Three representations of the protein hemoglobin – space fill, cartoon, and stick. Each highlights different facets of the molecule and are used for different purposes.
point-of-view scripts from the tabletop. When a user clicks on a wall WIM on the tabletop control bar, this command is sent over the network to the corresponding machine. By freezing the pointof-view, a group can arrange their collection of displays to present multiple POV of the same protein or molecule. A second click on the WIM unfreezes the wall display. The second command is sent when the group quits Jmol on the tabletop display, and this command instructs the wall display to shut down and exit the application immediately.
appearance of the selected structures. These controls send a corresponding RasMol script to the tabletop machine that effects the visual presentation of the current selection. In the ‘Atoms’ quadrant, there are several controls for changing the visual size of the atoms in the current selection and for hiding them completely. In the ‘Styles’ quadrant, there are six buttons that change the appearance of the current selection to one of six popular visualization schemes – Space-filling, Ball-and-Stick, Stick, Wireframe, Cartoon, and Trace. In the ‘Surface’ quadrant, there are controls for visualizing the surface of the molecular structure and for making this surface transparent or opaque. In the ‘Color’ quadrant, there are controls for changing the color of the atoms in the current selection, as well as controls to color these atoms either by their element or by their residue. Finally, at the top of the application, there are controls for selecting all of the atoms in the file, selecting none of the atoms in the file, inverting the current selection, and for toggling the highlighting of the current selection on the tabletop.
Figure 5. Selections on the tablet are reflected on the tabletop display. In this figure, one of the four chains in the protein is selected. Selected atoms appear in light yellow.
6. COMPONENT 3 – TABLET DISPLAY Often in molecular visualization, biologists choose to highlight the subset of residues or individual molecular components involved in a particular molecular function or interaction. This is useful because a protein may have hundreds of residues with only about 10 residues being important to any one particular interaction. After experimenting with an early version of the system, it became clear that selecting sub-structures and individual atoms was too difficult and cumbersome. Indeed, accurate selection of small targets is well known to be difficult with ones fingers. To address this limitation, we built a second client application that runs on a TabletPC and allows for the quick and accurate selection of chains1, secondary structure elements2, and residues. Additionally, the tablet interface has controls for changing the appearance of the currently selected atoms. To jumpstart the development of this selection and appearance application, we used the Molecular Biology Toolkit [14]. This Java-based toolkit from the San Diego Supercomputing Center provides a set of classes for loading, parsing, and manipulating molecular CIF [8] files. To aid selection, we built a hierarchical selection widget that was placed on the left side of the screen. This widget displays the chains, secondary structural elements, and individual residues from the loaded file. Using the stylus, a user can select an element from any level, and selections are communicated over the network to the tabletop machine. Figure 5 shows how the selection of an entire chain made on the tablet is reflected on the tabletop. The majority of the tablet application contains controls for altering the 1
A ‘chain’ is a single connected molecular component (i.e. if a graph is defined in which each atom is a vertex and each bond is an edge between the vertices corresponding to the atoms on the bond, then a chain refers to a single connected component). Some proteins and protein complexes consist of several chains.
2
‘Secondary structures’ are the common structural fragments of proteins. There are 3 main types - helix, strand, and coil.
While our prototype workspace included a single TabletPC, there is no reason that each group member could not have their own tablet that allowed them to make their own selections.
7. EXAMPLE SCENARIO Professor Ligand is interested in the molecular interactions between a solved enzyme (or protein) found in pigs and a naturally occurring ligand (or small molecule) that is known to bind with and inhibit the function of this enzyme. It is his hope that an understanding of this interaction will help with the development of drugs for a related family of enzymes in humans. Until recently, only the unbound form of the human and the porcine enzymes have been known. Today, Dr. Ligand and his team have managed to successfully solve (via x-ray crystallography) the structure of the porcine enzyme bound to the known small molecule inhibitor. Dr. Ligand calls a meeting of the research team. The team members arrive carrying their laptop computers and sit down around the tabletop display. At the start of the meeting, one of Dr. Ligand’s graduate students loads the recently solved molecular structure onto the tabletop. While the complex compound initially appears as a cloud of white dots, another of Dr. Ligand’s students quickly modifies the appearance of the structure to highlight the bound molecule and the interaction site. This representation is then sent to one of the large wall displays. For comparison, the team then loads the unbound porcine form of the enzyme, and applies a similar color scheme to this molecule. It is sent to the second wall display for easy viewing by the team. Side-by-side, the difference between the bound and unbound forms of this protein is obvious even to a non-expert: the presence of the ligand has induced a hinge-like motion to close part of the protein’s binding site. The team centers the view on and rotates the view around one end of the bound ligand. Indeed, the “head” of the ligand is held in place by a trio of Lysine residues all of which have swung into place secondary to the motion of the hinge. By selecting and highlighting these residues in the unbound protein, the team is immediately able to see that they are close, but not neighboring in the unbound form of the porcine enzyme. By next displaying the unbound human enzyme, the team identifies a similar geometric arrangement of the binding site residues and explores the possibility that a similar hinge closure could be induced with the right small molecule. With this information gained, the team discusses a plan to identify such a small molecule inhibitor.
8. CONCLUSION This paper has presented the modification of the single-user single-display application Jmol for use in a multi-user multidisplay workspace. This adaptation was informed by the needs of groups working collaboratively and by previous research in human perception and visualization. The workspace presented in this paper is, today, atypical; however, as display costs fall and new display form factors become commonplace, multi-display tablecentric workspaces will become the norm. Our hope is that through the adaptation of existing tools to work in these spaces, we will gain valuable information that can inform the design of new tools built with these multi-user workspaces in mind.
9. REFERENCES
monitor users. in Proceedings of the working conference on Advanced visual interfaces, (Gallipoli, Italy, 2004), ACM Press, 32-39. 10. Javidi, B. and Okano, F. eds., Three-Dimensional Television, Video, and Display Technologies, Springer Verlag, 2002. 11. Jmol. http://jmol.sourceforge.net/ 12. Jolicoeur, P. The time to name disoriented natural objects. Memory & Cognition, 13. 289-303. 13. Levinthal, Cyrus (1966). Molecular Model-Building by Computer. Scientific American 214(6):42-52. 14. Molecular Biology Toolkit. http://mbt.sdsc.edu/
1. Ball, R. and North, C. Effects of tiled high-resolution display on basic visualization and navigation tasks. In CHI '05 Extended Abstracts on Human Factors in Computing Systems (Portland, OR, USA, April 02 - 07, 2005), 1196-1199.
15. North, C. and Shneiderman, B., Snap-together visualization: a user interface for coordinating visualizations via relational schemata. in Proceedings of the working conference on Advanced visual interfaces, (Palermo, Italy, 2000), ACM Press, 128-135.
2. CAVE (CAVE Automatic Virtual Environment). University of Illinois. http://inkido.indiana.edu/a100/handouts/cave_out.html
16. Okoshi, T. 1976. Three-Dimensional Imaging Techniques. Academic Press.
3. Czerwinski, M., Smith, G., Regan, T., Meyers, B., Robertson, G. and Starkweather, G., Toward Characterizing the Productivity Benefits of Very Large Displays. in Proceedings of Human-Computer Interaction – INTERACT 2003, (Zürich, Switzerland, 2003), 9-16. 4. Dietz, P. and Leigh, D. 2001. DiamondTouch: a multi-user touch technology. In Proceedings of the 14th Annual ACM Symposium on User interface Software and Technology (Orlando, Florida, November 11 - 14, 2001). UIST '01. ACM Press, New York, NY, 219-226. 5. Forlines, C., Esenther, A., Shen, C., Wigdor, D., and Ryall, K. 2006. Multi-user, multi-display interaction with a single-user, single-display geospatial application. In Proceedings of the 19th Annual ACM Symposium on User interface Software and Technology (Montreux, Switzerland, October 15 - 18, 2006). UIST '06. ACM, New York, NY, 273-276. 6. Greenberg, S., Sharing views and interactions with single-user applications. in Proceedings of the ACM.IEEE Conference on Office Information Systems, (Cambridge, Massachusetts, USA), 227-237. 7. Grudin, J., Partitioning Digital Worlds: Focal and Peripheral Awareness in Multiple Monitor Use. in Proceedings of the SIGCHI Conference on Human Factors in Computing Systems, (Seattle, Washington, USA, 2001), 458-465. 8. Hall SR, Allen FH, Brown ID (1991). The Crystallographic Information File (CIF): a new standard archive file for crystallography. Acta Cryst A47: 655-685. 9. Hutchings, D., Smith, G., Meyers, B., Czerwinski, M. and Robertson, G., Display space usage and window management operation comparisons between single monitor and multiple
17. The RCSB PDB. http://www.pdb.org/ 18. RasMol. http://www.umass.edu/microbio/rasmol/index2.htm. 19. Roberts, J.C., On Encouraging Multiple Views for Visualization. in Proceedings of IEEE Symposium on Information Visualization InfoVis’98, (Research Triangle Park, NC, USA, 1998), 8-13. 20. Streitz, N., Geißler, J., Holmer, T., Konomi, S., MüllerTomfelde, C., Reischl, W., Rexroth, P., Seitz, P., and Steinmetz, R.., i-LAND: An interactive Landscape for Creativity and Innovation. in Proceedings of the ACM Conference on Human Factors in Computing Systems, (Pittsburgh, Pennsylvania, USA, 1999), 120-127. 21. Tan, D. and Czerwinski, M., Effects of Visual Separation and Physical Discontinuities when Distributing Information across Multiple Displays. in Proceedings of OZCHI 2003 Conference for the Computer-Human Interaction Special Interest Group of the Ergonomics Society of Australia, (Brisbane, Australia, 2003), 184-191. 22. Tate, J. Structural bioinformatics - Chapter 7. Bourne, P. and Weissig, H. eds. John Wiley & Sons, Inc. 2003. 23. Tate, J., Moreland, J., and Bourne, P. (2001) Journal of Molecular Graphics 19, p280-287. Design and Implementation of a Collaborative Molecular Graphics Environment. 24. Wigdor, D., Shen, C., Forlines, C., and Balakrishnan, R. 2006. Table-centric interactive spaces for real-time collaboration. In Proceedings of the Working Conference on Advanced Visual interfaces (Venezia, Italy, May 23 - 26, 2006). AVI '06. ACM Press, New York, NY, 103-107.