Adaptive Automated Teller Machines – Part II Ghulam Mujtaba and Dr. Tariq Mahmood
Abstract—Nowadays, the banking sector is increasingly relying on Automated Teller Machines (ATMs) in order to provide services to its customers. Although thousands of ATMs exist across many banks and different locations, the GUI and content of a typical ATM interface remains, more or less, the same. For instance, any ATM provides typical options for withdrawl, electronic funds transfer, viewing of mini-statements etc. However, such a static interface might not be suitable for all ATM customers, e.g., some users might not prefer to view all the options when they access the ATM, or to view specific withdrawl amounts less than, say, ten thousand. Hence, it becomes important to data mine the ATM transactions in order to extract and understand useful patterns concerning the customers’ behaviors. In this work, we aim to address this requirement. This paper is the second one (Part II) in a series of two papers (Part I and Part II). In Part I, we have described the selection and pre-processing of an ATM transaction dataset (from an international bank based in Kuwait). We have also described its conversion into the MXML format, in order to data mine it through the ProM tool. In this paper, we import this MXML file into ProM and apply diverse types of data mining algorithms on it. Our results reveal that customers perform money-withdrawing transaction most frequently. Also, it is possible to design adaptive ATM interfaces which cater for the ATM terminal (location) at which the withdrawl is being made, the time of this withdrawl, the number of customers accessing the terminal at this time, and the range of money withdrawn in this time.
interaction process for their customers. For instance, the Graphical User Interface (GUI) shown to each customer remains the same. For instance, after authorization, a GUI showing a set of services is typically shown to each customer. If the customer chooses to withdraw money, then a typical GUI is shown which displays a set of fixed amounts for withdrawl. Moreover, the ATM shows these GUIs to the customers in a static manner, which might not be feasible for each customer. For instance, the bank statement is only shown when the customer makes a request for it, although it could be feasible to show this statement autonomously, e.g., at the start of the interaction if the customer prefers to see her statement immediately after authorization. It could be also feasible to show different withdrawl amounts to different customers, depending on their withdrawl behavior. Additionally, some customers might never want to conduct an electronic transfer. Hence, it would be feasible never to display this service to these customers.
I. BACKGROUND (OVERVIEW OF PART I)
N
OWADAYS, the banking sector is increasingly relying on the use of Automated Teller Machines (ATMs), in order to provide banking services to the customers (account holders). These services can include cash withdrawl of diverse amounts, electronic funds transfer, viewing of bank statements (e.g., showing the amount of withdrawls for a specific time period) etc. Figure 1 shows a typical ATM interface. Each ATM customer is provided with an ATM card. In order to access the ATM services, the card is inserted into a given slot. The customer then enters a PIN code, i.e., an authorization number which verifies the customer’s identity, and provides access to the bank’s services. In fact, typical ATMs support a quite rigid Manuscript received April 26, 2011. This work was supported in part by the Sukkur Institute of Business Administration (SIBA), under the grant for Higher Studies offered by the Higher Education Commission (HEC), Pakistan. Ghulam Mujtaba is a Lecturer at the Sukkur Institute of Business Administration, Sukkur IBA, Department of Computer Science, Airport Road, Sukkur, Pakistan (E-mail:
[email protected]). Dr. Tariq Mahmood is an Assistant Professor at the National University of Computer and Emerging Sciences (NUCES-FAST), National Highway, Karachi, Pakistan. (E-mail:
[email protected]).
Figure 1 A typical ATM interface In our work, we address these requirements by proposing the concept of adaptive ATM interfaces, i.e., GUIs which are adapted to the preferences of the ATM customers. To this end, it’s necessary initially to understand the behavior of the customers [1]. In this context, we have applied data mining techniques [2] on an ATM transaction dataset of a MiddleEastern bank located in Kuwait. This dataset originally comprises 10 million transactions generated by 5000 ATM customers. We divide our work in two parts, i.e., Part I and Part II. In the companion paper (Part I), we have described the process of data cleaning that we have applied on our dataset1. Specifically, through data cleaning techniques, we obtain a sample of 2 million transactions generated by 676 1
This was done to avoid irrelevant and redundant attributes (see Part I).
customers. We also apply attribute selection techniques [2] in order to reduce the number of attributes from 45 to 10. The resulting dataset contains 9018 transactions generated by 276 customers, from 17th September, 2009 till 1st December 2010. We then convert this data into MXML, i.e., an XML format that is required by the Process Mining (ProM) tool [3], in order to mine the transactions. For this conversion, we use the Nitro tool [4]. In Part I, we have also described the work related to our approach, and we have compared it with our approach. In this paper (Part II), we present the results of data mining, as obtained from the ProM tool. Our primary results indicate that the customers frequently perform three types of transactions, i.e., withdrawing of money, checking the balance of their accounts, and purchasing products through their ATM cards. However, the most frequent transaction is that of withdrawl, and in order to develop adaptive ATM interfaces, we have focused on this transaction only. We carry out this adaptation over four different dimensions, i.e., the time period of withdrawl, the range of money withdrawn at this time, the location of the ATM terminal at which withdrawls have been made, and the number of customers who have accessed the terminal at the given time. Such a multi-dimensional analysis can assist us in displaying different withdrawl amounts to the customers, based on the time, location, and their own frequency. This paper is structured as follows. In Section II, we will describe eight outputs of the ProM tool, related to the mining of our ATM MXML file. Finally, in Section III, we will present the conclusions and future work.
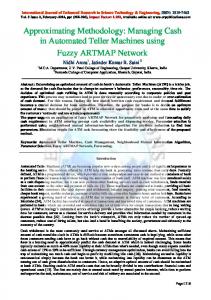
account balance), open-ended credit (acquiring loan as a credit on account), cash deposit (in the customer’s own account), PIN validation (on inserting the ATM card), ministatement request (a short version of the bank statement), open-ended cash (acquiring loan as cash), statement request, and PIN change (request to change PIN code). However, the most frequent of these transactions has been withdrawl (frequency of 5213), followed by purchase (1916), and current balance inquiry (1064). This trend can be further understood through Figure 2, which represents separate frequency distributions for (from top to bottom) withdrawl, balance inquiry and purchase. Here, the X-axis for each graph represents the customers (originator), and the Y-axis represents the frequency of the transaction in hundreds. The graph for withdrawl is most dense, i.e., has a high frequency of occurrence, followed by the graphs of purchase and balance inquiry respectively. In short, the customers use ATMs excessively for withdrawing money.
II. DATA ANALYSIS OF ATM MXML In this section, we employ eight different plug-ins of ProM in order to mine useful knowledge from our ATM MXML file. We discuss our results in the following eight sub-sections (from A-H). A. Generic Transaction Distribution Initially, we present a generic distribution of all ATM transactions, shown in Table 1. S. No Transaction Frequency 1 Withdrawal 5213 2 Purchase 1916 3 Current Balance Inquiry 1064 4 Open-Ended Credit 338 5 Own Account Cash deposit 201 6 PIN Validation 131 7 Mini-Statement Request 101 8 Open Ended Cash 34 9 Statement Request 10 10 PIN Change 10 Table 1 Generic distribution of ATM transactions Here, we see that 10 different types of transactions are performed by the customers, i.e., withdrawal of money, purchase of products, balance inquiry (query for the current
Figure 2 Individual Distributions for withdrawl, balance inquiry and purchase Originator by Task Matrix The ProM tool also allows us to obtain the distribution of transactions for each individual customer, through the Originator by Task Matrix plug-in. We employ this plug-in for withdrawl, balance inquiry and purchase, and show a snapshot of the output in Figure 3. The left-most column is the ID of the customer followed by the frequencies of balance inquiry, purchase and withdrawl respectively. These figures primarily indicate the customers who have carried out a particular transaction maximum, or minimum, number of times. In our work, we are currently designing interfaces which can adapt to this data. For instance, we see that the first customer in Figure 3 has performed balance inquiry 126 times, which is quite large as compared to all the other customers. So, for this customer, we can display a GUI which always shows the account balance in one corner of the B.
screen (in order to save her time). Similarly, we can see that several customers haven’t performed balance inquiry at all (frequency=0). So, we can choose not to show them the balance inquiry option directly in the initial list of ATM services2. Moreover, as customers use withdrawl excessively, we could show a GUI which shows only the withdrawl service when the customers are authenticated (rather than showing all the services). This could be done for the second customer in Figure 3, who has made a withdrawl 78 times. Finally, consider a frequent purchaser, e.g., the first customer in Figure 3 who has purchased 22 times. For such customers, we can choose to display a GUI that shows a mini-statement for recent purchases. As mentioned previously, we are currently designing GUIs which cater for these customers’ behaviors.
the statements have been requested by the customers after withdrawl, and after purchase. This also makes sense, since both withdrawl and purchase debit money from the account. So, after these operations, the customers are interested in viewing their statements, for instance, to view the pattern of their spending.
Figure 3 Distribution of withdrawl, balance inquiry and purchase for each individual customer
Figure 4 ATM transaction process mined by Alpha++ algorithm After viewing the statements, customers can again perform withdrawl, balance inquiry or purchase. Finally, the “End” junction shows that customers terminate their transactions only after performing one of these three transactions. In summary, the Alpha++ output illustrates the importance of the withdrawl, balance inquiry and purchase operations, and that customers keep track of their recent debit operations during these transactions.
C. Alpha ++ Algorithm The Alpha++ algorithm mines the process (at a generic level) that is implicitly present in the event logs (MXML file). This process is represented as dependencies (directed arcs) between events [3]. Figure 4 shows the output of the Alpha++ algorithm, when it is applied on our dataset. The generic ATM process comprises 5 (out of 10) transactions, i.e., withdrawl, balance inquiry, purchase, mini-statement request, and statement request. Each transaction has a “start” and “complete” event, signaling the start and end of this transaction. These events are represented collectively as a blue rectangle. The circles outside the rectangles represent junctions of process flow for modeling dependencies between events. The starting junction is labeled as “Start”. It represents the start of an ATM transaction (after PIN authorization). Also, the ending junction is labeled as “End”3, and it represents the end of an ATM transaction. From “Start”, we can see that customers either performed a purchase, withdrawl or a balance inquiry immediately after authorization. This verifies our previous result that these three are the most frequent operations. Moreover, both the mini-statements and 2 This could be inserted into the “Other Options” category, which indicates other ATM services. 3 In Figure 4, we have labeled “Start” and “End” transactions ourselves, for the sake of clarity.
D. Heuristic Miner The Heuristic Miner is a ProM plug-in that is more sophisticated than the Alpha++ algorithm. It uses heuristics to provide mathematical details about the dependencies illustrated by Alpha++ [3]. This information is displayed in a graphical structure called the heuristic net, which is very similar to a directed cyclic graph. In order to better understand the process mined by Alpha++ (Figure 4), we apply Heuristic Miner to our ATM dataset. The resulting heuristic net is shown in Figure 5. Here, each box represents a particular event, and the number within the box represents the frequency of this event. Also, a directed arc from event A to event B indicates that B occurred after A. Each arc is labeled with two numbers, and the bottom one indicates the frequency with which B occurred after A4. As compared to Alpha++, the heuristic net shows the “start” and “complete” events for withdrawl, 4
The upper number represents a probabilistic measure, and is outside the scope of this paper.
purchase and balance inquiry only. In other words, the transactions concerning the statement requests are not very crucial in the process of our ATM dataset.
E. Transaction-based Customer Distribution We have employed ProM in order to determine the distribution of customers, i.e., the frequency of customers who have performed one or more transactions, either individually or collectively. These statistics are shown in Figure 6. We first define the labels on the x-axis. WD, PR and BI represent customers who have only made a withdrawl, purchase, and balance inquiry respectively. Also, WD-PR, WD-BI, PR-BI, and WD-PR-BI represent customers who have made both a withdrawl and purchase, a withdrawl and balance inquiry, a purchase and balance inquiry, and all three of withdrawl, purchase and balance inquiry respectively. Finally, the label “None” represents those customers who didn’t perform any transaction. The yaxis in Figure 6 represents the amount used in a given transaction.
Figure 5 Heuristic net mined for the ATM dataset
Besides this, Figure 5 shows that a total of 2732 withdrawals have been performed, out of which 2044 have been performed one after another, 309 have been performed after balance inquiry, and 269 have been performed after purchase5. Moreover, balance inquiry was performed 565 times, out of which 221 were performed after withdrawl, and 129 times after purchase. Finally, purchase was performed 858 times, out of which 353 were performed after withdrawl, 59 times after balance inquiry, and 438 times after purchase. From the above, we can conclude that customers employ ATM excessively for a sequence of withdrawl operations. Moreover, customers can make a sequence of purchases as well as balance inquiries. Also, many customers (309) make a withdrawl after a balance inquiry. In fact, it seems logical to check the balance before withdrawing money. However, almost the same number of customers (269) withdraw money also after making a purchase. This implies that many customers do not check their balances before making a withdrawl, due to, e.g., lack of time, previous knowledge about the expected balance etc. We are currently employing this knowledge in order to develop adaptive ATM interfaces, e.g., those that display only different withdrawl options, considering its frequency (refer to Section future work).
5 These three add up to 2622, and the remaining 110 withdrawl transactions were performed after some other type of transaction, but the Heuristic miner has not deemed these transactions as crucial to the process of ATM transaction dataset.
Figure 6 Transaction-based customer distribution The graph shows that the maximum number of users carried out all three operations (92), followed by the customers who performed only withdrawl (91). In other words, a majority of customers either perform all three operations, or they perform only withdrawl. There are hardly any customers who perform only purchase or balance inquiry (3 and 2 respectively), or those who perform both of them (0). Also, 63 customers perform only withdrawls combined with a check of their balance, while 25 of them perform only withdrawls along with making purchases. Also, every customer performed some transaction. These results basically show that the customers frequently use all the three basic ATM services of withdrawing money, inquiring their balance, and purchasing products. However, a majority of customers also use ATM only for withdrawing money. A possible GUI that adapts to these results is one that displays only withdrawl options to the customers, immediately after PIN authorization. This GUI can also display the balance in one corner of the screen, along with a link for displaying the purchase history, since these two actions are also performed frequently. F. Amount Distribution We have also employed ProM in order to determine the distribution of the amount withdrawn by the customers. The results are shown in Figure 7. Here, the X-axis shows the amount in Kuwaiti Dinar (KD), and the Y-axis shows the
frequency of the withdrawn amount. The distribution shows that the amount of 100 KD has been withdrawn a maximum number of times (around 900), while amount of 10 KD and 20 KD have been withdrawn around 500 times. Moreover, the amounts of 50 KD, 70 KD, 80 KD and 200 KD have been withdrawn between 300 – 350 times.
amounts between 70 KD and 140 KD for the customer in Figure 9. H. Location-based Amount Distribution Our final mining output is related to the location of ATM terminals. For this, let us consider Table 2, which shows a snapshot from the amount withdrawl distribution along four dimensions, i.e., the one-hourly time period of withdrawl, the count of customers making the withdrawl in this time, the location (ATM terminal) where withdrawls were made in this time, and the range of amount withdrawn in this time (maximum amount – minimum amount).
Figure 7 Amount distribution of withdrawl Customers have also withdrawn more than 100 KD, and very small amounts, e.g., 1KD and 2KD, as well. From Figure 7, we can see that the most common withdrawls have been of 100 KD, and it outsmarts the frequency of all other withdrawls. We can adapt to this result by designing an ATM interface that offers a withdrawl of only 100 KD to the customer. For instance, we can provide this option towards the top of any GUI being viewed by the customer (as it is a very frequent transaction). Similarly, we can avoid displaying the withdrawl amounts that have a low frequency, e.g., 160 KD, 170 KD, 190 KD etc. G. Customer-based Amount Distribution We also found it useful to analyze the amount distribution of individual customers through ProM. This helped us in understanding the actual behavior of the customers, as compared to the generic distribution shown in Figure 7. For instance, Figure 11 shows the amount withdrawn by customer having the ATM card number 5211759990688306, along with the timestamps. We can see that, over a period of two months, the customer has withdrawn 60 KD first time, then 70 KD, 60 KD, 50 KD, 50 KD and finally 60 KD. More specifically we can infer that the customer has withdrawn only three different type of amounts, i.e. 50 KD, 60 KD and 70 KD. Figure 9 shows another example of amount withdrawn by customer having ATM card number 5211759991090015. It shows that this customer has only withdrawn two different types of amounts, i.e., 70 KD and 140 KD, over a period of two days. Such data can be used to adapt the ATM interactions for individual customers. Specifically, for each customer, we can display only those withdraw amounts which he frequently withdraws from the ATM, e.g., a set of
Figure 8 Amount distribution for customer with ATM card number 5211759990688306 In Table 2, we have shown ATM terminals located at four different locations in Kuwait, i.e., L1, L2, L3, and L46. In fact, there are a total of 16 locations and 24 one-hourly time periods (for one complete day)7. So, we have data about the range of amount withdrawn at a given hour, along with the number of customers who accessed the ATM in this hour. Moreover, we can acquire this data for each location. For instance, Table 2 shows that at location L4, around 100 customers access the ATM between 6AM and 8AM, and withdraw amounts in the range 1KD-1000KD. Similarly, at location L1, around 200 customers access the ATM between 12AM and 2AM, and withdraw amounts in the range 1KD500KD. Such an analysis can assist us in developing adaptive interfaces separately for each location. For instance, we can display withdrawl amounts between 1KD and 1000KD at L4, and between 1KD and 500KD at L1, at their respective times. Also, these interfaces can change with 6 7
We do not name these locations for the sake of privacy. We don’t show this complete distribution due to space constraints.
time. For instance, the displayed withdrawl amounts at L1 for the time 12AM to 2AM could be different from those displayed from 6AM to 8AM. Finally, if we know that only a few customers access an ATM at a given hour, we can perform maintenance work on the ATM (if needed) at this hour. For instance, maintenance work can be performed at L3 from 4AM to 5AM, as only 9 customers have accessed L3 at this time.
Figure 9 Amount distribution for customer with ATM card number 5211759991090015
Withdrawal Transaction Time Count Location Minimum Amount Maximum Amount 12:00 AM TO 1:00 AM 120 L1 1 KD 500 KD 1:00 AM TO 2:00 AM 81 L1 1 KD 300 KD 2:00 AM TO 3:00 AM 64 L2 1 KD 185 KD 3:00 AM TO 4:00 AM 34 L2 2 KD 350 KD 4:00 AM TO 5:00 AM 9 L3 01 KD 615 KD 5:00 AM TO 6:00 AM 38 L3 01 KD 820 KD 6:00 AM TO 07:00 AM 36 L4 01 KD 1000 KD 7:00 AM TO 8:00 AM 77 L4 01 KD 500 KD Table 2 Snapshot of the withdraw distribution along four dimensions (time period, count, location and amount) III. CONCLUSIONS AND FUTURE WORK In this work, we have performed comprehensive data mining on an ATM transaction data set, related to an international bank based in Kuwait (Middle-East). We divided this work into two parts, i.e., Part I and Part II. In Part I (companion paper), we described the application of data cleaning techniques on the ATM dataset, in order to remove noisy attributes [2]. Then, we used the Nitro tool [4] in order to convert the cleaned data into a novel XML format called MXML. Using MXML, we can mine the transaction dataset
through the open-source ProM tool [3]. In Part II (this paper), we present comprehensive results related to this mining process. Specifically, we show that ATM customers frequently perform three types of transactions, i.e., withdrawing of money, inquiring about their account balance, and purchasing products by paying through their ATM cards. However, the most frequent transaction performed by the customers is the withdrawl of money. Therefore, we have directed the mining process of ProM to this transaction only. Our results reveal that, in this regard, a multi-dimensional adaptation is possible, i.e., it is possible to design adaptive ATM interfaces that adapt to the location of the ATM terminal at which the customer withdraws money, the time and amount of this withdrawl, and the number of customers who withdraw the money at this specific time. Our most concrete output is the development of ATM GUIs8 which show different amounts of withdrawl to different customers, based on the time, location and the frequency of customers at this location. For instance, suppose that customers extract between 1KD and 300 KD, from 8AM to 10AM, at some location L, and between 50KD and 600KD from 4PM to 6PM at the same location. Then, from 8AM to 10AM, L could employ an adaptive interface that shows withdrawl amounts between 1KD and 300KD, and from 4PM to 6PM, it could show a different interface showing withdrawl amounts between 50KD and 600KD. Moreover, if some location is not frequented by many customers at a given time, the managers can decide to either close it for service/repair at this time, or to permanently remove it from service (since it’s not generating enough customer activity). Besides this, we can also develop adaptive interfaces that always show the current balance, or the customer’s purchase history, at the top of each ATM GUI. This is important because purchasing and balance inquiring are also frequent transactions. Finally, there are some transactions that are accessed by the customers quite rarely, e.g., open-ended cash transactions. We can avoid showing these services directly to the customers, for instance, by grouping them in “Other Services” options. Based on these results, we are currently developing a set of adaptive ATM interfaces as outlined above. Our bank has agreed to test these interfaces at several of their locations. REFERENCES [1] Khawaja, K.F. Manarvi, I., “Evaluating customer perceptions towards ATM services in financial institutions; A case study of Pakistani Banks”, Computers & Industrial Engineering, 2009. [2] J. Han and M. Kamber, Data Mining: Concepts and Techniques, 2 nd Ed., Morgan Kaufmann Publishers, ISBN 1-55860-901-6, March 2006. [3] W.M.P. van der Aalst., “The application of petri nets to workflow management”., The Journal of Circuits, Systems and Computers, 8 (1):2166, 1998. [4] Nitro Flux Capactitor, http://fluxicon.com/blog/2010/09/nitro/, 2011.
8
This is a work-in-progress.
Fluxicon,