Abstract: In this paper we study the comparison between the efficiency of Adaptive censoring Post detection Integration Constant False Alarm Rate (API CFAR).
BULGARIAN ACADEMY OF SCIENCES CYBERNETICS AND INFORMATION TECHNOLOGIES · Volume 5, No 1 Sofia.2005
Adaptive Censoring CFAR PI Detector with Hough Transform in Randomly Arriving Impulse Interference* Christo Kabakchiev, Ivan Garvanov, Lyubka Doukovska Institute of Information Technologies, 1113 Sofia
Abstract: In this paper we study the comparison between the efficiency of Adaptive censoring Post detection Integration Constant False Alarm Rate (API CFAR) detector and Hough detector with non-coherent integration in randomly arriving impulse interference. We assume that the target echo signal fluctuates according to a Swerling II case model, the randomly arriving impulse interference is with a Poisson distribution of the probability for appearance and a Rayleigh distribution of the amplitudes. The profits (losses) are determined as a statistical estimation by means of the probability characteristics of both types of detectors, obtained in Matlab. In the present paper, for comparison with respect to other patterns researched by other authors, the full formula that determines the probability of target detection is used. The profits of the Hough detectors are calculated for different values of false alarm probability, a different number of observations in the reference window, an average interference-to-noise ratio (INR) and a probability for appearance of randomly arriving impulse interference with average length in the cells in range. Our results show that Hough transform is efficient in conditions of decrease of randomly arriving impulse interference. Keywords: radar detector, API CFAR detector, randomly arriving impulse interference, probability of detection, probability of false alarm, detectability profits (losses).
1. Introduction In the modern radar, the target detection is declared if the signal value exceeds a preliminary determined adaptive threshold. The current estimation of the noise level in the reference window forms the threshold. As an estimate of the noise level is often *This work is supported by the Bulgarian National Science Fund under Grant No TH-1305/2003 and IIT – BAS, No 010059/2004.
115
used the estimate proposed by Finn and Johnson in [1]. Averaging the outputs of the reference cells surrounding the test cell forms this estimate. Thus a constant false alarm rate is maintained in the process of detection. The detection performance of CFAR processors with post detection integrator is proposed by Hou in [2] for the case of homogeneous environment and chi-square family of fluctuating target models (Swerling I, II, III, IV). During the last few years, mathematical methods for extraction of useful data about the behavior of observed targets by mathematical transformation of received signals are widely used for the design of new highly efficient algorithms for processing radar information. Such a mathematical approach is the Hough Transform (HT). The concept of using HT for improving the target detection in white Gaussian noise is introduced by Carlson, Evans and Wilson in [3-5]. This approach is used by Carlson in [5], for a highly fluctuating target – Swerling II type target model, and stationary homogeneous interference. In [6], using the approach in [5], for detection performance in Hough space are obtained for two types of target models, fast fluctuating target Swerling I case and slowly fluctuating target – Swerling III case under conditions of stationary interference with known or unknown intensities. The Hough transform of the data obtained from the Excision Cell Averaging Constant False Alarm Rate with Binary Integration (EXC CA CFAR BI) detector for several past scans and binary integration of the performed data in Hough parameter space additionally improve target detection in conditions of randomly arriving impulse interference [7]. The efficiency of such an adaptive Hough detector with binary integration is analyzed in [7]. In [8] a new CA CFAR Hough detector where signal detection is realized by a CA CFAR detector with adaptive non-coherent pulse-topulse integration is proposed. In our paper, we study the situation for detection on a highly fluctuating target Swerling II type target model in conditions of randomly arriving impulse interference. In [6-8] the detectability losses are calculated when compared to detectors in condition of pulse jamming and without pulse jamming. In our paper we compare API Hough detector with optimal detector, using the approach from [9]. In [8] the higher efficiency of AHBI and Cell Averaging Constant False Alarm Rate with Binary Integration (CA CFAR BI) is shown in strong pulse jamming, indirectly. The comparison between the two patterns is made separately for every one without pulse jamming. The choice of the most efficient pattern supposes a comparison towards a total model, for example the optimal detector [9, 10] or one towards another. For comparison, we use the approach by Rohling for calculation the losses [10]. In this paper we research the efficiency of HT API CFAR processor in randomly arriving impulse interference for PD=0.5. We estimate the efficiency of HT API CFAR with the method from [8], i.e. the sensibility towards randomly arriving impulse interference, the efficiency towards API CFAR detector. These estimates allow the comparison of HT API CFAR with respect to API CFAR and the comparison in relation to other patterns studied by other authors. This paper combines the results of a broad research of the losses (profits), when using several types of detectors, carried out in some previous contributions of the team [6, 11]. In the present research the results of the comparative analysis of the proposed in [8, 12] Hough detector with non-coherent integration in randomly arriving impulse interference is considered. 116
To achieve a constant value of the probability of false alarm (PFA), in this paper, the value of the threshold constants, when guaranteeing it, are determined for different number of observations in the reference window, an average interference-to-noise ratio (INR) and probability for appearance of randomly arriving impulse interference with average length in the cells in range. The losses (profits) of the Hough detectors are calculated for different values of false alarm probability, a different number of observations in the reference window, an average interference-to-noise ratio (INR) and probability for appearance of randomly arriving impulse interference with average length in the cells in range. Our results show that Hough transform is efficient under conditions of decrease randomly arriving impulse interference. In conditions of randomly arriving impulse interference with parameters: INR=30 dB, probability of appearance 0.1 and false alarm probability Pfa=10–4, the usage of CA CFAR causes losses in the average detection threshold (ADT) of some 60 dB, [14]. Under the same conditions, adding binary integration with rule M/N=16/16, ADT diminishes to 15 dB, [14]. Using API CFAR detector instead of binary integration diminishes ADT to 5-6 dB, [14]. If applying the Hough transform after API CFAR detector with optimal threshold ТМ=13, ADT are reduced to –2.5 dB.
2. Signal model in randomly arriving impulse interference Let us assume that L pulses hit the target, which is modeled according to Swerling case II. The received signal is sampled in range by using M+1 resolution cells resulting in a matrix with M+1 rows and L columns. Each column of the data matrix consists of the values of the signal obtained for L pulse intervals in one range resolution cell. Let us also assume that the first M/2 and the last M/2 rows of the data matrix are used as a reference window in order to estimate the “noise-plus-interference” level in the test resolution cell of the radar. In this case the samples of the reference cells result in a matrix X of the size ML. The test cell or the radar target image includes the elements of the M/2+1 row of the data matrix and is a vector Z of the length L. In the presence of randomly arriving impulse interference the elements of the reference window are drawn from two classes. One class represents the noise only with the probability 1–ε0. The other class represents the interference-plus-noise with the probability ε0. The elements of the reference window are independent random variables with the compound exponential distribution law (1)
f (x ) i
1 0
0
x exp i 0
x 0 , i 1, , N , i exp (1 r ) (1 r ) 0 j j 0
where N=ML and λ0 is the average power of the receiver noise, rj / λ0 is the average per pulse value of the interference-to-noise ratio (INR) at the receiver input, ε0 is the probability for the appearance of randomly arriving impulse interference with average length in the range cells. In the presence of a desired signal from a target the elements of the test resolution cell are independent random variables with the following distribution law: x 1 0 0 x0l , l 1, , L , 0l (2) f (x ) exp exp 0l 0 (1 s) (1 s) 0 (1 rj s) (1 rj s) 0 0 117
where s is the per pulse average signal-to-noise ratio, λ0 is the average power of the receiver noise, rj is the average interference-to-noise ratio, ε0 is the probability for the appearance of randomly arriving impulse interference with average length in the range cells.
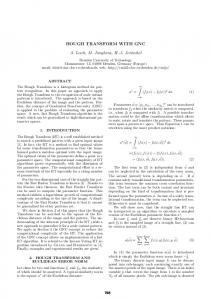
3. Statistical analysis of API CFAR detector in randomly arriving impulse interference Before pulse-to-pulse integration, we can censor the elements of the reference window and the test resolution cells in order to form the adaptive threshold (Fig. 1). For realizing this, we will use the adaptive censoring algorithm proposed in [13]. According to this algorithm, all elements with high intensity of signal are removed from the reference window and the test resolution cell. SLD
xM ,... , xM/2+1 x01 xM/2 ,..., x1
S O R T
SLD
xM ,... , xM/2+1 x02 xM/2,... ,x1
A N D
l*
q x 1 0
xM ,.. ,. xM/2+1 x0L xM/2 ,…,x1
SLD
SORT AND CENSOR x 1 x 2 ,… , x ML
l 1
C E N S O R
0l
1 0
k*
V xi1
TAPI
i 1
Fig. 1. Block-diagram of active adaptive post detection integration (API) CFAR processor
The censoring algorithm consists of the two stages. Stage 1. The elements of the reference window x x1 , x 2 ,..., x N and the test resolution cell x 0 x 01 , x 02 ,..., x0 L are rank-ordered according to increasing magnitude: (3) x11 x 2 1 ... xi 1 ... x N 1 and x 011 x02 1 ... x0i 1 ... x0 L 1 . Stage 2. Each of the so ranked elements is compared to the adaptive threshold, according to the following rule: (4)
x x 1 xi11 s ix Ti x , i 1,..., N 1 , and xl 1 s l 0 Tl 0 , l 1,..., L 1 ,
i
l
m 1
m 1
x 1 x 1 where s i x m and s l 0 x 0 m .
118
x The scale factors Ti x and Tl are determined in accordance with the given level of cen probability of false censoring (PFA ), as in [12]: 0
(5)
N L 1 1 cen cen PFA . and PFA x x i l i [1 Ti N i ] l [1 Tl L l ] 0
The recursive procedure is stopped when the condition (4) becomes true. In this way the samples of the reference window and the test resolution cell are divided into two parts: (6)
X 1 x11,..., x k1 x k11 ,..., x N1 and Z 1 z11,..., z l1 zl11 ,..., z L1 .
The first part contains the “clean” elements, i.e. without randomly arriving impulse interference. All these elements can be used for calculating the estimate V and the summed signal q0: k*
l*
V x n and q0 x 01n .
(7)
1
n 1
n 1
Then the target is detected according to the following algorithm: H 1 : q0 VTAPI , H : q VT , (8) 0 0 API where H1 is the hypothesis that the test resolution cell, i. e. Z , contains the echoes from the target and H0 is the hypothesis that the test resolution cell, i. e. Z contains the receiver noise only. The constant TAPI is a scale coefficient, which is determined in order to maintain a given constant false alarm rate (CFAR). After the end of the recursive procedure, it is assumed that most or all of the random impulses interferences are in the second part of the reference window and the test resolution cell. In [8] API CFAR detector is studied using Hough transform with expression for the probability of detection as in [12]. In this paper we propose the more general expression for the probability of target detection in the presence of Poisson distribution, randomly arriving impulse interference may be calculated as in [14]: i 1 s L L l 1 k i 1 T N k l API P 1 N k 1 L l k i D 0 0 0 0 i 0 k 1 k l 1 l i TAPI 1 s N N L 1 k i 1 k k k i T i 1 r s T 1 r s 1 N k L 0 0 0 API j API j k 1 k i 0 i N N i 1 s L L l 1 N i 1 1 s l L l N T i 1 T 0 0 0 i 0 API API l 1 l i 1 r 1 r j j N N i 1 r s 1 r s L 1 N i 1 j j T T i N L . 0 0 i 0 API API i 1 r 1 r j j k
(9)
N
119
The probability of false alarm of the API CFAR detector is evaluated by (9), setting s0.
4. Structure of Hough detector The Hough transform maps points from the observation space termed as range-time data space, i.e. r–t space, into curves in Hough parameter space termed, i.e. – space, by (10)
= rcos+ tsin ,
where r and t are coordinates, measured from the origin of the r and q axis in the lower left. The mapping can be viewed by stepping through from 0 to 180 and calculating the corresponding r. The result of transformation is a sinusoid with a magnitude and phase depending on the value of the point in rt space. Each of the points in Hough parameter space corresponds to one line in rt space with parameters and . Each of the sinusoids corresponds to a set of possible lines through the point. If a line exists in the rt space, by means of Hough transform it is represented as a point of intersection of sinusoids defined by Hough transform. The rt space is divided into cells, whose coordinates are equal to range resolution cell number in range and to the scan number in the history – in time. The parameters and have the linear trajectory in Hough parameter space could be transformed back to rt space showing the current distance to the target. Using Binary Integration (BI) of data in Hough parameter space shows the general structure of an adaptive Hough detector by using binary integration of data in Hough parameter space in Fig. 2. Constant False Alarm Rate Detector
r–t space formation
Hough transforms and – space formation
Binary integration and target detection TM M
API CFAR TAPI
Fig. 2. The general structure of an adaptive Hough detector
After NS radar scans 2D dimensional rt space of data is formed at the output of the signal detector. The coordinates of those cells in rt space where the detection is indicated are Hough transformed according to (10). In this way Hough parameter space is formed. Each cell from Hough parameter space is intersected by a limited set of sinusoids obtained by Hough transform. If the number of intersections in any of cells in parameter space exceeds a fixed threshold TM , target detection and linear trajectory detection are indicated. Target and linear trajectory detection is carried out for all the cells of Hough parameter space.
120
5. Statistical analysis of Hough detector in randomly arriving impulse interference Calculating both basic probability characteristics carries out statistical analysis of the Hough detector: PFAHough probability of false trajectory detection and PDHough probability of true trajectory detection. All indications for signal detection obtained from NHough range resolution cells and Ns scans are arranged in a matrix of the size NHough Ns in r–t space. In this space stationary or constant radar velocity target appears as a straight line which consists of nonzero elements of . Let as assume that ijnm is a set of such nonzero elements of that constitute a straight line in r–t space that is i, j ijnm . This line may be represented in Hough parameter space as a point (n, m). Denoting Nnm as the maximal size of nm , the cumulative false alarm probability for a cell (n, m) is written ij according to [5]: N N P nm nm P FA FA l T l
1 P
nm
(11)
l
N nm l
FA
,
M
where TM is the threshold for the binary Hough integrator. The total false alarm probability in Hough parameter space is equal to one minus the probability that no false alarm occurred in any of the Hough cell. For independent Hough cells this probability is: max( N
(12)
nm
)
P Hough 1 1 P nm FA fa N nm TM
W (N
nm
)
,
where max(Nnm) is the accessible Hough space maximum and W(Nnm) is the number of cells from Hough parameter space whose values are equal to Nnm. The cumulative probability of target detection in Hough parameter space PDHough cannot be written in the form of a simple Bernouli sum. As a target moves with respect to the radar, the SNR of the received signal changes depending on the distance to the target and the probability of target detection PD(j) changes as well. Then the probability PDHough can by calculated by Brunner’s method. Let PD(j) be the primitive probability of detection from the j-th time scan and P(i, j) be the cumulative probability of getting exactly idetection from j looks at the target. Then we have:
P(i, j ) 1 P ( j) .P(i, j 1) P ( j ).P(i 1, j 1), P(0, j ) 1 P ( j ) .P(0, j 1), D
(13)
D
D
P( j, j ) PD ( j ).P( j 1, j 1).
By means of Brunner’s method we obtain a matrix of size 2020, the elements of which are the primitive probability of detection from the j-th time slice [5]. Using (9) we can get all the P(i , j) needed to calculate PDHough . For Ns scans we have: 121
NS
P Hough P (i , N ). D D s
(14)
i TM
There are not many cases in practice when radar is equipped with a Hough detector working in randomly arriving impulse interference. In such situations it would be desirable to know the Hough losses depending on the parameters of the randomly arriving impulse interference, for rating the behavior of the radar. For the calculation of Hough detector losses, we use the ratio between the two SNR, for a Hough detector and an API CFAR detector, measured in dB, presented in the expression: SNR
(15)
dB 10 log
HOUGH
SNR API
under PFA const , PD PDHough PDAPI 0.5.
The comparisons are made and towards API CFAR in randomly arriving impulse interference and for a Hough detector in randomly arriving impulse interference.
6. Simulation results In order to analyze the quality of Hough detector we consider a radar with the following parameters like in [5]: the search scan time is 6 s; the range resolution is R=3nmi (1nmi = 1852 m); the beam range time space has 128 range cells and 20 time slices, and the Hough space is 260 -cells by 91 -cells; the length of a references windows in the API CFAR detector are 16 and 32. We consider a straight line, incoming target with a speed of Mach 3 and 1 m2 radar cross section. The results of calculating are obtained for the following variants of randomly arriving impulse interference environment: INR=30 dB, 0 = (0; 0.01; 0.033; 0.066; 0.1). In the analysis the SNR average value is calculated as S=K/R4, where K=0.161010 is the generalized energy parameter of the radar and R is the distance to the target measured in nautical miles. The threshold constant in Hough parameter space is TM=2. The API CFAR detector behaviour in different values of the test resolution cells L was deeply analyzed. The following figure shows efficiency (the profit) of using double sized L (L=16 and L=32). This is performed for API CFAR detector, in conditions of randomly arriving impulse interference and constant probability of false alarm. SNR profits of the API CFAR detector are presented in Fig. 3 for target model SW2 in dB, made for two values of number of test resolution cells. INR is rj=30 dB, the number of reference cells is N=16 and the number of test resolution cells is L=16 and L=32, the probability of false alarm is PFA = 10–4; 10–6; 10–8. In the present paper we offer Hough transform for improvement the API CFAR detector. A similar approach is proposed in [8], but in this work approach for losses estimation in API Hough detector offered in [10] is not included. In this paper we keep a constant probability of false alarm in the output of API Hough detector. An analysis of behavior of API Hough detector in different values of the number of test resolution cells was performed. In Fig. 4 SNR profits are shown by using of the Hough detector for target SW2, in dB, made for two values of number of test resolution cells. INR is rj=30 dB, number of reference cells is N=16, number of test resolution cells is L=16 and L=32, probability 122
Fig. 3. SNR profits of the API CFAR detector for two values of number of test resolution cells, L=16 (solid line) and L=32 (dash-dot line)
Fig. 4. SNR profits of the API Hough detector for two values of number of test resolution cells, L=16 (solid line) and L=32 (dash-dot line)
of false alarm in output of the API Hough detector is PFA= 10–4; 10–6; 10–8 and value for threshold in Hough parameter space TM=2. In conclusion, a comparative analysis of the API CFAR detector and API Hough detector working in randomly arriving impulse interference was performed. The profits of the Hough detector in randomly arriving impulse interference are determined with respect to API CFAR detector, following the algorithm proposed in [10], for probability of detection (PD=0.5). The dependence of the profits, on the average interference-to-noise ratio (INR) and the number of reference cells for different values of the number of test resolution cells and different values of the probability of false alarm and probability of appearance of randomly arriving impulse interference with average length in the range cells, are shown in Fig. 5 and Fig. 6. Profits of the Hough detector are shown in Fig. 5 and Fig. 6 compared to the API CFAR detector, in dB. INR is 30 dB, number of reference cells is N=16 and number of test resolution cells are L=16 and L=32, probability of false alarm is PFA= 10–4; 10–6; 10–8 and value for threshold in Hough parameter space TM=2. Fig. 7 shows different values of detection threshold in Hough parameter space TM. The optimal value for this threshold is TM =13 by values of the probability for the appearance of randomly arriving impulse interference with average length in the range cells, ε0=0 and ε0=0.1. In [5], to determine the threshold in the Hough parameter space, the authors use approach proposed by Barton in [15]. They assume TM=7 as an optimal threshold in the binary integration and apply it in the Hough parameter space. In this paper after an iterative analysis, the optimal threshold in the Hough parameter space is determined to be TM=13. Fig. 8 indicates the profits of using the API Hough detector calculated for optimal value of detection threshold TM=13 and for a value TM=2, compared to the API CFAR detector, for number of test resolution cells L=16 and a value for probability of false alarm is PFA = 10–4.
123
Fig. 5. Profits of the API Hough detector (solid line) compared to the API CFAR detector (dashed line) for L=16
Fig. 6. Profits of the API Hough detector (solid line) compared to the API CFAR detector (dashed line) for L=32
Under conditions of strong flow from impulse interference, the usage of fixed threshold detector or CFAR requires ADT of some 60 dB. Adding binary integration diminishes the ADT to 15 dB. Usage of API CFAR detector requires ADT to 5-6 dB. Additional Hough transform diminishes the ADT to –2.5 dB.
Fig. 7. Average detection threshold of the Hough detector compared to the optimal detection threshold in Hough parameter space
Fig. 8. Profits of the API Hough detector (dashed line), for optimal value of detection threshold TM=13 and for value TM=2, compared to the API CFAR detector (solid line) for L=16
7. Conclusions In this paper we propose a more general expression for the probability of target detection. In the presence of Poisson distribution, under conditions of randomly arriving impulse interference, the probability may be calculated as in [14]. In [7] API CFAR detector was considered using Hough transforms in pulse jamming. In this case the probability of detection is calculated after good censoring. 124
The Carlson’s approach, using the Brunner’s method for calculating the probability of detection in Hough parameter space, was developed further in order to maintain constant false alarm probability on the output of the Hough detector. The suitable scalar factor was chosen iteratively. The influence of the threshold constant of the required signal to noise ratio was studied. This investigation was done for probability of detection (PD=0.5) and different values of probability for appearance of randomly arriving impulse interference with average length in the cells in range. The optimal threshold values were evaluated for different input situations. The value of the test resolution cell and the probability of false alarm over mean detection threshold were studied. The profits of using API Hough detector with an optimal value of detection threshold TM=13, compared to the API CFAR detector are about 7 dB. The results obtained in this paper could be practically used in radiolocation and radiocommunication networks.
References 1. F i n n, H., R. J o h n s o n. Adaptive Detection Mode with Threshold Control as a Function of Spatially Sampled Clutter Estimation. – RCA Review, 29.3.1968, 414-464. 2. H o u, X., N. M o r i n a g a, T. N a m e k a w a. Direct Evaluation of Radar Detection Probabilities. – In: IEEE Trans., Vol. AES-23, 1987, No 4, 418-423. 3. C a r l s o n, B., E. E v a n s, S. W i l s o n. Search Radar Detection and Track with the Hough Transform. Part I. – In: IEEE Trans., Vol. AES-30,1994, No 1, 102-108. 4. C a r l s o n, B., E. E v a n s, S. W i l s o n. Search Radar Detection and Track with the Hough Transform. Part II. – In: IEEE Trans., Vol. AES-30, 1994, No 1, 109-115. 5. C a r l s o n, B., E. E v a n s, S. W i l s o n. Search Radar Detection and Track with the Hough Transform. Part III. – In: IEEE Trans., Vol. AES-30, 1994, No 1, 116-124. 6. B e h a r, V., C. K a b a k c h i e v, L. D o u k o v s k a. Target Trajectory Detection in Monopulse Radar by Hough Transform. – Compt. Rend. Acad. Bulg. Sci., 53, 2000, No 8, 45-48. 7. B e h a r, V., B. V a s s i l e v a, C. K a b a k c h i e v. Adaptive Hough Detector with Binary Integration in Pulse Jamming. – ECCTD’97, Budapest, 1997, 885-889. 8. B e h a r, V., C. K a b a k c h i e v. Hough Detector with Adaptive Non-Coherent Integration for Target Detection in Pulse Jamming. – In: IEEE Fifth Inter. Symp., ISSSTA’98, Sun City, South Africa, 1998, 1003-1008. 9. G a n d h i, P., S. K a s s a m. Analysis of CFAR Processors in Non-Homogeneous Background. – In: IEEE Trans., Vol. AES-24, 1988, No 4, 443-454. 10. R o h l i n g, H. Radar CFAR Thresholding in Clutter and Multiple Target Situation. – In: IEEE Trans., Vol. AES-19, 1983, No 4, 608-621. 11. K a b a k c h i e v, C., L. D o u k o v s k a, I. G a r v a n o v. Comparative Analysis of Loses of CA CFAR Processors in Pulse Jamming. Cybernetics and Information Technologies, 1, 2001, No 1, 21-35. 12. B e h a r, V., C. K a b a k c h i e v, L. D o u k o v s k a. Adaptive CA CFAR Processor for Radar Target Detection in Pulse Jamming. – Journal of VLSI Signal Processing, 26, 2000, 383-396. 13. G a r v a n o v, I., C. K a b a k c h i e v. Sensitivity of API CFAR Detectors Towards Change of Input Parameters of Pulse Jamming. – In: Proc. of the International Radar Symposium – IRS 2004, Warszawa, Poland, 2004, 233-238. 14. G a r v a n o v, I., V. B e h a r, C. K a b a k c h i e v. CFAR Processors in Pulse Jamming. – In: 5th International Conference, NM@A 2002, Borovets, Bulgaria. Berlin Heidelberg, Springer-Verlag, LNCS 2542, 2003, 291-298. 15. B a r t o n, D. K. Modern Radar System Analysis. Norwood. MA, USA, Artech House Inc., 1988.
125