Adaptive Data Communication Interface: A User-Centric Visual Data Interpretation Framework Grazziela P. Figueredo1,2, Christian Wagner1 , Jonathan M. Garibaldi1,2 , Uwe Aickelin1 1. School of Computer Science, The University of Nottingham, NG8 1BB 2. The Advanced Data Analysis Centre, The University of Nottingham, NG8 1BB gzf, cxw, jmg,
[email protected] Abstract—In this position paper, we present ideas about creating a next generation framework towards an adaptive interface for data communication and visualisation systems. Our objective is to develop a system that accepts large data sets as inputs and provides user-centric, meaningful visual information to assist owners in making sense of their data collection. The proposed framework comprises four stages: (i) the knowledge base compilation, where we search and collect existing state-ofthe-art visualisation techniques per domain and user preferences; (ii) the development of the learning and inference system, where we apply artificial intelligence techniques to learn, predict and recommend new graphic interpretations (iii) results evaluation; and (iv) reinforcement and adaptation, where valid outputs are stored in our knowledge base and the system is iteratively tuned to address new demands. These stages, as well as our overall vision, limitations and possible challenges are introduced in this article. We also discuss further extensions of this framework for other knowledge discovery tasks.
I.
I NTRODUCTION
Turning large masses of data into useful information is a multidimensional problem, requiring appropriate data synthesis, analysis, results communication and visualisation. Current techniques generally fall short in delivering effective solutions for these problems, which consequently leads data scientists to struggle with decisions requiring the analysis of big data. New intelligent methods and the alternative employment of existing tools are therefore needed to empower users to explore their data sets. Additionally, different users and knowledge domains have different exploratory needs, and their success in obtaining useful insights from their data depends on how appropriately these requirements are fulfilled. In short, usercentric data knowledge discovery is needed, combining aspects of visualisation, presentation, and interactivity to communicate the analysis results in an appropriate manner. Our interest lies in alleviating the laborious, time-consuming task of creating suitable visual representations to data content. We therefore introduce an intelligent, extensible, free, open-source framework to assist with data visualisation tasks. Primarily, data visualization aims at making complex data more accessible and intelligible by accelerating the comprehension of large masses of data summarised in visual abstractions [1], [2]. In many cases, an effective graphic display of the dataset content represents on its own a powerful knowledge discovery tool. Understanding the data content and describing it in some sort of information graphics is a difficult, multidisciplinary task [3]. The information transmitted in a visual must be clear, tailored to the problem and appealing to the viewer. Furthermore, what may sound attractive to a certain
profile of viewers or domain area might not be informative to others. Current available visualisation tools mostly take into consideration solely the dataset metadata to suggest appropriate visualisations [4], as further described in the next section. In general, these tools give the user a list of all possible visuals that match the data characteristics. This, however adds a significant burden to the data owners, as they need to understand the charts and choose those that are more appropriate. In addition, users tend to get limited to the visuals they know, i.e. those they have seen or employed in their analysis before. This process is therefore laborious and not necessarily effective. There are also other categories of visualisation tools offering intelligent support. However, they are mostly proprietary, which makes it difficult for the research community to contribute with their ideas and adapt the tool to their needs [5]. From these observations we therefore conclude that there is the need for an adaptable, extensible, open-source suggestion system that takes into consideration (i) the dataset characteristics; (ii) the knowledge domain; (iii) the user profile and preferences; (iv) successful previous visuals matching the problem and domain; (iv) human factors; (v) the purpose of the visualisation and where it should be visualised (web, mobile, paper, etc); and (vi) possible visual improvements and/or variations to produce what could be an effective way of facilitating the data set knowledge exploration and understanding. It is our aim therefore to outline a framework encompassing these elements to assist researchers and data owners from several domains to get the best matching graphics to assist interpreting their data set. We are not proposing a tool for visual design; instead, we envision a tool set to store, re-use, infer and evolve existing visual solutions to create effective suggestions for new data sets. We hope to implement a mechanism that dynamically finds and executes “suitable” portrayals of the given data set based on a host of bits of information. These representations are then available to the user to pass on, inform their analysis, provide a summary of the data and highlight aspects of the data. The proposed framework can be divided in four stages. The first phase involves the knowledge base compilation, where a collection of existing state-of-the-art visualisation techniques per domain and user preferences is built. Subsequently, an ensemble of machine learning algorithms is employed to learn and suggest new graphic solutions. These outputs are evaluated by multiple criteria methods, such as human factors, user ranking, surveys etc. Finally, the evaluation feedback is used
to adjust and adapt the interface and feed the original database with additional information. These stages, as well as our overall vision, limitations and possible challenges are further discussed in the remainder of this article. II.
R ELATED W ORK
In this section we present a summary of the most relevant features of current visualisation tools from both academia and industry. We have performed an extensive search of existing mechanisms, their functionalities and their application domain. We focused our investigation on understanding how the collaboration between the user and the software occurs. These interactions are of our primary interest, as we want to understand their shortcomings and to propose improvements. We have therefore divided the existing tools in four main groups, based on how the user interacts with the product: (i) software environments for statistics, computing and graphics; (ii) web-oriented visualisation tools; (iii) interactive tools; and (iv) intelligent interactive tools. Our aim is to discuss the main characteristics of these tools, their advantages, limitations and the existing gaps that culminated in our proposed research. It is not our intention to provide a complete review of existing mechanisms — instead, we are interested in outlining their common features. For a more extensive review, see [4], [5]. A. Software Environments for Statistics, Computing and Graphics This group comprises well-known tools in the scientific community, such as Matlab [6], R [7], GNU Octave [8], Python(x,y) [9], etc. They are development environments that allow for data manipulation and provide data visualisations. These environments are very useful for data analysts, however, they require more effort to learn and use when compared to interactive tools. In addition, scientific programming background is required to produce the data visualisation scripts, which limits their usage to a specific public, such as computer scientists, mathematicians, statisticians, engineers, etc. Furthermore given the profile of the public that uses these tools, the visual charts are mostly tailored to represent research and engineering data. B. Web-oriented Visualisation Tools These tools offer a variety of customisable charts to be displayed in the web, via a web browser. In order to visualise a data set, the user needs to incorporate the data into scripts, which are generally written in HTML, PhP, JavaScript, etc.
C. Interactive tools Interactive tools enable data owners to develop and share customized data visualisations, from simple charts to advanced graphics. Popular examples are the IBM SPSS Visualisation Designer [15] and IBM Many Eyes [16]. The appeal of these tools is that virtually no programming or technical expertise is needed; therefore, almost everyone has the power to create visualisations. In specific, Many Eyes has several interesting features and operates in line with some of the ideas we are presenting. It creates visualisations from simple data formats, such as text files or spreadsheets. It stores previous data sets so that new users can browse existing visualisations, get ideas and match their problem with existing ones. In addition to their tool, IBM offers expert contributions from a team from the IBM Researchs Center for Advanced Visualisation [16]. This team of experts provides guidance on creating the most effective visualisations and also update users with new trends and advances. Our intention with this position paper is to add further intelligence to tool sets such as Many Eyes in order to automatise their visualisation suggestions and their expert guidance. In this manner, rather than interacting directly with users, visualisation researchers and experts would communicate primarily with our framework by inputting information, creating new types of graphs, evaluating and validating results. D. Intelligent interactive tools This group comprises the state-of-the-art of intelligent data visualisation, where additionally to the user interactivity features, system inputs are also offered. Most existing tools are business intelligence-oriented, with focus on a holistic approach for the data analysis rather than just visualisation. A collection of these tools is reviewed in [5]. Concerning tools focused only on data visualisation, IBM has recently developed the IBM Rapidly Adaptive Visualization Engine (RAVE) [16], which is the underlying technology for the most recent version of Many Eyes. RAVE enables the user to describe how his visualizations should look. The technology behind RAVE however is proprietary and therefore we have no information about how the intelligent algorithms used to render the visuals work. E. Drawbacks
There are several available libraries, such as Google Chart [10], ZingChart [11] and Dygraphs [12], with a variety of charts for multiple purposes. In addition, there are various domain-specific tools, such as Instant atlas [13] (for maps) and Timeline [14] (for temporal data), etc.
By analysing the existing tools, it is possible to observe that they all have significant shortcomings that impact on data analytics. Some tools require time learning and programming expertise, other tools, such as those where the data needs to be incorporated into a script are only suitable for small data sets; there are environments which are domain-specific; and more sophisticated intelligent tools are not open-source and therefore cannot incorporate changes implemented by the scientific community.
These tools however have the restriction of being webbased, which requires web development expertise and therefore they are not suitable for every user. In addition, having to incorporate the dataset in a web script can be burdensome when dealing with large data.
In general, all available tools still fall short in exploring further artificial intelligence methods. Overall, they offer a possibility of visuals and the user chooses one of them to display the data. We envision, instead, intelligent tools that take as input the data set and an array of attributes (metadata,
user, domain, etc) and recommends visual representations of the data. We therefore propose a next generation, innovative framework to fill some of these gaps and to assist users in defining better ways of showing their data graphically. The objective is to create extra intelligent layers in the process of data visualisation to optimise the usefulness of the obtained visuals. Our framework is introduced next. III.
T HE F RAMEWORK
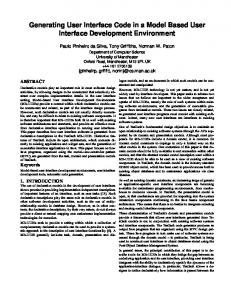
In this section we introduce our vision and outline the main activities we view as necessary for its accomplishment. We do not recommend definite solutions for the challenges presented, as some of them are quite complex. Instead, we aim at describing the problem to be addressed and outline a general framework for solving it. Furthermore, one of our objectives is to call other researchers to further explore and develop our proposal. A. Vision We envisage a system that takes in a new data set and produces different formats of data visualisation, considering aspects such as the domain area, metadata, user profile and preferences, keywords, previous successful data display cases, etc. The main core of this framework is composed of intelligent methods for knowledge interpretation and inference, to generate and evolve suitable candidate solutions. The outputs produced are evaluated by the target user and other set of criteria; and the results of this evaluation will in turn feed the system with information for future inferences. The scheme of our framework is shown in Figure 1. There are four main stages to consider: •
Stage 1: the creation of a knowledge base.
•
Stage 2: the development of the adaptive interface for data communication.
•
Stage 3: the system evaluation.
•
Stage 4 the system feedback.
The motivations for the conceptualisation of this idea and each stage of the framework are presented next. B. Motivations The motivations for this framework arose from our work experience. We work with data analytics and we provide analysis for several partners in industry and academia. These partners belong to a variety of areas of expertise, and they have distinct exploratory needs. We are therefore always faced with the challenge of determining the most appropriate graphs to their data sets. In addition, due to budget and time restrictions of our projects, this task needs to be performed quickly and effectively. Our standard procedure when we start characterising the data set is to produce a number of graphs and to assess their utility, by getting feedback from our clients — which requires several iterations, each potentially lasting days, delaying the actual analysis. As expected, each domain area and user are drawn to different types of visual interpretations; and we need to learn these preferences to ultimately reduce the time spent in the data
Fig. 1.
The adaptive data communication interface vision
visualisation task and increase our productivity. We require therefore an intelligent engine that ‘remembers’ successful examples, associates them with tags (domain, user, sub-area, etc.) and recommends visual solutions to new datasets automatically. IV.
T HE F RAMEWORK S TAGES
In order to further understand our idea and the motivations behind it, a simplified, fictional example is introduced in this section. Let us pretend that we are hired to work on a project involving three professionals, the first one with a Computer Science (C) background, the second one from Biology (B) and the third one from Mathematics (M). These experts want to investigate the iris dataset. This dataset is available from the UCI Repository of Machine Learning [17] and is a simple, well-known benchmark in the pattern recognition community, which will serve our illustration purposes. The data set consists of fifty samples from each of three species of iris flowers (Iris
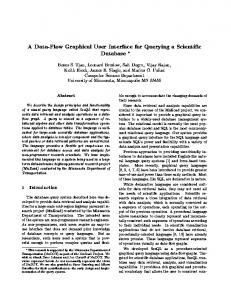
Fig. 2.
Examples of possible visualisations for the Iris dataset
setosa, Iris virginica and Iris versicolor). Four features are measured from each sample: the length and the width of the sepals and petals, all in centimetres. Let us assume the following facts about our researchers: (1) C is interested in validating a new cluster method; (2) B has never seen this dataset and is interested in looking at distributions of the species; and (3) M is interested in creating equations describing the relationship between the petals and sepals of the flowers.
useful; B finds (1), (2) and (3) useful and does not like figures (3) and (4); and M understands all graphs, but finds graph (4) not very informative. Once these preferences associated with the profiles are collected, they need to be stored for future reference. A schematic representation of this process is shown in Figure 3. This part of our example falls into the first stage of our framework (Figure 1), which is further discussed next. It is important to observe that these graphs are much simpler than those we envision as being produced in intelligent system; we employed them only for further clarification of the idea.
Normally, our first step is to assist our partners with some data description and visualisation. We use a set of tools to produce a number of graphs. Figure 2 shows examples of graphs we produced to interpret the data: (1) a table containing the correlation between the data set attributes; (2) a heat map, which also shows the correlations between the attributes, and therefore represents a different way of displaying the same information as item (1); (3) a scatter plot with histograms, displaying the projections and distributions of the attributes; (4) a line chart, where each line shows the corresponding value (in cm) for each attribute (y axis), for the 150 flowers of the database (x axis); (5) a pie chart with the distribution of flowers per class; and (6) another pie chart showing the same information as graph (5), but with a different design style. All these graphs extract elements of information from the data, however the usefulness of the information transmitted is subjective, depending on the viewers and their questions about the data. In order to determine which are the best visuals, we need feedback from the viewers. Suppose C finds graphs (1), (2) and (3) useful for his work and states that visualisation (4) is not
Fig. 3.
Building the knowledge base
Fig. 4.
The recommendation process
A. Stage 1 - The Knowledge Base Compilation As explained in our example, in this stage a “memory” of successful cases of data visualisation is built. The purpose is to collect references for the intelligent engine (i.e. our adaptive interface) to be able to provide user-centric visual schemes based on previous profiles of similar case studies. This database is supposed to store a maximum possible information about users, domains, types of data, keywords, etc. To obtain this knowledge base, an extensive search in the literature, web sites, research papers, online news and opensource online infographics and data visualisation tools has to be conducted. Furthermore, automatic knowledge base creation methods need to be employed. In addition, pilot studies and user surveys need to be carried out to determine the human factor elements and requirements that need to be incorporated into the memory mechanism. This information gathered is subsequently transferred to the intelligent core of our framework in distinct manners; for instance, via direct queries or through extracted knowledge. We foresee a considerable amount of facts being collected; therefore, this knowledge base needs to be mined to determine the rules, patterns, tags, parameters, etc. that will serve as inputs to train and tune the adaptive learning system. In addition, once the data is loaded in the system, it is also likely that it will need some sort of pre-processing and standardisation. We understand this phase can be quite laborious, and defining ‘how’ and ‘what’ needs to be collected to create our framework memory is a difficult task. In addition, there is the challenge of defining automatic ways and selecting the appropriate technologies to search, collect and store the information needed. Another difficulty that might be encountered is how to define noisy data, i.e. irrelevant information, the misuse of visuals, etc. There is therefore the need to employ different methods of information retrieval [18]–[21] and text mining [22] in some sort of ensemble to guarantee that, as much as possible, only useful information is stored. After the knowledge base is created, we subsequently need an intelligent engine to extract and translate the information
to feed it to the next stage. Data mining needs to be applied to obtain rules, patterns, associations, etc. to assist building the inference models for new case studies. The collection of inference models constitute the second stage of our framework, as discussed next. B. Stage 2 - The Adaptive Data Communication Interface This is the intelligent nucleus of our framework, which purpose is to employ the knowledge obtained from past examples to generate graphical interpretations for new problems. According to our ideas, after the knowledge base is created and the intelligent system is trained, the adaptive interface should be able to start providing recommendations. Back to our case study, let us suppose a new user has data to be visualised. The user is a Biology student (S). S spent their internship gathering more instances of the iris flowers and wants to visualise the data collected. S inputs their profile, the purpose of the visualisation and dataset to the system, and the intelligent engine needs to work out the best visualisations. Figure 4 illustrates a possible manner this engine could work for this example. The system should output successful graphs that were defined as preferable by similar users. For example, the system could indicate a heat map, a pie chart (based on previous experiences) and recommend a new visual interpretation, i.e. a box-plot (see Figure 4). Observe that as chart (4) was not useful for any user (and is not useful for this data), it is not recommended (interestingly, this graph was a suggestion from a popular data visualisation tool, which reinforces our idea that more intelligent engines are necessary). This means that the negative feedback is also important for the system performance. As shown in Figure 1, we envision this adaptive intelligent interface as a combination of machine learning (ML) techniques, such as rule-based approaches [23]–[27], casebased reasoning [28]–[31], active learning [32]–[34], recommendation systems [35], [36], and other ML methods [37], [38]. The objective is to produce a type of ensemble, where
visuals suggested by the majority of the ML techniques are put forward as recommendations. In addition, in order to produce variations (or mutations) in the scripts for the data visualisation, an off-line system with an evolutionary algorithm (EA) [39]–[43] could possibly be employed. We believe our main intelligent system falls into the category of recommendation systems; however, the character of problem and the solutions we are proposing require further development of the existing algorithms, as discussed next.
Fig. 5.
manipulation (aggregations and sub-queries). TABLE I. Client John Phil Mary Sarah Ethan Hugh Hugh John
Supermarket A B B A C A C C
E XEMPLAR DATA Month Jan Jan Feb March March April April April
Amount spent 20 10 40 5 60 35 22 90
Stage 2 flow chart
There are several challenges in the development of this stage. Firstly, it is necessary to investigate and determine which ML methods are applicable to the problem. Subsequently, the input requirements of each method need to be met, i.e., the knowledge base information has to be translated to the way each approach represents and handles information. Depending on the dataset, the purpose and the media where the data is required to be visualised, some approaches might not be applicable and therefore a module to select the appropriate ML agents needs to be incorporated. In addition, an engine to collect the results of the ML approaches, perform the ensemble and output the candidate solutions needs to be implemented. Figure 5 shows what we think should be the flow chart for this stage. Another existing challenge to perform effective characterisation is to determine the right data perspective for the visualisation task. This includes, for instance, looking at a subset of features rather than the entire data; duplicating information (removing the data base from its normal form) to suit certain techniques (such as network visualisations); performing data queries to retrieve aggregate values; establishing timeliness for dynamic charts, etc. For instance, if we consider the data from Table I, regarding supermarket expenses, possible visualisations are shown in Figure 6. In the figure, graphs (1) and (2) are extracted directly from the numbers given in the table. Graphs (3), (4), and (5), however, require further data
Fig. 6.
Possible visualisations for the supermarket data
C. Stage 3 - Evaluation The evaluation of the outcomes is used to inform the adaptive communication interface about the correct and incorrect recommendations made. The objective is to assist with the dynamic character of the framework, as the system needs to adapt to new demands and new users with time. In our example with the iris data, the interface suggests three graphs for the new user S (a heatmap, a pie-chart and a box-blot); S evaluates the suggestions and selects those found useful, i.e., graphs (2) and (3); and also those found not useful, i.e., (1) (Figure 4). These preferences need to be fed back to the intelligent interface so that the system learns new patterns and
evaluates the current state of the recommendation agents. In addition, the new user profiles and preferences are stored in the knowledge base for future reference. In our bigger vision, the intelligent engine should have multiple evaluation methods, other than just the users. For example, web surveys for a larger public evaluation should also be employed (such as crowdsourcing or mechanical turk [44]). In addition, input from design experts, psychologists (who can study profiles of users preferences) and human factors researchers are necessary to refine the system. Once the evaluation of the output is established, it is possible to determine the ML mechanisms that are performing satisfactorily (and should be reinforced), and those that are failing and require adjustment. We can also observe how each technique functions better depending on the domain. This stage is therefore a way to evaluate the recommendation/ML techniques used and provide information about the capacities of each part of the ensemble. Ultimately, if there is an approach with multiple failures throughout many interactions, its removal from the system should be considered. For this task, a performance record for each intelligent agent in the system should be kept. This stage has also the objective to provide a score (or ranking) of the existing associations between users, domains, etc., and the visuals. Therefore if the user preferences evolve with time (due to further knowledge of data visualisation, new demands, etc.), the system will be able to reflect these changes. In addition, the knowledge gathered regarding how preferences evolve with time can be transferred to data visualisation researchers. D. Stage 4 - Feedback and Adaptation This is a stage where the system needs to be recalibrated to suit new demands. Each ML agent needs to be adjusted to improve the recommendation system and to incorporate user’s changes in visualisation needs. In this stage also the inclusion or removal of faulty parts of the framework should be considered. In addition, new information gathered during the evaluation stage needs to be stored in the knowledge base, and the knowledge extracted to train the ML approaches should be updated. V.
C ONCLUSION
Adding intelligence to suggest informative visualisations for data rendering is a difficult task. It involves several elements working together (from meta data interpretation, transformation to the decision of the best set of graphs) to achieve satisfactory results. In addition, the data visualisation task needs to be guided by the exploratory objectives of the data owner. To date, most existing tools fail in delivering effective intelligent solutions to tackle these problems. Successful data visualisations rely heavily on the expertise of data analysts. Depending on the complexity of the problem, the visualisation process can be laborious and require several interactions between the data analyst and the data owner. Our objective was therefore to put forward a framework towards an intelligent interface to alleviate the burden of achieving effective visual interpretations. Our intent was to add an extra
interface that could better guide the data owners into the possibilities of exploration of their data. We proposed an open-source, extensible, adaptable intelligent system to recommend ways of visualising information based on an array of characteristics from the data set and the data owner. We envision a system that takes in a new data set and maps it into different sets of user-centric interpreting graphs. Four main stages are devised to accomplish our framework: (i) the knowledge base compilation, where a search for existing state-of-the-art visualisation techniques is conducted; (ii) the development of the learning and inference system to recommend new graphic interpretations (iii) results evaluation; and (iv) reinforcement and adaptation, where the system is iteratively adjusted to improve accuracy and suit new demands. Due to the complexity of the problem addressed and the many unforeseen questions that might arise during the implementation of this idea, each stage of the framework on its own represents a large avenue for research and new insights. Despite our efforts to outline many challenges to be faced, it is likely that others will appear. These challenges are not trivial, however, if they are met, the future of data visualisation tasks might derive considerable benefit from our framework. Currently the framework is limited to data visual interpretation tasks. In the future however we envision the extension of this idea to other knowledge discovery tasks. Therefore the ultimate goal is to produce an intelligent system able to guide the user throughout most stages of the data analysis. In this way, the data owner will upload his file into the system and the interface will suggest and proceed to the best route for data characterisation and analysis, considering, for instance, methods for classification, clustering, regression, etc. VI.
ACKNOWLEDGEMENTS
We would like to thank Dr Andr´e M. S. Barreto from Laborat´orio Nacional de Computac¸a˜ o Cient´ıfica (LNCC) and Dr Naisan Benatar for their comments on our work. R EFERENCES [1] N. Iliinski and J. Steele, Designing Data Visualisations. O’Reilly, 2011. [2] L. Wilkinson, The Grammar of Graphics. Springer Science and Business Media, 2006. [3] M. Friendly and D. J. Denis, “Milestones in the history of thematic cartography, statistical graphics, and data visualization,” URL http://www.datavis.ca/milestones (last acessed in 25/03/2015), 2009. [4] Creative blog team, Available at: http://www.creativebloq.com/designtools/data-visualization-712402, Last accessed 23 Oct 2011. [5] Software advice team, Available at: http://www.softwareadvice.com/uk/bi/data-visualization-comparison/, Last accessed 23 Oct 2011. [6] MATLAB, version R2014b. Natick, Massachusetts: The MathWorks Inc., http://uk.mathworks.com/products/matlab/ (last acessed 26/03/2015), 2014. [7] R Core Team, R: A Language and Environment for Statistical Computing, R Foundation for Statistical Computing, Vienna, Austria, 2013. [Online]. Available: http://www.R-project.org/ [8] Octave community, “GNU Octave 3.8.1,” 2014. [Online]. Available: www.gnu.org/software/octave/ [9] Pythonxy, “Scientific-oriented python distribution based on qt and spyder,” Available at: https://code.google.com/p/pythonxy/, Last accessed 23 Oct 2011.
[10]
Google Developers, Available at: developers.google.com/chart, Last accessed 23 Oct 2011. [11] Zing Chart, Available at: http://www.zingchart.com/, Last accessed 23 Oct 2011. [12] Dygraphs community, Available at: http://dygraphs.com/, Last accessed 23 Oct 2011. [13] Instant Atlas, Available at: www.instantatlas.com, Last accessed 23 Oct 2011. [14] Timeline community, Available at: http://www.similewidgets.org/timeline/, Last accessed 23 Oct 2011. [15] IBM SPSS Visualisation Designer, Available at: www03.ibm.com/software/products/en/spss-viz-designer, Last accessed 23 Oct 2011. [16] IBM Many Eyes, Available at: www01.ibm.com/software/analytics/many-eyes/, Last accessed 23 Oct 2011. [17] D. N. A. Asuncion, “UCI machine learning repository,” 2010. [Online]. Available: http://www.ics.uci.edu/∼mlearn/MLRepository.html [18] C. D. Manning, P. Raghavan, and H. Sch¨utze, Introduction to Information Retrieval. New York, NY, USA: Cambridge University Press, 2008. [19] A. Turpin and F. Scholer, “User performance versus precision measures for simple search tasks,” in Proceedings of the 29th Annual International ACM SIGIR Conference on Research and Development in Information Retrieval, ser. SIGIR ’06. New York, NY, USA: ACM, 2006, pp. 11–18. [Online]. Available: http://doi.acm.org/10.1145/1148170.1148176 [20] A. Singhal, “Modern information retrieval: a brief overview,” Bulletin of IEEE Computer Society Technical Commitee on Data Engineering, vol. 24, p. 2001, 2001. [21] W. B. Frakes and R. Baeza-Yates, Eds., Information Retrieval: Data Structures and Algorithms. Upper Saddle River, NJ, USA: PrenticeHall, Inc., 1992. [22] K. B. Cohen and L. Hunter, “Getting started in text mining.” PLoS Computational Biology, vol. 4, no. 1, 2008. [23] G. Piatetsky-Shapiro, “Discovery, analysis and presentation of strong rules,” in Knowledge Discovery in Databases, G. Piatetsky-Shapiro and W. J. Frawley, Eds. AAAI Press, 1991, pp. 229–248. [24] R. Agrawal, T. Imielinski, and A. Swami, “Mining association rules between sets of items in large databases,” in In: Proceedings of the 1193 ACM SIGMOD international conference of management of data, Washington DC (USA, 1993, pp. 207–216. [25] J. Hipp, U. Gntzer, and G. Nakhaeizadeh, “Algorithms for association rule mining – a general survey and comparison,” 2000. [26] M. Girotra, K. Nagpal, S. Minocha, and N. Sharma, “Article: Comparative survey on association rule mining algorithms,” International Journal of Computer Applications, vol. 84, no. 10, pp. 18–22, December 2013. [27] J. Pei, J. Han, and L. Lakshmanan, “Mining frequent itemsets with convertible constraints,” in Data Engineering, 2001. Proceedings. 17th International Conference on, 2001, pp. 433–442. [28] A. Aamodt and E. Plaza, “Case-based reasoning: Foundational issues, methodological variations, and system approaches,” AI Commun., vol. 7, no. 1, pp. 39–59, Mar. 1994. [Online]. Available: http://dl.acm.org/citation.cfm?id=196108.196115 [29] Hllermeier, Case-Based Approximate Reasoning. Springer-Verlag, Berlin, 2007. [30] R. C. Schank, Dynamic Memory: A Theory of Reminding and Learning in Computers and People. New York, NY, USA: Cambridge University Press, 1983. [31] J. L. Kolodner, “Reconstructive memory: A computer model,” Cognitive Science, vol. 7, no. 4, pp. 281 – 328, 1983. [Online]. Available: http://www.sciencedirect.com/science/article/pii/S0364021383800020 [32] B. Settles, “Active learning literature survey,” University of Wisconsin–Madison, Computer Sciences Technical Report 1648, 2009. [Online]. Available: http://axon.cs.byu.edu/ martinez/classes/778/Papers/settles.activelearning.pdf [33] F. Olsson, “A literature survey of active machine learning in the context of natural language processing,” Tech. Rep. 06, Apr. 2009.
[34]
E. Lughofer, “Single-pass active learning with conflict and ignorance.” Evolving Systems, vol. 3, no. 4, pp. 251–271, 2012. [35] F. Ricci, L. Rokach, B. Shapira, and P. B. Kantor, Recommender Systems Handbook, 1st ed. New York, NY, USA: Springer-Verlag New York, Inc., 2010. [36] P. Melville and V. Sindhwani, “Recommender systems,” in Encyclopedia of Machine Learning, 2010, pp. 829–838. [37] T. Mitchell, Machine Learning. McGraw-Hill, 1997. [38] J. Han and M. Kamber, Data Mining: Concepts and Techniques. Morgan Kaufmann, 2001. [39] T. Back, D. B. Fogel, and Z. Michalewicz, Eds., Handbook of Evolutionary Computation, 1st ed. Bristol, UK: IOP Publishing Ltd., 1997. [40] T. B¨ack, Evolutionary Algorithms in Theory and Practice: Evolution Strategies, Evolutionary Programming, Genetic Algorithms. Oxford, UK: Oxford University Press, 1996. [41] D. Goldberg, Genetic Algorithms in Search, Optimization, and Machine Learning. Reading, Mass.: Addison-Wesley, 1989. [42] J. H. Holland, Adaptation in Natural and Artificial Systems. Ann Arbor, MI: University of Michigan Press, 1975. [43] Z. Michalewicz, Genetic Algorithms + Data Structures = Evolution Programs. Springer-Verlag, 1992. [44] P. Ipeirotis, Turker Demographics vs Internet Demographics. New York University, 2009.