Adaptive Dynamics of Realistic Small-World Networks Olof Mogren∗
Oskar Sandberg†
Vilhelm Verendel‡
Devdatt Dubhashi§
arXiv:0804.1115v1 [cs.DS] 7 Apr 2008
April 8, 2008 Abstract Continuing in the steps of Jon Kleinberg’s and others celebrated work on decentralized search in small-world networks, we conduct an experimental analysis of a dynamic algorithm that produces small-world networks. We find that the algorithm adapts robustly to a wide variety of situations in realistic geographic networks with synthetic test data and with real world data, even when vertices are uneven and non-homogeneously distributed. We investigate the same algorithm in the case where some vertices are more popular destinations for searches than others, for example obeying power-laws. We find that the algorithm adapts and adjusts the networks according to the distributions, leading to improved performance. The ability of the dynamic process to adapt and create small worlds in such diverse settings suggests a possible mechanism by which such networks appear in nature. 1 Introduction In 1967 Stanley Milgram set out to measure the “smallness” of the world. He wanted to know if it was really true that any two people could be connected through a short chain of acquaintances. To conduct this experiment, he gave volunteers living in Omaha, Nebraska, a letter addressed to a stockbroker from outside Boston, asking them to forward it to him, with the stipulation that the letter could only ever pass between people who were on a first name basis. The results of his experiment were generally seen as proof that we really do live in a small world – for the letters that arrived successfully, the average number of steps was just six. In mathematics, the idea of the small world has in∗ Department of Computer Science and Engineering, Chalmers University of Technology and G¨ oteborg University † Department of Mathematical Sciences, Chalmers University of Technology and G¨ oteborg University, 412 96 G¨ oteborg, Sweden.
[email protected] Corresponding author. ‡ Department of Computer Science and Engineering, Chalmers University of Technology and G¨ oteborg University § Department of Computer Science and Engineering, Chalmers University of Technology and G¨ oteborg University
spired the study of graph diameter. Roughly speaking, it has been noted that if the edges of a graph are chosen randomly, then the diameter tends to be “small”: of the order of log n where n is the size of the graph. However, while such a world may be small, this does not in itself explain the success of Milgram’s experiment. In his seminal paper from 2000 [1], Jon Kleinberg took an algorithmic perspective and asked: how is it that it was possible for people to know whom they should send the letter to so it would arrive in few steps? After all, the social network is a criss-crossed maze of connections, of which the participants have no overview. Kleinberg showed that for it to be possible, using only local knowledge, to efficiently forward the message to its destination the graph must have a particular form. Specifically, the probability that two people are acquainted must follow a particular power-law relation with the distance between them. When this is the case, messages can be routed in a polylogarithmic number of steps, in all other cases it is exponentially larger. Graphs where routing is efficient have since been labeled navigable. 1.1 Motivation In Kleinberg’s original work [1] [2], his model for the world was a two-dimensional grid, where people knew their k-nearest neighbors, and had r random long-range contacts in the network. The distribution of these shortcuts is what determines the navigability of the graph. Later works have extended the model to more general and more realistic settings. In his PhD thesis, David Liben-Nowell [3] studied a realworld social network of people from the United States connected over the Internet. He found that this network was navigable, and could be made to fit with Kleinberg’s theory, but only after adjustments had been made to take into account the highly non-homogeneous geographical distribution of the population. While his work gives hints as to in what situations the unadjusted model fails, the criteria for this have not been characterized. Several works have explored this more general relation in other contexts [4] [5] [6]. Another question that is raised by any attempt to apply Kleinberg’s ideas to the real world, is understanding why social networks should be navigable in the first
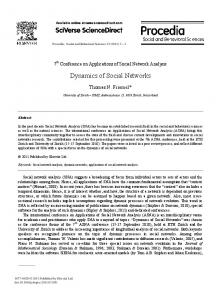
Kleinberg’s ICM survey [10]. Besides the algorithm of Sandberg and Clarke studied here, Clauset and Moore have suggested a different re-wiring algorithm which they find experimentally also leads to a navigable graphs [11]. The two methods are superficially similar, but actually lead to very different dynamics. Other models for small-world emergence have been suggested by Sandberg [12] and Duchon et al. [13] and recently by Chaintreau et al. [14] but these are not evolutionary rewiring schemes and function differently. 1.3 Contribution We characterize our contribution as follows: Figure 1: In the real world, populations are inhomogeneously distributed. Here the population density of the United States of America by county.
1. We investigate experimentally navigable smallworld models with non-homogeneous population distributions, identifying when simply applying Kleinberg’s method of adding shortcuts in the grid fails to produce navigability. The fact that this method fails in some cases has been observed before [9] but when this happens is not fully understood. Here we show a family of distributions where the original model demonstrably fails to produce small worlds.
place. In some ways, the negative result in Kleinberg’s work is much stronger than the positive: for almost all edge distributions efficient routing is not possible, it is only for distributions meeting very strict criteria that it is. This seems strange in relation to the lessons of Milgram’s experiment – people really could route well – 2. We simulate the placement of shortcuts in such enand also Liben-Nowell’s observations from his dataset. vironments using an evolutionary rewiring model. It seems feasible that there is some dynamic which We are not aware of any previous studies of smallcauses navigability to arise. Sandberg and Clarke [7] world emergence models in realistic geographic set[8] have suggested as such a dynamic a re-wiring algotings. We demonstrate that the algorithm used rithm which causes networks to become navigable. By produces navigable networks robustly under all simulating a large number of searches on the network, tested circumstances: synthetic distributions with and changing the shortcuts based on the path taken by homogeneous and non-homogeneous distributions each search, the algorithm progressively creates a smallof data points, as well as scenarios based on the world from any starting distribution. real world population distributions of Sweden and The goal of this paper is to make an experimental the United States. analysis of Sandberg and Clarke’s algorithm under more 3. We test the same evolutionary model also for realistic situations. As far as we are aware, this is the non-homogeneous popularity models – when some first comprehensive experimental analysis of a dynamic people are more popular targets for searches than model for the emergence of small worlds in realistic others, for instance obeying various power laws. We geographic scenarios . We study how it behaves when find that it not only works robustly well in these vertices are not placed in a grid, but rather distributed cases, but it “learns” the distribution and produces in a continuum and with non-homogeneous population better mean results than otherwise. Such learning density. We contrast this with the results of using the is not possible using the explicit augmentation same edge probabilities as in the homogeneous case, models of Kleinberg [1] and Liben-Nowell [9]. as well as the methods of Liben-Nowell et al. [9]. We also investigate how the algorithm responds to uneven Routing and Navigable distributions in the source and destination of searches – 2 Decentralized Augmentation something more similar to the power-law (“scale-free”) distributions known to be common in many real life Let G = (V, E) belong to a family of finite graphs networks. with high (some power of |V |) diameter, and let the random graph G′ be created by addition (augmentation) 1.2 Previous Work For a recent summary of pre- of random edges to G. It is well known, see for instance vious work in the field of navigable networks, see Jon [15], that the diameter shrinks quickly to a logarithm of
|V | when random edges are added between the vertices. Navigability concerns not a small diameter, however, but rather a stronger property: the possibility of finding a short path between two vertices in G′ using only local knowledge at each vertex visited. By local knowledge, one means that each vertex knows distance with respect to G, but does not know which random edges have been added to any vertex until it is visited. The exact limits of such decentralized routing algorithms have been discussed elsewhere [1] [16], but we will discuss only the one we use: greedy routing. In greedy routing for a target vertex z, the next vertex chosen is always that neighbor which is closest to z according to the distance induced by G (with some tie-breaking rule applied). Both the original and augmented edges can be used, but because the choice is only optimal with respect to G, the path discovered by greedy routing will seldom be a minimal path in G′ . Kleinberg originally let G be a 2-dimensional n × n-grid and independently added shortcuts from each vertex to random destinations. Each shortcut is added to x ∈ V such that for y ∈ V , and some α ≥ 0 1 (2.1) P(x ; y) = hα,n d(x, y)α where x ; y is the event that x is augmented with an d edge to y and d(x, y) denotes L1 distance P in Z . hα,n−αis here a normalizing constant, equal to y6=x d(x, y) . His observation was that when α = 2, greedy routing between any two points in V takes O(log2 n) steps in expectation, while for any other value of α decentralized algorithms create routes of expected length at least Ω(ns ) steps for some s > 0 (where s depends on α and the dimension but not size nor the algorithm used). One may note that for x in a 2-dimensional grid and r > 0, |{y ∈ V : d(x, y) ≤ r}| ∝ r2 . The general principle that may be noted by combining this with (2.1) is that under navigable augmentation the probability that x links to y should be inversely proportional to the number of vertices that are closer to x than y. This has been observed to hold not just when G is a grid of any dimension, but also for wider classes of graphs, see e.g. [4] [6]. In particular, in Liben-Nowell et al.’s paper on geographic routing [9], they let the rank of a vertex y with respect to x be y’s position when the vertices are ordered by distance from x, written rankx (y). (Some natural ordering of the vertices is used for tie-breaking). Their augmentation principle is then that 1 . (2.2) P(x ; y) = hn rankx (y) P where hn = nk=1 k −1 ≈ log n. In a companion paper by Kumar et al. [17] they prove analytically that this
leads to a O(log2 n) path lengths in expectation in a discrete non-homogeneous model (the population is confined to a two dimensional grid, but the number of people at each grid point varies). 2.1 Continuum Settings When attempting to model reality, it is preferable to view the “world” of the vertices as a continuous metric space, rather than just a base graph G. In particular, we want both the routing and the augmentation to be with respect to the distance between vertices given arbitrary positions in the space, rather than just graph distance. That is, if M is a metric space with d : M × M 7→ R a metric, then the set V may consist of n randomly distributed points in M . (Typically, and in the text below, the metric space is a compact subset of R2 , and d is Euclidean distance.) We then construct the “shortrange” links (that is G) so as to respect the geometry of the space. In particular, one wishes for G to be suitable for greedy routing with respect to d in the sense that for z 6= x, x always has a neighbor closer to z than itself – if this is not the case, it is possible for a greedy route to reach a “dead-end” at which no progress can be made in the next step. This sort of construction was considered in [18]. There, the authors let the the base graph G be constructed by connecting each vertex x with all vertices within some distance r(n). For sufficiently large r(n) this will with high probability lead a base graph which is suitable for greedy routing. In [8] a different approach is used. Instead of connecting all near vertices, a Voronoi tessellation of M with respect to the points is calculated, and each vertex is connected to those with neighboring cells. Thus G is the Delaunay graph (or Delaunay triangulation) of the set of points. The advantage of this approach is that G is a planar graph more elegantly describing a neighbor structure on M , and that no probability calculations are necessary: it is easy to see that G always allows a greedy route to monotonically approach its target. Delaunay graphs can be efficiently calculated using well-known algorithms [19]. Once G has been defined, one can augment it to create G′ as before, adding outgoing edges to each vertex. The probabilities are found by replacing L1 distance with the more general d(x, y) in (2.1) and when calculating rankx (y). 2.2 Destination Sampling “Destination sampling” is a name given to the re-wiring algorithm introduced by Sandberg and Clarke in [7]. This is not a method of augmenting a graph G to create G′ as such, but takes any given augmentation, and changes the shortcuts (without changing their number or the out-degree of any
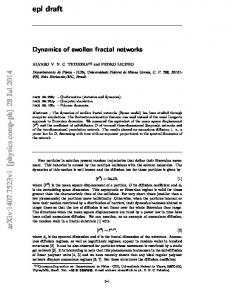
Figure 2: Realization of 375 vertices in a random distribution (see Section 3.1) on [0, 1] × [0, 1] using k = 10 and γ = 1.2, together with the Delaunay triangulation. vertex) so as to make the resulting graph navigable. The algorithm can be expressed in varying levels of generality, but the general principle is always the same: each vertex samples the destination of its shortcuts from among the destinations of searches that pass through that vertex.
Figure 3: An illustration of Destination Sampling on an augmented grid before and after a rewiring. The blue vertices and edges represent a greedy path from red to green. After the path has been found, the shortcuts of two vertices along the path are randomly selected to be rewired.
Algorithm 2.1. Let Gs = (V, E∪Es ) be an augmented graph at time s. G = (V, E) is the base graph, and Es 2. ys+1 and zs+1 are chosen uniformly at random. the set of shortcuts, which for each vertex in V contains at least one outgoing edge. see [7] and [8]. The goal of this paper is to see what Let 0 < p < 1. Then Gs+1 is defined as follows. happens when these two things do not necessarily hold, as one would expect in a realistic situation. 1. Choose ys+1 and zs+1 randomly from V . The parameter p in the algorithm is used to limit 2. If the chosen vertices are distinct, do a greedy the dependence among edges of nearby nodes. In walk in Gs from ys+1 to zs+1 . Let x0 = theory, the algorithm performs better the lower p is, ys+1 , x1 , x2 , ..., xt = zs+1 denote the points of this but the sampling, and thus convergence, is slower. We walk. use a value of p = 0.1 which we have determined experimentally provides a good trade-off, throughout 3. For each x0 , x1 , ..., xt−1 independently and with the paper. probability p replace a randomly chosen shortcut from that vertex with one to zs+1 . 3 Experiments 3.1 Population Density To experiment with nonIn order to create a navigable augmentation, this homogeneous population densities we used a continuum algorithm is applied repeatedly, causing it to converge model and the Delaunay graph as described above. We to a limiting stationary distribution. For simulations divided a 2-dimensional real space into zones of different population density, and populated it with a nonand analytical motivations why this works when homogeneous spatial Poisson process. The intensity of the process in each zone was the zones population den1. The vertices of V are homogeneously distributed.
sity normalized so as to give approximately a desired population size for the whole space. With the vertices thus placed a Delaunay graph can then be constructed using known algorithms, and we experimented with different ways of augmenting edges to ensure navigability. Our goals with this were twofold – firstly to identify in which types of situations augmenting according to formula (2.1) fails to lead to navigability, while (2.2) does. Liben-Nowell et al. [9] give some hints as to when this may be the case, but do not characterize it. Secondly, we tried applying Destination Sampling (Algorithm 2.1) to see if it adapts and gives navigable augmentation even in cases where straightforward augmentation does not. The models of population density that were used are as follows: 1. Uniform: The n vertices are a placed uniformly at random across a square space M = [0, 1] × [0, 1]. 2. Metropolis: Here also the vertices are placed randomly in the same square space, but this time with Figure 4: The population density of Sweden, broken 90% of the total intensity within 20% of the maxi- into 1x1 km squares. mal distance from the space’s center. 1. Distance: Explicit sampling according to a power3. Random: [0, 1]×[0, 1] was divided into k×k equally law of the distance, as in Kleinberg’s original work. sized square zones, which were given a randomly This means following formula (2.1) but with d ordered labeling of s = 1, . . . , k 2 . The population in the formula and the normalizer interpreted as of each zone was then given a relative population Euclidean distance in R2 . density of 1/sγ , making the labels an ordering For two dimensions, we use α = 2, the value at from most to least densely populated. For our which navigability arises in uniform networks. experiments, we used k = 100 and γ = 1.2 where the latter value approximates the average value of 2. Rank : Explicit sampling, but using the rank fordecay of city sizes in the real world [20]. See Figure mula (2.2) as used by Liben-Nowell et al. 2 for an example realization. 3. Destination Sampling: Each node is initiated with 4. Real World : Finally, we used data regarding the no useful long-range link (formally, it has one to contemporary population distribution of Sweden itself), and then the Algorithm 2.1 is run 10n, and the United States. For Sweden, data was where n is the graph size, times. obtained from Statistics Sweden [21] giving the population of each of the country’s 449,964 square In some cases, we also compared with the results kilometers, which we interpret as the proportional of choosing the shortcut uniformly among the other intensity of population in that area. For the United vertices. This is known to give greedy path lengths States, a map showing the population density of which are a fractional power of the number of vertices 1/3 each of county in the lower 48 states, taken from – Ω(n ) with a uniform population distribution – and thus was used only as a baseline for comparison. The National Atlas [22] was used1 . In each case, each vertex was given one outgoing 3.2 Popularity Distributions One of the most shortcut, selected by the following augmentations meth- striking differences between social networks and most ods: simple random graph models is that the former seem to have power-law degree distributions, while the latter 1 The data in both cases was not exact. The map of Sweden most often have Poisson distributed or even constant degives the population of each square kilometer among the levels 0, 1-4, 5-29, 30-149, 150-4999, and 5000 and above. The map of the grees. The celebrated “preferential attachment” model continental USA was divided in to 0, 1-4, 5-9, 10-24, 25-49, 50-99, (see [23] and [24] as well as [25] for rigorous analysis) explains this fact by showing that such distributions arise 100-249, and 250 and above people per square mile.
6.5 Explicit by Distance Explicit by Rank Destination Sampling 6
5.5
Sqrt. Mean Path
5
4.5
4
3.5
3
2.5 100
1000
10000
100000
1e+06
Network Size
Figure 6: Performance of greedy routing when augmenting the Delaunay graph of uniformly randomly distributed points in [0, 1]×[0, 1], using distance based augmentation (2.1) with α = 2, rank based augmentation (2.2), and destination sampling. 3.3 Combined For completeness, we look at what Figure 5: A realization of a Delaunay graph and desti- happens when performing destination sampling on the nation sampling on a population distributed according Swedish population model from the first section, while at the same time using a biased popularity distribution to Sweden’s population density (see Figure 4). as in the second. when new vertices are more likely to connect to vertices which already have a high degree. In the context of the re-wiring algorithm, one might expect some vertices to be more popular targets of searches than others (as would most definitely be the case if the algorithm was, for example, used to wire up a peer-to-peer network). It is of interest to see whether the rewiring algorithm can adapt also to this situation. (Clearly the distribution of searches has a large effect on what edges are formed during the destination sampling.) In order to separate these results from those above, we return to the original model of Kleinberg – vertices placed in a regular lattice with connections to their nearest neighbors, as well as a single outgoing longrange contact. The out-degree of each vertex is thus still fixed, but the in-degree varies as a result of target popularity. In our experiments, we produce a random order of the vertices, and consider each vertex x’s position in this order, p(x), as its popularity ranking. We then select the targets of queries using power-laws, of the form
4 Results 4.1 Population Density Our results on nonhomogeneous population distributions are shown in Figures 6 – 11. In general, we find that adding shortcuts as done by Kleinberg (2.1) in the grid can work well even when the population is not uniformly distributed. This is shown by the fact that in the metropolis model, where most of the population is limited to a central core, we still get log2 n scaling of the path lengths, see Figure 7. We find that in order for the purely distance based augmentation to fail, we have to turn to highly irregular population models. Previously it was known (see Liben-Nowell et al. [9]) that the Kleinberg augmentation could fail, but it was not clear under what circumstances. We identify one such family, of irregular non–homogeneous distributions, namely the random model described above, where distance based augmentation performs worse than even uniform such (Figure 8). Figures 9 and 10 show the results using the real world data of the population density in Sweden and the USA. As expected due to Liben-Nowell et al.’s (3.3) P(choosing x as a target) ∝ p(x)−β observations of the Internet community data, as well for β ranging from 0 to 2. As well as evaluating as our structurally similar random configuration, purely the performance of the destination sampling under distance based augmentation does not give good result these conditions, we also study the resulting degree here, being beaten even by uniform augmentation. distributions to see if a power-law is actually recovered. Remarkably, the results for the random model are
7
7.5 Explicit by Distance Explicit by Rank Destination Sampling
6.5
Explicit by Distance Explicit by Rank Destination Sampling
7 6.5
6
6
Sqrt. Mean Path
Sqrt. Mean Path
5.5
5
4.5
5.5 5 4.5
4 4 3.5
3.5
3
3
2.5 100
1000
10000
100000
2.5 100
1e+06
1000
10000
Network Size
Figure 7: Performance of greedy routing when augmenting the Delaunay graph of Metropolis distributed points in [0, 1] × [0, 1], using distance based augmentation augmentation (2.1) with α = 2, rank based augmentation (2.2), and destination sampling.
1e+06
Figure 9: Performance of greedy routing when augmenting the Delaunay graph of points distributed according to Sweden’s population, using distance based augmentation (2.1) with α = 2, rank based augmentation (2.2), and destination sampling.
11
11 Explicit by Distance Explicit by Rank Destination Sampling Uniform Shortcuts
10
9
9
8
8
7
6
Explicit by Distance Explicit by Rank Destination Sampling
10
Sqrt. Mean Path
Sqrt. Mean Path
100000
Network Size
7
6
5
5
4
4
3
3
2
2 1000
10000
100000
1e+06
Network Size
Figure 8: Performance of greedy routing when augmenting the Delaunay graph of Random model distributed points in [0, 1] × [0, 1], using distance based augmentation augmentation (2.1) with α = 2, rank based augmentation (2.2), destination sampling, and also choosing shortcuts uniformly.
1000
10000
100000
1e+06
Network Size
Figure 10: Performance of greedy routing when augmenting the Delaunay graph of points distributed according to the population density of the United States, using distance based augmentation (2.1) with α = 2, rank based augmentation (2.2), and destination sampling.
11 Uniform Random Sweden USA
10
Sqrt. Mean Path
9
8
10
7
9
6
8 Sqrt. Mean Path
5
4
3
β=0 β=1.0 β=1.5 β=2.0 Explicit by Distance
7 6 5
2 1000
10000
100000
1e+06
4
Network Size
3
Figure 11: Explicit distance based augmentation gives the same (poor) performance in the Sweden, USA, and Random population models.
almost identical to those for the real world populations (Figure 11), showing that as far as distance based augmentation is concerned, the real world data appears structurally very similar to that produced by the random model. The destination sampling algorithm performs well in all situations – both synthetic test data as shown in Figures 6 - 11 and for real world data, as shown in Figures 9 and 10 – always producing results that scale like log2 n as desired, and consistently performing better than explicit distance or rank based augmentation. We have not been able to find any population distribution or situation where the re-wiring algorithm performs poorly.
2 3 10
4
10
Figure 12: Performance of greedy routing when choosing destination by power-law distributions of different exponent (β in (3.3)), using destination sampling in a one dimensional grid. This is contrasted against explicit augmentation by distance (with α = 1), where the destination distribution of course makes no difference.
β=0
0
10
−2
−2
10
10
−4
−4
10
−6
10
−6
0
10
2
4
10
10
6
β=1.5
0
10
10
0
10
2
4
10
10
6
10
β=2.0
0
10
10
−2
−2
10
10
−4
−4
10
10
−6
10
β=1.0
0
10
10
4.2 Popularity Distributions Figures 12 – 13 show our results when we return to a homogeneous grid, but instead let the popularity of vertices as destinations vary. As in the cases above, we find the destination sampling excels, producing shorter paths than explicit augmentation. In fact, as β increases in (3.3), we find that destination sampling gives shorter and shorter paths. Intuitively, this follows from the fact that since most searches are going to a limited set of vertices, most shortcuts also lead to those vertices, allowing most of the routing to occur within a small subset of the whole graph. This is most clear when β > 1, in which case one can for any ǫ > 0 fix an m such that at least 1 − ǫ of the queries are destined for the m most popular vertices, independent of the graph size n. Indeed, one can see in Figure 12 that we observe no increase in the path lengths for β = 2 after a certain point. In contrast, both the distance based augmentation as well as Liben-Nowell et al. rank based augmentation, which assign fixed probabilities independently of the
5
10 Network Size
−6
0
10
2
10
4
10
6
10
10
0
10
2
10
4
10
6
10
Figure 13: Degree distributions of the graphs created by destination sampling when choosing choosing destinations by power-law, for different values of the exponent (β) in (3.3). the network has 256,000 vertices, each with out-degree one. The plots show the fraction of vertices with each total in-degree (rounded up to the nearest multiple of ten).
11 Explicit by Distance Explicit by Rank Destination Sampling, beta=1.0 Destination Sampling, beta=0.0
10
9
Sqrt. Mean Path
8
7
6
5
case where navigable augmentation is possible (see [6] [26] for a discussion on the limits of this) destination sampling can be used to achieve one. We note that the formulation of the algorithm requires no understanding of the actual situation - the same exact procedure will work regardless of geographic or popularity distribution, which is not true, for instance, when augmenting by rank.
4
3
References
2 1000
10000
100000
1e+06
Network Size
Figure 14: Performance of greedy routing when combining the Sweden population distribution with a powerlaw popularity of the destinations (β as in (3.3)). popularity distribution, of course do not take advantage of the non-uniform popularity distribution at all. The resulting degree distributions are described in Figure 13. One can see that when the destination is selected according to a power-law distribution, the degree of the vertices also end up following such a distribution. This is not particularly surprising, given the way the algorithm functions, but shows that we can generate power-law (“scale-free”) graphs without sacrificing navigability. 4.3 Combined As expected from the above results, destination sampling functions well also when combining both a non-homogeneous geographical population density, and a power-law distribution of destination, see Figure 14. The mean path length is considerably shorter than that attained under either the distance or rank based augmentations. 5 Conclusion We find, as has been observed before, that in geographic networks the augmentation process is sensitive to the environment and distribution of the vertices. If the distribution deviates sufficiently in structure from a uniform placement of the vertices, otherwise effective methods of assigning shortcuts will not work. The destination sampling algorithm, however, is adaptive and will create navigable graphs in all cases that we have studied. Likewise, when the popularity of the different vertices as destinations for searches is uneven, the destination sampling algorithm will adapt and is able to utilize this to find even shorter paths. Given its remarkable ability to create augmentations reflective of each situation, we believe that in any
[1] J. Kleinberg. The small-world phenomenon: an algorithmic perspective. In Proceedings of the 32nd ACM Symposium on Theory of Computing (STOC), 2000. [2] J. Kleinberg. Navigation in a small world. Nature, page 845, 2000. [3] D. Liben-Nowell. An Algorithmic Approach to Social Networks. PhD thesis, MIT Computer Science and Artificial Intelligence Laboratory, 2005. [4] J. Kleinberg. Small-world phenomena and the dynamics of information. In Advances in Neural Information Processing Systems (NIPS) 14, 2001. [5] P. Fraigniaud. Greedy routing in tree-decomposed graphs: a new perspective on the small-world phenomenon. In Proceedings of the 13th European Symposium on Algorithms (ESA), pages 791–802, 2005. [6] P. Duchon, N. Hanusse, E. Lebhar, and N. Schabanel. Could any graph be turned into a small world? Theoretical Computer Science, 355:96 – 103, 2006. [7] O. Sandberg and I. Clarke. The evolution of navigable small-world networks. Technical Report 2007:14, Department of Computer Science and Engineering, Chalmers University of Technology, 2007, arXiv:cs.DS/0607025. [8] O. Sandberg. Neighbor selection and hitting probability in small-world graphs. To appear in The Annals of Applied Probability, 2007, arXiv:math.PR/0702325. [9] D. Liben-Nowell, J. Novak, R. Kumar, P. Raghavan, and A. Tomkins. Geograph routing in social networks. In Proceedings of the National Academy of Science, volume 102, pages 11623–11628, 2005. [10] J. Kleinberg. Complex networks and decentralized search algorithms. In Proceedings of the International Congress of Mathematicians (ICM), 2006. [11] A. Clauset and C. Moore. How do networks become navigable? Preprint, 2003, arXiv:cond-mat/0309415. [12] O. Sandberg. Double clustering and graph navigability. Preprint, 2007, arXiv:0709.0511v1. [13] P. Duchon, N. Hanusse, E. Lebhar, and N. Schabanel. Towards small world emergence. In Proceedings of 18th ACM Symposium on Parallelism in Algorithms and Architectures, 2006. [14] A. Chaintreau, P. Fraigniaud, and E. Lebhar. Networks become navigable as nodes move and forget. Preprint, 2008, arXiv:0803.0248. [15] B. Bollob´ as and F. Chung. The diameter of a cycle
[16]
[17]
[18]
[19]
[20]
[21]
[22] [23] [24] [25] [26]
plus a random matching. SIAM Journal on Discrete Mathematics, 1:328–333, 1988. L. Barriere, P. Fraigniaud, E. Kranakis, and D. Krizanc. Efficient routing in networks with long range contacts. In Proceedings of the 15th International Symposium on Distributed Computing, DISC’01, 2001. R. Kumar, D. Liben-Nowell, J. Novak, P. Raghavan, and A. Tomkins. Theoretical analysis of geographic routing in social networks. Technical Report MITCSAIL-TR-2005-040, Computer Science and Artificial Intelligence Labratory, MIT, 2005. M. Draief and A. Ganesh. Efficient routing in Poisson small-world networks. Journal of Applied Probability., 43:678–686, 2006. Steven Fortune. A sweepline algorithm for Voronoi diagrams. In Proceedings of the second annual symposium on Computational geometry, pages 313–322, Yorktown Heights, New York, 1986. Kwok Tong Soo. Zipf’s law for cities: A cross country investigation. Regional Science and Urban Economics, 35:239–263, 2005. Statistiska Centralbyr˚ an (Statistics Sweden). Rutkarta ¨ over sveriges befolkning, 1995. http://www.scb.se/templates/Standard 20278.asp. United States Department of the Interior. National atlas of the united states. http://nationalatlas.gov/. A.L. Barab´ asi and R. Albert. Emergence of scaling in random networks. Science, 286:509512, 1999. M. Newman. The structure and function of complex networks. SIAM Review, 45:167–256, 2003. B. Bollob´ as and O. Riordan. The diameter of a scalefree random graph. Combinatorica, 24:5, 2004. P. Fraigniaud, E. Lebhar, and Z. Lotker. A doubling dimension threshold theta(loglog n) for augmented graph navigability. In Proceedings of the 14th European Symposium on Algorithms (ESA), 2006.