FOR DETECTING CRACKS IN CONDUCTIVE MATERIALS. Andrea Bernieri ... proposes a novel automatic positioning system together with an adaptive strategy ...
11th IMEKO TC-4 Symp. - Trends in Electrical Measurement and Instrumentation - September 13-14, 2001 - Lisbon, Portugal
ADAPTIVE MEASUREMENT SYSTEM FOR DETECTING CRACKS IN CONDUCTIVE MATERIALS Andrea Bernieri, Giovanni Betta, Luigi Ferrigno DAEIMI, University of Cassino, Cassino (Fr), Via De Biasio, 43, ITALY Phone (+39) 0776299673 Fax (+39) 0776299729 e-mail: {bernieri,betta,ferrigno}@unicas.it In order to overcome this limit, the present paper proposes a novel automatic positioning system together with an adaptive strategy for specimen scanning for improving both spatial resolution and sensitivity in crack detection and reconstruction. The realised measurement station was described in detail and a number of tests, carried out on specimens with known cracks of different kind, is reported.
Abstract – A measurement station able to carry out reliable non-destructive testing on conductive materials was set up and tested. It is characterised by a high flexibility thanking to suitable user interfaces that allows an easy definition of the scanning and measurement parameters. An adaptive scanning strategy allows a reduction of the investigation time by optimising the scanning step in function of the measured data. Experimental results on a number of specimens with known cracks prove the effectiveness of the realised station.
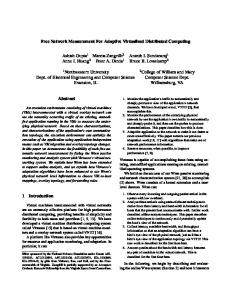
2. THE REALISED MEASUREMENT STATION The design requirements of the automatic NDT measurement station to be realised were: low-cost, small-size, scanning surface of at least (260x260) mm, positioning accuracy better that 0.5 mm, and scanning speed capable of assuring total scanning times of about one minute. At least two degrees of motion have also to be assured, totally and independently remote controlled. The scanning strategy should be interactive, predefined or adaptive, namely driven by the measurement results. The realised measurement station is schematised in Fig. 1, in which both the hardware and the software sections of the system are highlighted and namely: (i) mechanical scanning section; (ii) electrical drive section; (iii) measurement section; (iv) automation software section; (v) measurement software section.
Keywords - non-destructive testing, magnetic transducers, eddy current testing, digital signal processing, automatic measurement systems. 1. INTRODUCTION Sophisticated methods have been developed in order to analyse the structure of materials and, in particular, to make clear internal and superficial defects, such as cracks and notches. In fact at the end of the production and manufacturing process and during the use as well, it is necessary to make sure that significant components do not have any superficial or internal defects (from the structural point of view) that can affect their physical and mechanical properties [1]. For this reason, non-destructive testing (NDT) techniques are required and nowadays available in a considerable number [2]-[10]. Eddy currents (EC) are widely used for NDT of conducting structure, thanking to their low cost and high sensitivity. EC techniques are based on the analysis of the magnetic field perturbation due to eddy currents induced in the material under test. Different solutions have been proposed in the literature based on different techniques for inducing the field in the specimen, for sensing the field perturbation, and for post-processing the results [11]-[12]. The authors have already worked on a specific magnetic field sensor, named “fluxset” [14]-[15], setting up a measurement apparatus for its metrological characterisation [16], [17]. Then they realise and characterise an NDT probe based on the fluxset sensor [18]. A more sophisticated postprocessing techniques for improving the measurement system accuracy was then set up and tested [19]. The actual performance of the realised probes is limited by the reduced resolution and repeatability of the positioning system used. In fact, amplitude and phase field variations need a reliable spatial reference to allow the crack location and reconstruction to be performed.
ISBN 972-98115-4-7 © 2001 IT
Automation SW Section
Measurement SW Section
LabView Automation Software
C++ Measurement Software
Measurement Section IEEE 488 Bus
Tektronix TDS 520D
NDT Probe Personal Computer
National Instruments DAQ Drivers
National Instruments AT-MIO-16E-2
x-y
Control Board and x-Motor
Mechanical Scanning Section
Conditioning Circuit
Control Board and y-Motor Electrical Drive Section
Fig. 1 - Block diagram of the realised measurement station.
10
2.3 The measurement section The core of the system is the NDT probe described in detail in [18]. It is based on three coils (excitation, driving and pick-up) and a core of soft magnetic material. The first coil, supplied by a sinusoidal current, induces the field in the specimen; the second one, supplied by a triangular waveform with a frequency at least 10 times grater than the excitation signal, causes the probe to operate in its saturation region; the third is finally used to measure the perturbation field caused by the presence of the crack. In fact, the pick-up coil signal becomes asymmetrical in the presence of a field component in the direction of its axis due to the presence of cracks, and this signal behaviour can be measured by a time-domain approach [16]. Driver and pick-up coil signals from the NDT probe are then acquired and sent to the PC. In this phase, a two-channel digital oscilloscope (TDS 520D by Tektronix) was used, connected to the PC via a IEEE488 interface. The use of an oscilloscope allows an easy handling of different sampling frequencies together with a large memory depth. Once the characterisation phase will be concluded, a dedicated measurement system will be realised. 2.4 The automation software section The software that handles the automatic motion system (written in LabView 5.01 language) realises two control strategies: interactive positioning and automatic positioning. In the former case, by using a suitable input panel (see Fig. 3), the user can enable or disable each motor, choose the direction and the step size (full or half step). Of course the half
G
M1
M2
G
P G
G a)
b) Fig. 2 – The x-y scanning system a) schematic section with M1,M2 step motors; G guides; P NDT probe; b) the guide system.
2.1 The mechanical scanning section The system has to be robust and compact to allow an easy transportability for its use also in an industrial environment. For this reason, a suitable non-conductive material (medium density wood) is used to realise a rigid structure in which four linear, low friction guides were installed as shown in Fig. 2. 2.2 The electrical drive section Two step motors are linked to the linear guides by using two never-ending screws, one for each motion direction (see Fig. 2a). These motors are than rigidly linked to the teflon support on which the NDT probe is fixed [18]. The chosen motors are four-phase permanent-magnet motors, with a two step per round resolution that, linked to the screw, gives rise to a resolution of 0.0254 mm, with a maximum speed of 425 steps per second. The user can choose the motion parameters (direction, step size, rotation speed) and a digital input/output board (AT MIO-16E-2 by National Instrument) plugged in the PC converts these choices in digital inputs for two independent control boards, one for each motor. The boards then supply the motor phases in a suitable sequence on the basis of the user required motion parameters. A suitable conditioning circuit was realised to adapt the TTL voltage value given by the digital I/O board to the ones required by the controllers (CMOS logic 0-12 V).
Fig. 3 - Input panel for path definition
11
(i)
y (ii) specimen
x Fig.4 – The default automatic path.
step modality is characterised by the higher positioning accuracy and scanning time. In this modality, the motors can be also controlled simultaneously in order to obtain composed motions. The automatic modality allows the user to activate predefined scanning paths, to define new paths, or to activate the adaptive behaviour. The input panel allows also the definition of new paths, as shown in Fig. 3, where the choice of the x and y step amplitudes, and of the x and y scanning area are highlighted. The default automatic path is shown in Fig. 4. The flow chart of Fig. 5 synthesises the adaptive strategy implemented, based on a step size variation as a function of field amplitude and phase variations. 2.6 The measurement software section Once a new position is reached by the scanning system, the measurement software estimate the field value by executing the algorithm already proposed in [19], whose fundamental steps are briefly recalled in the following:
(iii)
(iv)
START
(v) Move in x direction by step X
Excitation frequency estimation: The frequency of the excitation current affects the depth of the analysis in the specimen. Different frequencies can then be used for the same probe in function of the kind of cracks to be looked for. Since an accurate processing requires an optimum choice of the sampling-frequency-to-excitation -frequency ratio [19], the signal processing turns out in an accurate estimation of the excitation frequency performing a windowed interpolated FFT algorithm. Digital filtering: A decimation and a digital filtering are then applied to improve the signal to noise ratio and to eliminate the high frequency harmonics of the signal under test. These components cause strong oscillations around the rising edge and the zero crossing then must be cancelled in order to allow correct measurements to be carried out. Edge linearization: The linearization of the rising edge of the pickup signal is performed by substituting the varying slope of each rising edge with its mean value. To this aim, a best-fit Least Mean Square straight line is evaluated for each rising edge of the acquired and filtered signal (see Fig. 6). Time measurement: A reference straight line with the same slope is then considered, located in correspondence of the zero crossing of the pickup signal. As a matter of fact, in order to improve the measurement repeatability, this second line was located in correspondence of the maximum of the driver signal, instead of the zero crossing of the pickup signal. The time shift ∆t is indeed evaluated as time distance between two parallel lines (Fig. 6). This elaboration is repeated for each pickup signal period, thus obtaining a ∆t signal whose period is equal to the excitation signal one. The amplitude ∆tM and the phase ϕ∆t of this signal are proportional to the amplitude and phase of the magnetic field to be estimated [18]. Magnetic field estimation: By using the characterization test carried out in a previous paper [17], the ∆t values
V
Move in y direction by step Y
b
a
Measure the field
Y
Decrease step X and step Y
End of path ?
∆t
N Field variation > threshold ?
Y
d
N
c
t
STOP
Fig. 6 – Time interval measurement performed by linearising the rising edge (a) pick up coil signal, (b) driving coil signal (c) linearised edge, (d) reference line.
Fig. 5 – The flow chart of the adaptive path
12
can be easily converted in magnetic field values. As a matter of fact, this last elaboration can be skipped in NDT, since the attention is focussed on variations rather than on the absolute value of the field in the specimen. For this reason this last step will be suppressed in the following and all the analysis will be carried out on time interval measurement. ∆tM
These steps (i) to (v) are then repeated on a new acquisition, once a new positioning has been reached.
[µs]
y [mm]
15 45
3. EXPERIMENTAL RESULTS
10
In order to assess the performance of the proposed automatic measurement station, a number of laboratory tests have been carried out on different specimens. In the following, the results of scanning carried out on two specimens of different material are reported. The probe was excited with a 740mA, 1kHz sinusoidal signal, whereas the driving coil was supplied by a 21mA, 25kHz triangular signal. The main characteristics of the probe used are summarised in Tab. I. A standard ISO aluminum alloy specimen with two cracks was considered at first. Fig. 7 reports the geometrical characteristics of the specimen, the considered scanning path (default path with 1 mm x-step and 10 mm y-step), and a zooming of the obtained results in the crack zone for field both amplitude and phase. Fig. 8 reports the results of the scanning on an aluminum specimen with 2 holes (default path with 1 mm x-step and 7 mm y-step). In this case, a different representation of measurement result is used. In particular, images of the field amplitude and of the phase derivative seems to be are more better representative of the specimen under test. The crack location and shape are quite clear from the figures, where also noticeable border effects are clearly visible in the first and last scanning for the proximity to the specimen edges.
25 5 35
45
55
65
75
85
x [mm]
5
a)
ϕ∆t [°]
1.4 y [mm]
1.2
45
1.0
25 0.8 35
45
55
65
75
85 x [mm]
5
b)
4. CONCLUSIONS The paper describes the results of NDT on conductive materials obtained with a novel automatic measurement and scanning system. The integration between the measurement and scanning sections allow the test performance to be improved in terms of both accuracy and testing time. The experimental tests carried out under line the importance of suitable post processing technique to convert the Tab. I – Main characteristics of the NDT probe Excitation Coil Driving Coil
Pick-up Coil
diameter height height diameter number of turns height diameter number of turns
37 mm 65 mm 8 mm 0.5 mm 200 6 mm 0.5 mm 60
c) Fig. 7 – Experimental tests on the aluminum alloy specimen (c): (a) amplitude evolution; (b) phase evolution.
13
ACKNOWLEDGMENTS
measurement information in maps and/or graphs useful to obtain qualitative and quantitative information on the crack shape. Further improvement will be obtained by realising multi-probe NDT systems, employing sensors with either different dimension, direction, or excitation condition, with the aim of increasing the system detection capability also further reducing the scanning time.
The authors wish to thank Ing. Massimiliamo Patriarca for his valuable help in the realisation of the scanning system and PhD. Dr. Maxim Morozov for the useful discussions. REFERENCES [1]
y [mm]
32
[2] [3]
25 [4]
18
[5] [6]
11 40
50
60
70
80 x [mm]
[7]
a)
y
[8]
[mm]
32 [9]
25 [10]
18 [11]
11 [12]
40
50
60
70
80 x [mm] b) [13]
[14] [15]
[16]
[17]
[18]
c)
[19]
Fig. 8 – Experimental tests on the aluminum specimen with holes (c): (a) amplitude x-y map; (b) phase derivative x-y map.
14
“IEE Colloquium on new applications in modelling and inversion techniques for non-destructive testing”, IEE Colloquium on New Applications in Modelling and Inversion Techniques for NonDestructive Testing, 1999, pp. 0-38. D.C. Jiles, “Review of magnetic methods for non-destructive evaluation”, NDT International, vol. 21, n. 5, 1988, pp. 311-319. D.C. Jiles, “Review of magnetic methods for non-destructive evaluation (Part 2)”, NDT International, vol. 23, 1990, pp. 83-92. A. Konig, P. Windirsch, M. Gasteier, and M. Glesner, “Visual inspection in industrial manufacturing”, IEEE Micro, vol. 15, n. 3, 1995, pp. 26-31. G. Hayward, “Developments in transducer technology for ultrasonic non destructive testing applications”, IEE Proceedings on Science, Measurement and Technology, vol. 145, n. 4, 1998, pp. 227-228. M.N. Bassim, M.P. Dudar, R. Rifaat, and R. Roller, “Application of acoustic emission for non destructive evaluation of utility inductive reactors”, IEEE Trans. on Power Delivery, vol. 8, 1993, pp. 281-284. Y. Tomita, K. Hashimoto, and N. Osawa, “Nondestructive estimation of fatigue damage for steel by Barkhausen Noise analysis”, NDT&E International, vol. 29, n. 5, pp. 275-280, 1996. V.V. Nagarkar, J.S. Gordon, S. Vasile, P. Gothoskar, and F. Hopkins, “High resolution X-ray sensor for non-destructive evaluation”, IEEE Transaction on Nuclear Science, vol. 43, n. 3, 1996, pp. 1559-1563. S. Daróczi, J. Szöllõsy, G. Vértesy, J. Pávó, and K. Miya, “Electromagnetic NDT material testing by magnetic field sensor”, in Studies in Applied Electromagnetics and Mechanics 8, Nondestructive Testing of Materials, Eds: R.Collins, W.D. Dover, J.R.Bowler and K. Miya, IOS Press, Amsterdam, 1995, pp.75-86. A.Flammini, D.Marioli, E.Sardini, and A. Taroni, “Robust estimation of magnetic Barkhausen noise based on a numerical approach”, Proc. of IMTC/2001, Budapest (HUN), vol. 2, 2001, pp. 1214-1219. J. L. Rasolonjanahary, F. Thollon, and N. Burais, “Study of eddy current non destructive testing system in riveted assemblies”, IEEE Transactions on Magnetics, vol. 32, n. 3, pp. 1585-1588, 1996 T. Takagi, M. Uesaka, and K. Miya, “Electromagnetic NDE research activities in JSAEM electromagnetic nondestructive evaluation”, Eds: T. Takagi et al., IOS press, Amsterdam, 1997, pp. 9-16. S. Barcherini, L. Cipiccia, M. Maggi, S. Fiori, and P. Burrascano, “Non destructive test by the Hopfield network”, Proceedings of the IEEE-INNS-ENNS International Joint Conference on Neural Networks, vol. 6 , 2000, pp. 381-386. J. Pavo and A. Gasparics, “Numerical calibration of fluxset probe for quantitative eddy current testing”, Proceedings of 8th IGTE Symposyum, Graz (Austria), 1998, pp. 387-390. R. Albanese, G. Rubinacci, A. Tamburrino, and F. Villone, “Reconstruction of cracks with integral methods”, Electromagnetic Nondestructive Evaluation (II), Eds.: R. Albanese, G. Rubinacci, T. Takagi, S.S. Udpa, IOS Press, Amsterdam, 1998, pp. 107-113. A. Bernieri, G. Betta, G. Rubinacci, and F. Villone, “A measurement system based on magnetic sensors for non destructive testing”, IEEE Transactions on Instrumentation and Measurement, vol. 49, n.2, April 2000, pp. 455-459. R. Albanese, G. Rubinacci, and F. Villone, “Direct and inverse calculations for craks of different shapes”, 4th International Workshop on Electromagnetic Non-destructive Evaluation, (E’NDE ’98), Chatou (France). A. Bernieri and G. Betta, “Metrological characterization of an eddycurrent-based system for non-destructive testing”, Proc. IMTC/2000, Baltimore (USA), vol. 3, 2000, pp. 1608 –1611. A. Bernieri, G. Betta, and L. Ferrigno, “Improving non-destructive testing probe performance by digital processing techniques”, Proc. of IMTC/2001, Budapest (HUN), vol. 2, 2001, pp. 1291 –1295.