Based on measurements conducted at the Internet service provider (ISP) dial-in modem/ISDN link of the University of Dortmund, we present a non real-time ...
Adaptive Performance Management for UMTS Networks Christoph Lindemann, Marco Lohmann, and Axel Thümmler University of Dortmund Department of Computer Science August-Schmidt-Str. 12 44227 Dortmund, Germany http://www4.cs.uni-dortmund.de/~Lindemann/
Abstract In this paper, we introduce a framework for the adaptive control of UMTS networks in order to improve bandwidth utilization of the radio channels. The key contribution of the paper constitutes the introduction of a performance management information base for dynamically adjusting the packet scheduler and admission controller. Thus, the adaptive control framework closes the loop between network operation and network control. Furthermore, the adaptive control framework can effectively deal with the different time scales of packet scheduling and admission control. Moreover, we present a traffic model for non real-time UMTS traffic based on measured trace data. The analysis and scaling process of the measured trace data with respect to different UMTS bandwidth classes constitutes the basic concept of this traffic characterization. Using this traffic model and simulation on the IP-level, the gain of employing the adaptive control framework is illustrated by performance curves for various QoS measures.
Keywords: 3G Wireless Systems, Performance Management, QoS Provisioning, Discrete-event Simulation.
-2-
1
Introduction
Third generation (3G) mobile communication systems like the Universal Mobile Telecommunications System (UMTS) are characterized by a migration from voice-only to integrated services networks with data rates up to 2 Mbps. Thus, applications such as e-mail, Web browsing, and corporate local network access, as well as video conferencing, ecommerce, and multimedia can be supported over wireless data channels. UMTS provides the technical foundation for integrating the currently separate worlds of mobile and fixed telecommunications services into a unified digital data environment. Recently, the global wireless industry has created a global partnership project, the 3rd Generation Partnership Project (3GPP) [1], for standardization of UMTS. This standardization process of UMTS is still ongoing (see e.g., [16]). The QoS concept and architecture for UMTS networks has been specified by the 3GPP in [2]. There, the terms of the UMTS management and control functions (e.g., admission controller and resource manager) are defined and their functionality is roughly outlined. However, a detailed technical understanding how network management should effectively be performed for UMTS networks is subject to current industrial and academic research. In a visionary paper, Schwartz posed the engineering challenges in network management and control occurring from the introduction of multimedia services for 3G wireless networks [24]. Due to the scarce and costly radio frequencies for 3G wireless networks, adaptive resource management constitutes an important design issue for such networks. Das, Jayaram, Kakani, and Sen proposed a framework for QoS provisioning for multimedia services in 3G wireless access networks [12]. They developed an integrated framework by combining various approaches to call admission control, channel reservation, bandwidth degradation, and bandwidth compaction. Záruba, Chlamtac, and Das proposed an admission control framework for optimal call mix selection to maximize the revenue earned by the service provider [26]. Their framework includes admission and degradation of calls based on priorities. Traffic models for wireless IP networks have been addressed in several recent papers. Krunz and Makowski utilized a M/G/∞ process for real-time video traffic modeling [21] whereas Coutras, Gupta, and Shroff proposed a Markov-modulated fluid process that serves as real-time traffic source [9]. In the UMTS standard [15] recommendations for traffic models are given, which include parameterized distributions for real-time and non real-time services, but detailed characteristics are given for WWW traffic only. However, the non real-time traffic models are not derived from real measurements, which motivates a characterization of future non real-time UMTS traffic based on measurements in network environments comprising of comparable characteristics. In this paper, we introduce a framework for the adaptive control of UMTS networks. The basic idea lies in dynamically adjusting the packet scheduler and admission controller by means of a performance management information base. The adaptive control framework
-3comprises of two major innovations not considered in previous work [12], [14], [17], [22]. That is: (1) effectively dealing with the different time scales of packet scheduling and admission control; (2) closing the loop between network operation and network control. Thus, the adaptive control framework tackles a major challenge for the effective control of wireless IP networks, i.e., dealing with multiple control loops which operate on different time scales [10]. Packet scheduling operates on a fine time scale in the order of milliseconds whereas admission control operates on a coarse time scale in the order of seconds to minutes. System parameters to be controlled during network operation comprise of queueing weights for packet scheduling, a threshold value of the access queue for admission of elastic traffic (i.e., non real-time traffic), and watermarks specifying bandwidth portions of the overall available bandwidth for data, voice, and handover traffic of the UMTS air interface. We introduce a Performance Management Information Base (P-MIB) to improve overall QoS for different system configurations. The performance management information base contains for each feasible network configuration the optimal setting for the system parameters (i.e., queueing weights, threshold value of the access queue, and the watermarks). Online monitoring of system performance allows an adaptive performance management by quickly reacting to changes in the system performance parameters. Based on measurements conducted at the Internet service provider (ISP) dial-in modem/ISDN link of the University of Dortmund, we present a non real-time traffic model for UMTS networks applying the idea of the single user traffic model [20]. The key insight of this modeling approach lies in an scaling procedure of the measured trace data towards UMTS bandwidth requirements. A simulator on the IP level for the air interface of UMTS has been implemented using the simulation library CSIM [11]. Performance curves derived by simulation evidently illustrate the gain resulting from employing the adaptive control framework proposed in this paper. In fact, for the considered cellular UMTS network, simulation results show that QoS measures such as handover failure probability and packet loss probability are improved significantly. The remainder of the paper is organized as follows. Section 2 describes the framework for adaptive performance management comprising of an admission controller, packet scheduler, and the performance management information base. Section 3 provides a comprehensive characterization of real-time and non real-time traffic in 3G mobile networks based on the idea of a single user traffic model. In Section 4, we present simulation results to show the benefit of employing the proposed framework for adaptive performance management. Finally, concluding remarks are given.
-4-
2
The Framework for Adaptive Performance Management
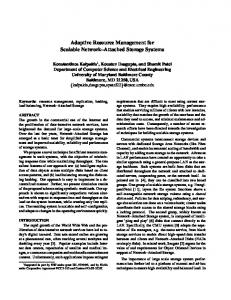
2.1 UMTS Network Architecture and Quality of Service Classes The UMTS network architecture standardized by the 3GPP distinguishes the UMTS access network, i.e., the UMTS Terrestrial Radio Access Network (UTRAN), and the UMTS core network [3]. The UTRAN consists of a set of Radio Network Controllers (RNC) that are connected to the core network through the logical interface Iu. The core network comprises of the same supporting nodes as already introduced in GSM Phase 2+ (e.g., Mobile Switching Center or General Packet Radio Service Support Nodes). They are responsible for handling circuit switched connections and tunneling packet switched data to public networks (e.g., the Internet). A RNC is connected through the Iub interface to a set of Node B elements, each of which can serve one or several cells (depending on omni-directional or sector cells). The RNC is responsible for control of the connected Node B elements, i.e., transceiver stations, and the radio link Uu to the mobile stations (MS). Inside the UTRAN, the radio network controllers can be interconnected together through the Iur interface to support smooth handover for mobile stations leaving the area covered by the serving RNC and entering the area of a drift RNC. The UTRAN architecture is presented in Figure 1. The (Quality of Service) QoS architecture specified for UMTS by ETSI 3GPP [2] distinguishes between four QoS classes: conversational class, streaming class, interactive class, and background class. The main distinguishing factor between these QoS classes lies in the delay sensitivity of the traffic. The conversational class is meant for traffic which is very delay sensitive while the background class is the most delay insensitive traffic class. Conversational and streaming classes are mainly intended to be used to carry real-time traffic
C o r e N e tw o r k Iu
Iu
U T R A N
Iu r
R a d io N e tw o r k C o n tr o lle r Iu b
N o d e B
Iu b
R a d io N e tw o r k C o n tr o lle r Iu b
N o d e B
N o d e B
M S
Iu b
N o d e B
U u
Figure 1. Architecture of UMTS Terrestrial Radio Access Network
-5flows. A conversational real-time traffic stream is characterized by requiring low transfer delay and small delay-jitter because of the conversational nature of the stream. The maximum transfer delay is given by the human perception of video and audio conversation (e.g., video conferencing or voice over IP). The streaming traffic class consists of one-way real-time traffic streams, e.g., viewing video clips or audio clips. The limit for acceptable transfer delay and delay-jitter is not as stringent as in the conversational class. Delay-jitter can be reduced by a time alignment function at the receiver that buffers data packets temporarily. Interactive class and background class are mainly meant to be used by traditional Internet applications like WWW, e-mail, and FTP. The main difference between the interactive and the background class is that interactive class is mainly used by applications as e.g., interactive Web browsing, while background class is meant for e.g., background download of e-mails or background file downloading. Traffic in the interactive class has higher priority than background class traffic. Thus, background applications use transmission resources only when interactive applications do not need them. This is very important in a wireless environment where considerably less bandwidth capacity than in core networks is available.
2.2 Admission Control Based on Adaptive Bandwidth Partitioning The proposed framework distinguishes three different types of services: circuit-switched services, and packet-switched real-time (RT) and non real-time services (NRT). In general, circuit-switched services are voice calls from a common GSM mobile station. Real-time services correspond to the UMTS conversational and streaming class and non real-time services to the UMTS interactive and background class [2]. The bandwidth available in a cell must be shared by calls of these different service classes and the different service requirements have to be met. Before a mobile session starts, the mobile user needs to specify its traffic characteristics and desired performance requirements by a QoS profile. Then, an admission controller decides to accept or reject the users request based on the QoS profile and the current network state as e.g., given by queue length. The purpose of the admission controller is to guarantee the QoS requirements of the user who requested admission while not violating the QoS profiles of already admitted users. The call admission criteria will be different for each service class. Admission control of real-time sessions is based on a QoS profile that specifies a guaranteed bitrate that should be provided to the application to work proper. If the desired bandwidth requirements can not be satisfied by the network the corresponding admission request is rejected. Non real-time sessions will be admitted by concerning the current network state, i.e., queue length as specified later. In the following, we propose a partitioning of the available bandwidth in one cell to meet the QoS requirements of the three considered service classes: voice calls, RT sessions, and
-6NRT sessions. The bandwidth partitioning constitutes the rationale behind the admission control. Figure 2 illustrates the partitioning of the available bandwidth into different areas. Let B be the overall bandwidth available in one cell. A portion bh of the bandwidth B is exclusively reserved for handover calls from neighboring cells in order to reduce handover failures. A portion bp is reserved for real-time and non real-time data packets, i.e., packets only. The remaining bandwidth (1− b h − b p ) ⋅ B can be allocated “on demand” by voice calls and data sessions, respectively. Because in future UMTS networks (around the year 2010) voice calls will still play a major role in bandwidth requirements [25], we introduce a portion bv of the overall bandwidth with priority of voice calls, i.e., voice priority preempt packets. This means, if more bandwidth than (1− b h − b v ) ⋅ B is allocated for packet data calls and the remaining bandwidth is not sufficient for accommodating a newly arriving voice call, real-time sessions have to be degraded below their guaranteed bandwidth. In fact in this case the bitrate guarantee given to real-time users will be violated but as can be seen by the experiments presented in Section 4 the probability of real-time session degradation is negligible for small values bv. The remaining on demand bandwidth is allocated on a first-comes first-served (FCFS) basis to voice calls or real-time sessions. In order to give non real-time traffic a certain amount of bandwidth, a portion bn of the bandwidth actually available for packet data is exclusively reserved for non real-time packets: NRT packets. Let Bv(t) be the bandwidth reserved for all voice calls at a certain time point t, then for packet data bandwidth of size Bp(t) := B − Bv(t) is available.
F irs t c o m e s firs t s e rv e d
Table 1 shows the different call types arriving in the cell and the corresponding conditions under which these call arrivals will be admitted in a compact notation. Let t be the point in time when an admission request arrives at the admission controller. For real-time users, P a c k e ts o n ly
b p·B
N R T p a c k e ts
b n·B p( t)
V o ic e p r io r ity p r e e m p t p a c k e ts H a n d o v e r
b v·B b h·B
Figure 2. Dynamic partition of the available bandwidth
-7Conditions for Admission Bv + Bv ( t ) ≤ Voice Real-time
= B > CL B + B ( t ) ≤ min;(1 − b ) ⋅ B − B ( t ),(1 − b ) ⋅ ( B − B ( t ))@
Non real-time
NRT queue length at admission request time ≤ η ⋅ K NRT
Voice handover
Bv + Bv ( t ) ≤ max b v ⋅ B,(1 − b h ) ⋅ B − max b p ⋅ B, 1−1b n ⋅ Br ( t )
J
max b v ⋅ B, min (1 − b h ) ⋅ B − max b p ⋅ B, Br ( t ) , B − 1−1b n ⋅ Br ( t ) r
r
h
v
n
v
>
J
1
CL
6
Real-time handover Br + Br (t ) ≤ (1 − b n ) ⋅ B − Bv ( t )
Table 1. Call admission conditions for different call types admission is based on the availability of the guaranteed bandwidth specified in the QoS profile. Let Br(t) be the bandwidth already allocated for real-time traffic at time t and let Br be the bandwidth required by the user who requested admission. The user will be admitted according to the bandwidth partitioning illustrated in Figure 2. That is, if after call admission the handover bandwidth is still available, i.e., Br + Br ( t ) ≤ (1 − b h ) ⋅ B − Bv ( t ) , and a portion bn of the overall packet bandwidth Bp(t) is also still available for non real-time sessions, i.e., Br + Br (t ) ≤ (1 − b n ) ⋅ B − Bv ( t ) . These two cases are combined in the corresponding formula of Table 1 by a minimum operator. New voice calls with bandwidth requirements Bv will be admitted, if either less than b v ⋅ B bandwidth (voice priority preempt packets area of Figure 2) is allocated for voice calls or if the voice call can be accommodated in the FCFS area without violating bandwidth requirements of ongoing calls. The corresponding formula presented in Table 1 can be derived in a similar way as for real-time sessions.
1
6
Data packets arriving at the Radio Network Controller are queued in two distinct queues until they are scheduled to be transmitted over the radio link. We distinguish a real-time queue (RTQ) with capacity KRT and a non real-time queue (NRTQ) with capacity KNRT. For non real-time sessions, the admission is based on the availability of buffer space in the non real-time queue. This criteria may be set against certain buffer availability threshold of the capacity KNRT, denoted by η, in order to prevent buffer overflow once the call is admitted. The admission criteria for voice and real-time handovers are the same as for new voice calls and real-time sessions except that additional handover bandwidth can be utilized. The admission controller does not prioritize non real-time handovers over new non real-time sessions.
2.3 The Packet Scheduler At a radio network controller responsible for a cell cluster, data packets from various connections arrive and are queued until bandwidth for transmission is available. The service discipline at this base station controls the order in which packets are served and how packets
-8in transfer share the available bandwidth. Various service disciplines for packet scheduling of guaranteed service and best-effort connections have been summarized in [27]. Figure 3 illustrates the proposed queues for data packets that are implemented in the radio network controller. Recall that data packets that arrive at the radio network controller are logically organized in two distinct queues. In each Node B element corresponding to one cell, a transfer queue is implemented that contains the packets actually in transfer. The available bandwidth capacity is shared over the packets in the queue according to their QoS requirements and bandwidth partitioning. Each time one of the following events occurs the available bandwidth is newly assigned to packets in transfer by a packet scheduler: (i) admission of new voice call or handover (ii) termination of a voice call due to call termination or handover (iii) transfer of a RT or NRT data packet is finished (iv) arrival of a RT packet of user i at the radio network controller with no RT packet of user i waiting in the RTQ or been in transfer (v) arrival of a NRT packet at the radio network controller with no NRT packets waiting in the NRTQ and still bandwidth capacity available for NRT packets In order to distinguish different priorities for NRT traffic corresponding to the traffic handling priority defined by 3GPP [2], a weighted Round Robin scheduler or more complex scheduling strategies like Weighted Fair Queueing (WFQ) [13] or WF2Q [7] have to be implemented. An overview of queueing issues in wireless networks can be found in [8]. Whenever the packet scheduling is initiated due to the occurrence of one of the events (i) to (v) the available bandwidth is newly assigned to packets in transfer. The allocation of bandwidth is performed by the algorithm presented in Figure 4. Let t be the point in time when the packet scheduling is initiated. Voice calls are assumed to be circuit-switched. Therefore, each voice call allocates a fixed amount of bandwidth during its lifetime (see step (1)). In steps (3) to (9) of Figure 4 the bandwidth requirements Br(t) needed to satisfy the R e a l-tim e q u e u e
a rriv in g IP p a c k e ts K
P a c k e t p o llin g
R T
N o n re a l-tim e q u e u e K
N R T
h ·K
N R T
IP p a c k e ts s e le c te d fo r tra n s fe r
P a c k e ts s h a rin g b a n d w id th
T ra n sfe r Q u e u e
Figure 3. Real-time queue, non real-time queue, and transfer queue
-9(1) (2) (3) (4) (5) (6) (7) (8) (9) (10) (11) (12) (13)
calculate new voice bandwidth Bv(t) and share Bv(t) among all active voice calls Br(t) = 0 FOR ALL active real-time users i DO IF packet of user i in transfer THEN DO increase Br(t) by guaranteed bitrate of user i ELSE IF real-time queue of user i not empty THEN poll packet of user i in transfer queue and increase Br(t) by guar. bitrate of user i OD OD WHILE Br(t) > (1 − bn)·Bp(t) DO degrade real-time sessions stepwise OD share remaining bandwidth according to a common scheduling discipline among active NRT users (14) WHILE degraded real-time sessions exist AND still free bandwidth available DO (15) increase bandwidth of degraded real-time session (16) OD Figure 4. Scheduling discipline assigning bandwidth to different users
guaranteed bitrate for real-time users is computed. If a portion bn of the remaining packet bandwidth is not anymore available for non real-time packets then real-time sessions have to be degraded (see steps (10) to (12) in Figure 4). Recall that this can only happen if bandwidth requirements for real-time packets are so exhaustive that they occupy the voice priority preempt packets areas (see Figure 2) and an additional voice call is admitted in the cell. The degradation of real-time sessions if performed stepwise. That is, in each degradation step all real-time sessions are degraded to a specified level before starting the next degradation step if necessary. After assigning bandwidth to real-time sessions the remaining bandwidth is allocated to non real-time traffic (see step (13)). If still bandwidth available then degraded real-time sessions can be increased to their guaranteed bandwidth again (see steps (14) to (16)).
2.4 The Performance Management Information Base This section introduces the framework for adaptively adjusting system parameters at a radio network controller (i.e., a base station responsible for a cluster of cells). This adaptive framework constitutes the main contribution of the paper. To maximize QoS for the mobile users, a performance management entity has to be introduced in a radio network controller that is responsible for corresponding transceiver stations (i.e., Node B elements). Furthermore, a radio network controller has to be extended by an online performance measurement component that derives performance measures in a certain time window (e.g., handover failure probabilities of mobile users). These performance measures form a system pattern. The system pattern is submitted in fixed time intervals to the performance
-10-
R a d io N e tw o r k C o n tr o lle r Iu b
P -M IB
S y s te m
P e r fo r m a n c e M a n a g e m e n t P a ra m e te r u p d a te
A d m is s io n C o n tr o lle r
S y s te m P a ra m e te r
p a tte rn
O n lin e P e r fo r m a n c e M o n ito r in g
Iu
P a c k e t S c h e d u le r
Figure 5. System architecture for adaptive performance management management entity which subsequently updates the system parameters (i.e., parameters of traffic controlling components like the admission controller and packet scheduler). The update of system parameters is made as specified in a Performance Management Information Base (P-MIB). Figure 5 shows a detailed view of the proposed adaptive framework for performance management that should be hosted in a radio network controller. System parameters which are adjusted by the performance management entity comprise of: •
bandwidth portions bh, bp, bv, bn
•
non real-time queue threshold (portion η of buffer size)
•
queueing weights wi for non real-time packets with priority i
Thus, the proposed framework takes into consideration the different time scales of network control and operation. The parameters bh, bp, bv, and bn corresponding to bandwidth partitioning and the threshold η are parameters that effect the system at the connection-level, i.e., admission control, which operates on a coarse time scale in the order of seconds to minutes. The queueing weights effect the system at packet-level operating on a fine time scale in the order of milliseconds [22], [27]. That is they control packet loss probabilities of connections with priority 1 (high), 2 (normal), and 3 (low). Thus, adaptively changing these parameters improves the system control at two different time scales. The UMTS system parameters can effectively be updated by monitoring QoS measures which immediately affect these parameters. For ease of notation, we abbreviate the QoS measures handover failure probability and call/session blocking probability corresponding to voice calls and real-time sessions by HFP and CBP, respectively. The packet loss probability of the NRT queue is abbreviated by PLP. The average number of active NRT sessions with priority 1, 2, and 3 is denoted by NRT1, NRT2, and NRT3. Determining the updates for the system parameters, i.e., determining b (hnew ) and η( new ) , and the updated queueing weights w1(new ) , w (2new ) , and w (3new ) can be performed based on the dependencies (1), (2), and (3) to the corresponding old values and the actually observed QoS measures HFP, CBP, PLP, NRT1, NRT2, NRT3. That is:
-11(1) b (hold ) , HFP, CBP
→ b (hnew )
(2) η( old ) , PLP
→ η( new )
(3) NRT1, NRT2, NRT3
→ w1(new ) , w (2new ) , w (3new )
The online monitoring of QoS measures is performed by a sliding window technique as depicted in Figure 6. The width of the sliding window depends on the number of relevant events that occur according to a performance value (e.g., non real-time packet arrivals are relevant events for computing PLP). The upper part of Figure 6 shows the sliding window at a certain time point t0. Assuming that at time t1 the next relevant event occurs the sliding window moves in time as shown in the lower part of Figure 6. After a certain number of relevant events are occurred a system parameter update is performed based on the performance measure derived from the sliding window (e.g., update of η according to PLP derived from sliding window). Note that an accurate online monitoring of performance values requires a sliding window that is not too small. A certain number of events representing the history of the performance value have to be considered to get an expressive performance measure. On the other hand considering a big sliding window prevents the performance management entity from fast reaction on changing traffic conditions. A bigger sliding window contains more history and thus more events have to be collected to cause a significant change in the online measured performance value. We studied this tradeoff between accurate online monitoring and fast reaction of the P-MIB to changing traffic conditions in several experiments with varying call arrival rate to get the optimal width of the sliding window for each performance measure. Table 2 shows an extract of the P-MIB controlling the system parameters bh and η. The entries of the P-MIB are determined off-line using the simulator of the UMTS system. In each simulation experiment, one parameter is varied while all others are kept fixed in order to find the value of this parameter which improves the QoS measures. Thus, the entire parameter s lid in g w in d o w w ith re le v a n t e v e n ts fo r a p e rfo rm a n c e m e a s u re t0 a rriv a l o f re le v a n t e v e n t a t tim e t1
u p d a te o f c o rre s p o n d in g s y s te m
t
p a ra m e te r t0
t1
Figure 6. Online performance monitoring and system parameter update
t
-12-
kHFP
kCBP
P-MIB for NRT threshold η kPLP
(0.5 , 1]
1.110
0.936
0.960
(0.4 , 0.5]
1.105
0.939
0.965
(0.3 , 0.4] ...
1.100 ...
0.943 ...
0.970 ...
(0.001 , 0.005]
1.014
0.996
1.010
(0 , 0.001]
0.980
1.020
1.020
P-MIB for handover bandwidth bh
Table 2. Performance Management Information Base for system parameters bh and η space is explored off-line using simulation for deriving the entries of the P-MIB. The values derived in this way can be verified by some heuristics. For example, if the handover failure probability is high, the portion of the bandwidth reserved for handover, bh, should be increased. Determining b(hnew ) and η( new ) is performed based on their previous settings as shown in Figure 7. In fact, for b (hnew ) the product of the factors kHFP, and kCBP corresponding to the actually observed HFP and CBP is taken into account. For η( new ) the factor kPLP representing PLP is taken into account. Note that a high HFP should increase b(hnew ) but this obviously also increases the CBP because less bandwidth is available for new voice calls and real-time sessions. Therefore, the factors presented in Table 2 are chosen such that if the probabilities HFP and CBP lie in the same interval, e.g., (0.3, 0.4], the product of corresponding factors kHFP and kCBP results in a value greater one. That is, the bandwidth reserved for handovers will be increased. Thus, handover calls are slightly prioritized over new voice calls or realtime sessions if their blocking probability is equal. Note that the values b (hnew ) and η( new ) are truncated at a lower bound of 0.1% and an upper bound of 1 − b v − b p for b(hnew ) and 1 for η( new ) , respectively. The truncation at the lower bound guaranties that values of bh and η do not accumulate near zero for long periods of low traffic load and the truncation at the upper bound guarantees that the computation of b (hnew ) and η( new ) results in valid values. After deriving the factors kHFP, kCBP, and kPLP from the P-MIB, update the bandwidth partition and threshold value according to (1) and (2): b(hnew) = k HFP ⋅ k CBP ⋅ b (hold ) η( new) = k PLP ⋅ η( old ) Update the queueing weights according to (3): w1( new ) =
4 ⋅ NRT1 , w
w (2new ) =
2 ⋅ NRT2 , w
w (3new ) =
1 ⋅ NRT3 w
with w = 4 ⋅ NRT1 + 2 ⋅ NRT2 + 1 ⋅ NRT3 . Figure 7. Procedure for updating the system parameters using the P-MIB
-13The update of the queuing weights i.e., determining w1(new ) , w (2new ) , and w (3new ) is made according to the measured average number of non real-time sessions belonging to priorities 1, 2, and 3 in the cell. Figure 7 specifies how to update the queueing weights for a weighted Round Robin scheduling discipline with three classes corresponding to the three priorities. If the number of users in the cell of priorities 1, 2, and 3 is equal, the weights will be set to 4, 2, and 1. If the number of users is not the same for each priority class, the weights will be adjusted such that the traffic class with the highest user population is prioritized. That is for example, if the majority are low priority users, the weight for low priority should be increased. We use the square root of the measures NRT1, NRT2, and NRT3 in order to smooth the described influence of the number of non real-time users on the queueing weights. For other scheduling disciplines like WFQ and WF2Q corresponding schemes can be derived in a similar way. The overhead introduced by the adaptive performance management is insignificant because the online performance monitoring component and the performance management component both reside in the radio network controller. Therefore, no time consuming signaling is needed. Furthermore, no additional signaling is needed for information exchange among different cells for reserving handover bandwidth capacity. This is due to the implicit allocation of handover bandwidth by the performance management component based on the handover flow and not explicitly by radio network controllers corresponding to neighboring cell clusters.
3
Traffic Characterization for 3G Wireless Networks
3.1 The Single User Traffic Model We consider UMTS users active in a base station area. Each user generates packet data traffic by utilizing different applications, which can be partitioned in real-time and non real-time applications. We assume further that real-time and non real-time applications are mutually exclusive for a single UMTS user. The traffic model for non real-time applications utilizes the notion of the single user traffic model [20], where a user runs non real-time applications, i.e., HTTP, Napster, e-mail, UDP, and FTP, according to a characteristic usage pattern. Moreover, a single user can run different applications that may be concurrently active, e.g., WWW browsing while downloading Napster music files. Each application is fully described by its statistical properties, which comprise of an alternating process of ON- and OFF-periods with some application specific length or data volume distribution, respectively. Within each ON-period the packet arrival process is completely captured by the packet interarrival-times and the corresponding packet sizes. Thus, the single user traffic model characterizes the non real-time traffic that an individual user generates and is employed on three different levels:
-14(1) The session-level describes the dial-in behavior of the individual users, characterized by the session interarrival-time distribution and the session data-volume distribution. (2) The connection-level describes for each individual application the corresponding distribution of connection interarrival-times and connection data volume, respectively. (3) The packet-level characterizes the packet interarrival-time distribution and the packet size distribution within the application specific connections. During an ON-period, i.e., an application specific connection, the user applies the appropriate application in an active fashion. The interarrival-time between two successive connection starting points of the same application-type and the data volume of each connection are drawn from general distributions, respectively. The packet interarrival-times within each connection and the corresponding packet sizes are also drawn according to an application dependent distribution. Thus, the overall traffic stream of a user constitutes of the superposition of the packet arrival process of all application connections within the user’s session.
3.2 Real-Time and Non Real-Time Traffic Characteristics For real-time applications we utilized the approach proposed in [21], where VBR video traffic is modeled in terms of time-discrete M/G/∞ input processes. This model is based on measured video streams and efficiently captures the correlation structure of the considered video traffic applying the time-discrete M/G/∞ input process. Subsequently, the generated traffic is transformed utilizing a hybrid Gamma/Pareto numerical transformation in order to capture the marginal distribution of the measured traffic stream. For further details of the real-time traffic model we refer to [21]. Note that this traffic model does not propose information for modeling real-time session durations. Therefore, we assume session durations to be exponentially distributed (see Section 4 for details). Recent recommendations for non real-time traffic models are proposed in [5] and [15]. As a drawback, these traffic models are not derived from real measurements, which motivates a characterization of future non real-time UMTS traffic based on measurements in network environments comprising of comparable characteristics. In [20] Kilpi and Norros showed that IP traffic of current Internet Service Providers (ISP) inhibits many characteristics of future UMTS traffic, i.e., different access speeds, influence of the user behavior due to different tariff limits, as well as asymmetric up- and downlink traffic. The main difference between the measured IP traffic at dial-in modem/ISDN link and future UMTS traffic constitutes of the different bandwidth classes of individual users. Thus, based on measurements conducted at the ISP dial-in modem/ISDN link of the University of Dortmund, we present a non real-time traffic model for UMTS networks applying the idea of the single user traffic model described
-15above. The key insight of this modeling approach lies in an appropriate scaling procedure of the measured trace data towards UMTS bandwidth requirements. During the measurement over a four-week period in January 2001, approximately 110,000 user sessions with a total data volume of 120 GB have been logged. All measurements have been conducted at the Ethernet link between the dial-in routers and the router connection to the Internet. We used the TCPdump software package running on a Linux client for sniffing all IP packet headers sourced or targeted by dial-in users. For each IP packet the arrival timestamp, the source port, the target port, the packet length, and other TCP header information have been recorded. Moreover, we partitioned the dial-in users in the following bandwidth classes: 9.6 kbps, 14.4 kbps, 28.8 kbps, 33.6 kbps, 56 kbps, and 64 kbps (ISDN). In [19], we observed that each statistical measure of the three traffic levels (session-, connection-, and packet-level) comprise of a characteristic distribution which is independent of the dial-in user’s bandwidth class, e.g., the HTTP connection interarrival-times are distributed according to a lognormal distribution. Therefore, the distribution of a specific statistical measure differs only by the parameter values of the characteristic distribution for different bandwidth classes. In order to find such a characteristic distribution for a specific statistical measure we use a least-squares regression with respect to the bandwidth classes Step 1: Find bandwidth-dependent trends in the mean and the variance of the considered statistical measures. Utilize the least-squares regression method on the mean and variance with respect to increasing bandwidth for each statistical measure. We use the following functions as underlying regression models.
05 (b) f 0 x 5 = a + b ⋅ log(c ⋅ x ), a logarithmic shape. (c) f 0 x 5 = a + b ⋅ log(c ⋅ x ) + d ⋅ x , a mixture of a logarithmic and linear shape. (d) f 0 x 5 = a + b ⋅ x , a linear shape. (a) f1 x = a + b ⋅ log 2 (c ⋅ x ), a double logarithmic shape. 2
3
4
Step 2: Get the parameterized function of Step 1, which comprises of the least squares residual value. Subsequently, use this parameterized function in order to derive values for mean and the variance corresponding to the UMTS bandwidth classes 64 kbps, 144 kbps, and 384 kbps. Step 3: For each statistical measure, utilize its characteristic distribution and the mean and variance, calculated in Step 2, to get the parameter values of the characteristic distribution. This task can be performed by solving a non-linear equation system, comprising of the analytical formulas for corresponding mean and variance and the values for mean and variance derived in Step 2. Figure 8. Algorithm for bandwidth scaling for UMTS networks [19]
-169.6 kbps, 14.4 kbps, 28.8 kbps, 33.6 kbps, 56 kbps, and 64 kbps. We utilized the following set of probability density functions (pdf) that can closely match the considered statistical measures: Lognormal, Pareto, Weibull, Gamma, and Exponential. In the following, the maximum bandwidth capability of future UMTS handheld devices is denoted as bandwidth class. To obtain the traffic characteristics of the UMTS traffic model, we employ the scaling algorithm introduced in [19] (see Figure 8). This scaling procedure utilizes the notion of (1) bandwidth-independent characteristic distributions for the statistical measures on the three traffic levels, and (2) bandwidth-dependent trends in the mean and the variance of each unique statistical measure. In the first step the identification of bandwidthdependent trends for each statistical measure utilizing a regression method is conducted. The basic idea of the underlying regression models constitutes of the notion of bandwidthdependent trends and the evolution of mean and/or variance, i.e., bandwidth-dependent changes that are naturally described by one of the functions (a) to (d). We consider this set of functions because they comprise of different asymptotic behavior, e.g., a linear or a logarithmic asymptotic behavior. Subsequently, we utilize the parameterized function, which comprises of the least squares residual value, in order to get the mean and the variance values corresponding to the UMTS bandwidth classes 64 kbps, 144 kbps, and 384 kbps. For each statistical measure, we utilize its characteristic distribution and the derived values for mean and variance, in order to get the parameter values of the characteristic distribution (see Step 3 in Figure 8). The following presents characteristic distributions and the corresponding parameter values for the statistical measures of the session-level, connection-level, and packet-level. The reason for restricting the non real-time traffic model to the bandwidth classes 64 kbps, 144 kbps, and 384 kbps is two-fold. First, we think that after the commercial launching of UMTS most users will run applications on their hand-held devices using the cheaper and, thus, lower bandwidth classes. Second, the notion of trends in the statistical measures and the utilization of a scaling procedure by regression methods are based on measurements that comprises of bandwidth classes from 9.6 kbps up to 64 kbps. From this point of view, a trend spotting up to the maximum UMTS bandwidth class (i.e., 1,920 kbps) involves too many unknowns. The statistics at the session level are mainly influenced by user behavior, which is difficult to predict. As the session interarrival-time depends to a large extend on the prizing policy of the UMTS provider, we assume an exponential distribution with rate λ for session interarrival-times. Note, λ is determined by the call arrival rate (see Section 4). However, in order to take into account the bandwidth-dependent transfer data volumes, we get the characteristic distributions and corresponding parameter sets as shown in Table 3.
-17Distribution
64 kbps
144 kbps
384 kbps
Lognormal(P;V ) (5.1613;13.8210) (5.2943;14.1839) (5.4197;14.4979) �
Table 3. Distribution of session volume Distribution
64 kbps
Interarrival time Lognormal(P;V ) Data volume Lognormal(P;V�) Interarrival time Pareto(k;D) e-mail Data volume Lognormal(P;V�) Interarrival time Napster Data volume Lognormal(P;V�) Interarrival time FTP Data volume Lognormal(P;V�) �
HTTP
144 kbps
384 kbps
(-0.3278;4.4807) (-0.6907;4.8483) (-1.1997;5.3259) (2.8651;12.6098) (2.8072;13.0871) (2.7888;13.4888) (14.4360;2.1345) (15.1334;2.1254) (16.0229;2.1223) (3.2677;13.2369) (3.2799;13.5579) (3.3084;13.8518) not available (5.8875;14.3687) (5.9213;14.4278) (6.0113;14.5865) not available (3.3433;13.9698) (3.3020;14.7826) (3.3435;15.3229)
Table 4. Statistical properties at connection-level Distribution HTTP e-mail
64 kbps
144 kbps
384 kbps
Lognormal(P;V ) (-2.7597;3.5448) (-3.2588;3.8720) (-3.9599;4.3342) Lognormal(P;V�) (-3.3678;2.4220) (-3.7152;2.6410) (-4.1058;2.8902) �
Napster Lognormal(P;V�) (-3.1757;1.6076) (-3.2357;1.3796) (-3.2649;1.1853) FTP Lognormal(P;V�) (-3.0691;3.8055) (-3.2656;3.9347) (-3.4160;4.0337) UDP Lognormal(P;V�) (-2.9629;4.6606) (-3.3120;4.7290) (-3.6787;4.8532)
Table 5. Parameters of packet interarrival-times HTTP Napster e-mail FTP
Packet size 40 byte 46.77 % 34.98 % 38.25 % 40.43 %
Packet size 576 byte 27.96 % 45.54 % 25.98 % 18.08%
Packet size 1500 byte 8.10% 4.18 % 9.51 % 9.33 %
Other packet sizes 17.17 % 15.30 % 26.26 % 32.16 %
Table 6. Fractions of different packet sizes in overall traffic At connection level, the measured data indicates that almost all users, who utilize Napster or FTP applications, only run a single session. Therefore, an interarrival-time distribution for connections for those applications is misleading. Thus, we take into account the fractions for using Napster or FTP measured at the ISP. Furthermore, we assume that users run these applications in a single connection. These fractions are derived from measured data of ISDN users, i.e., 1.47% for Napster and 3.05% for FTP. We focus on this bandwidth class because users of lower bandwidth classes hardly utilize these applications. For the remaining applications, the interarrival-time distributions for connections and the data volume distributions per connection are presented in Table 4. Recall that UDP applications are connection-less. Thus, UDP applications are omitted in the statistics for the connection level. UDP applications are assumed to be active during the entire user session and are fully described by its packet interarrival-time distribution. Table 5 presents the application dependent packet interarrival-time distributions. Note that the packet size distributions for HTTP, Napster, e-mail, and FTP follow to a large extend a
-18discrete distribution, i.e., packets of the sizes 40 bytes, 576 bytes, and 1500 bytes constitute the largest amount of the overall packet sizes. This phenomenon relies on the maximum transfer units (MTU) of Ethernet and SLIP (serial line IP) networks. Most TCP transfer protocols like HTTP, FTP, and POP3 are used to transfer files as fast as possible. Therefore, within a connection the packets are filled up to the MTU of the underlying network protocol. This is usually 1500 bytes in Ethernet networks and 576 bytes in SLIP networks. Packets with a length of 40 bytes are at most TCP acknowledgments with missing data field. Recall, that the TCP/IP header without any options consists of 40 bytes. Table 6 displays the fractions of these discrete packet sizes. We observe further, that the remaining packet sizes are distributed uniformly between 40 bytes and 1500 bytes. In contrast to the TCP packets, the UDP datagram sizes follow a bandwidth-independent lognormal distribution with parameters µ=1.8821 and σ2=5.4139.
4
Performance Improvement due to the Adaptive Control Framework
4.1 The Simulation Environment The simulator considers a cell cluster comprising of seven hexagonal cells. We assume that a mobile user requests a new session in a cell according to a Poisson process with call arrival rate λ. When a mobile user starts a new session, the session is classified as voice-, real-time, or non real-time session, i.e., with the session the user utilizes voice-, real-time, or non realtime services mutually exclusive. Recall that voice calls are assumed to be circuit-switched connections that require a constant amount of radio channels (i.e., a constant amount of bandwidth corresponding to 16kbps uncoded). Real-time sessions consist of streaming downlink traffic corresponding to the UMTS streaming class specified by 3GPP [2] and non real-time sessions consist of elastic traffic and correspond to the UMTS interactive class or background class, respectively. Moreover, we assume that 25% of the sessions are voice calls whereas real-time and non real-time services constitute 15% and 60% of the overall sessions (see Table 7). The frequency spectrum covered by traditional GSM services (i.e., 890-915 MHz and 935-960 MHz) can be also utilized by voice calls but is not considered in our study. Subsequently, we have to specify the QoS profile for real-time and non real-time sessions. For real-time sessions we define two QoS profiles, i.e., a low bandwidth profile comprising of a guaranteed bitrate of 64 kbps corresponding to streaming audio and a high bandwidth profile comprising of a guaranteed bitrate of 192 kbps corresponding to streaming video. According to the real-time traffic model presented in Section 3, we assume that 80% of the real-time sessions utilize the low bandwidth profile whereas the remaining 20% utilize the high bandwidth profile. Following the single user traffic model presented in Section 3, non
-19Circuit switched voice service Portion of arriving requests Session duration Session dwell time
25%
Streaming real time (RT) Audio Video
12%
3%
Interactive non real time (NRT) high priority normal priority low priority
6%
18%
36%
120 sec
180 sec
determined by session volume distribution
60 sec
120 sec
120 sec
Table 7. Characteristics for different UMTS session types real-time sessions are partitioned according to different bandwidth classes as follows: 60% for 64 kbps, 30% for 144 kbps, and 10% for 384 kbps, comprising of different priorities (see Table 7), respectively. Before a mobile user can start a new session, he/she has to pass the admission controller introduced in Section 2.2. The amount of time that a mobile user with an ongoing session remains within the cell is called dwell time. If the session is still active after the dwell time, a handover toward an adjacent cell takes place. We assume the duration of voice calls and realtime sessions to be exponentially distributed. The dwell time can be better modeled by a lognormal distribution as shown in [6]. Parameters of the distribution are given by µ = 1.7770 and σ2 = 4.6347 for voice calls and µ = 2.1260 and σ2 = 5.3230 for real-time and non realtime sessions, respectively. All corresponding mean values are shown in Table 7. As described in Section 3, a non real-time session remains active until a specific data volume drawn according to a bandwidth-dependent lognormal distribution (see Table 3) is transferred, assuming it completes without being forced to terminate due to handover failure. Thus, in the simulation environment, a session of a mobile user is completely specified by the following parameters: service class (e.g., voice, RT, NRT), packet arrival process, dwell time, session duration (defined by the amount of time or data), and QoS profile. For voice calls, the QoS profile is empty, since a fixed portion of bandwidth is reserved for a voice call during its dwell time in the cell. The QoS profile for real-time sessions consists of a guaranteed bitrate as specified in Section 2.2. To distinguish between NRT traffic, the UMTS simulator implements three packet priorities: high, normal, and low. These priorities correspond to the traffic handling priority specified by 3GPP. To model the user behavior in the cell, the simulator considers the handover flow of active mobile users from adjacent cells. It is impossible to specify in advance the intensity of the incoming handover flow. This is due to the fact that the handover rate out of the cell depends on the number of active customers within the cell. On the other hand, the handover rate into the cell depends on the number of customers in the neighboring cells. Thus, the iterative procedure introduced in [4] is employed for balancing the incoming and outgoing handover ) of rates. The iteration is based on the assumption that the incoming handover rate λ(hn,+1 i
-20application i at step n+1 is equal to the corresponding outgoing handover rate computed at step n. The simulator exactly mimics UMTS system behavior on the IP level. The focus is not on studying link level dynamics. Therefore, we assume a reliable link layer as provided by the automatic repeat request (ARQ) mechanism of the Radio Link Control (RLC) protocol. As shown in [23] for the General Packet Radio Service (GPRS), the ARQ mechanism is fast enough to recover from packet losses before reliable protocols on higher layers, e.g., TCP recognize these losses due to timer expiration. Therefore, a reliable link level can be assumed when considering higher layer protocol actions. To accurately model the UMTS radio access network, the simulator represents the functionality of one radio network controller and seven omni-directional Node B transceiver stations, one for each of the considered cells. Since in the end-to-end path, the wireless link is typically the bottleneck, and given the anticipated traffic asymmetry, the simulator focuses on resource contention in the downlink (i.e., the path RNC → Node B → MS) of the radio interface. The amount of uplink traffic e.g., due to acknowledgments is assumed to be negligible. The simulation study focuses on the performance management for the radio interface of UMTS. Management functions for the UMTS core network are not considered. The simulator considers the UTRAN access scheme based on Wideband-Code Division Multiple Access (W-CDMA) in Frequency Division Duplex mode (FDD) proposed by 3GPP [1]. In FDD downlink, a division of the radio frequencies into 4 physical code channels with data rates of 1,920 kbps each up to 512 physical code channels with 15 kbps data rates each is possible. Therefore, the overall bandwidth B that is available in one cell is 7,680 kbps. We assume this bandwidth to be constant over time. Considering an overall bandwidth B(t) depending on the actual interference situation is beyond the scope of this paper and is subject for further research. For the channel coding, we assume a convolution-coding scheme with coding factor 2. Table 8 summarizes the base parameter settings of the network model underlying the performance experiments. Parameters are divided in fixed parameters and parameters that can be adjusted through the performance management information base. The simulations environment was implemented using the simulation library CSIM [11]. In a pre-simulation
adaptive
fixed
Parameter
Base Value
Available bandwidth in one cell, B RTQ buffer size, KRT
1000 IP packets
NRTQ buffer size, KNRT
1000 IP packets
Bandwidth partitioning: bh, bv, bp, FCFS Bandwidth for NRT packets, bn NRTQ threshold, η Weights for packet priorities high, normal, low
7680 kbps
5%, 10%, 20%, 65% 10% 90% 4/7, 2/7, 1/7
Table 8. Base parameter setting of the simulator
-21run, for each cell at the boundary of the seven cell cluster the incoming handover flow of mobile users are derived iteratively from outgoing handover flows. All simulation results are derived with confidence level of 95% using the batch means method. The execution of a single simulation run requires about 30 to 50 minutes of CPU time (depending on the choice of the call arrival rate) on a dual processor Sun Enterprise with one GByte main memory.
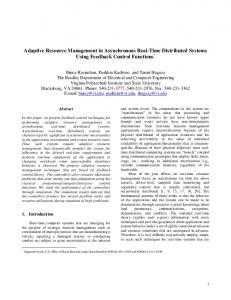
4.2 Performance Results Using simulation experiments, we illustrate the benefit of the proposed adaptive framework for performance management of UMTS systems introduced in Section 2. The curves presented plot the mean values of the confidence intervals for the considered QoS measures. In Figures 9 to 14, the arrival rate λ of new mobile users is varied to study the cell under increasing load conditions.
1e+00
1e+00
1e-01
1e-01
New Call Blocking Probability
Handover Failure Probability
In a first experiment, we study the effect of the adaptive performance management in a rush hour scenario. That is, the flow of mobile users into the innermost cell is greater/smaller than out of this cell. Therefore, we balance the handover flow with a factor α. That is, the handover flow into the cell is α times the handover flow out of the cell for each service class. The left part of Figure 9 plots the voice and real-time handover failure probability with and
1e-02
1e-03
α a == 0.5 0.5 a == 1.0 α 1.0 a == 1.5 α 1.5 MIB
1e-04
1e-05
1e-02
1e-03
α a = 0.5 a = 1.0 α a = 1.5 α
1e-04
a == 0.5 α 0.5, MIB a == 1.0 α 1.0, MIB a == 1.5 α 1.5, MIB
1e-05 0.0
0.2
0.4
0.6
0.8
1.0 1.2 1.4 1.6 Call Arrival Rate
1.8
2.0
2.2
2.4
0.0
0.2
0.4
0.6
0.8
1.0 1.2 1.4 1.6 Call Arrival Rate
1.8
2.0
2.2
2.4
Figure 9. Effect of adaptive performance management in a rush hour scenario 100
α = 0.5 α = 1.0 α = 1.5
90 80
Non Real-Time Queue Threshold [%]
Bandwidth Portion for Handover [%]
100
70 60 50 40 30 20 10 0
90 80 70 60 50 40
bβν n = = 0% 0% bn == 10% βν 10% bn == 30% βν 30%
30 20 10 0
0.0
0.2
0.4
0.6
0.8
1.0 1.2 1.4 1.6 Call Arrival Rate
1.8
2.0
2.2
Figure 10. Adaptive adjustment of handover bandwidth
2.4
0.0
0.2
0.4
0.6
0.8
1.0 1.2 1.4 1.6 Call Arrival Rate
1.8
2.0
2.2
Figure 11. Adaptive adjustment of non real-time queue threshold
2.4
-22without adaptive performance management for α = 0.5, 1.0, and 1.5. Curves with adaptive performance management are denoted with MIB. Note that the handover failure probability with adaptive performance management is (nearly) independent of the value α. This is due to the fact that the handover bandwidth bh is updated according to the online measured handover failure probability which immediately depends on α. As a consequence, different values of α result in different values of bh with the effect of (nearly) the same resulting handover failure probability for each α. Therefore, Figure 9 contains only one curve for adaptive control. The adjusted values of bh are presented in Figure 10. The solid line corresponds to the case without adaptive control of the handover bandwidth, i.e., bh equals to 5% for all arrival rates. As can be seen from Figure 10 the handover bandwidth is adjusted to values below 5% for low arrival rates. Therefore, the handover failure probability is increased compared to the case without adaptive control (see Figure 9 left side). Studying the blocking probability of new voice calls and real-time sessions (see Figure 9 right side) we surly find a higher blocking probability of new calls in the case with adaptive control and high arrival rate. From these curves we conclude that the adaptive control of bh is very successful since the handover failure probability can be kept below 10-2 for a width spectrum of call arrival rates. In a next experiment, we investigate the effect of adaptive control of the non real-time queue threshold η. Figure 12 shows the NRT packet loss probability (left side) and the average number of NRT users in the cell (right side) for the UMTS system with and without adaptive control. Furthermore, the figures distinguish between different bandwidth portions bn reserved for NRT traffic as introduced in Section 2.2. We observe that the adaptive performance management achieves a significant improvement for the packet loss probability. In fact, the packet loss probability is independent of the bandwidth portion bn. Therefore, only one curve is depicted in the figure. The adjusted values of η are presented in Figure 11. The solid line corresponds to the case without adaptive control of the NRT queue threshold, i.e., η equals to 90% for all arrival rates. As can be seen from Figure 11 the NRT queue threshold is adjusted to values above 90% for arrival rates below 0.7 arrivals per second. Therefore, the packet loss probability is increased compared to the case without adaptive control (see Figure 12 left side). 1e+00
Average Number of NRT Users
NRT Packet Loss Probability
50 1e-01
1e-02
1e-03
bn bn = 0% bn = 10% bn bn = 30% bn MIB MIB
1e-04
1e-05
40
30
20
bn == 0% bn 0% bn == 0%, bn 0%, MIB MIB
10
bn = 10% bn bn = bn = 10%, 10%, MIB MIB
bbnn == 30% 30% bbnn == 30%, 30%, MIB MIB
0 0.0
0.2
0.4
0.6
0.8
1.0 1.2 1.4 1.6 Call Arrival Rate
1.8
2.0
2.2
2.4
0.0
0.2
0.4
0.6
0.8
1.0 1.2 1.4 1.6 Call Arrival Rate
1.8
2.0
2.2
Figure 12. Effect of adaptive performance management on non real-time traffic
2.4
-23-
1e+00
priority low priority high priority low, MIB priority high, MIB
1400 1200
Probability of Real-time Session Degration
Average Carried NRT Traffic [kbps]
1600
1000 800 600 400 200 0 0.0
0.2
0.4
0.6
0.8
1.0 1.2 1.4 1.6 Call Arrival Rate
1.8
2.0
2.2
2.4
bbv = 5% 5% v = bbv v = = 10% 10% bbv v = = 20% 20%
1e-01
1e-02
1e-03
1e-04
1e-05 0.0
0.2
0.4
0.6
0.8
1.0 1.2 1.4 1.6 Call Arrival Rate
1.8
2.0
2.2
2.4
Figure 13. Effect of adaptive performance Figure 14. Probability of real-time sessions management on queuing behavior degradation for different values of bv Figure 12 (right side) shows the average number of non real-time users admitted in the cell. For all curves, the number of real time users in the cell first increases up to 53 users for an arrival rate of 0.6 arrivals per second and then it decreases depending on the choice of bn and whether the P-MIB is active or not. This is due to the fact that for low arrival rates the bandwidth capacity that is assigned to NRT users is more than the guaranteed portion bn. Thus, packets in the NRT queue will be served faster and more NRT users can be admitted in the cell. Comparing the curves with and without adaptive control we surly find that the number of NRT users is smaller in the case of adaptive control because the threshold parameter η is decreased in order to admit less non real-time users in the cell. From these curves we again conclude that our approach successfully controls the packet loss probability of NRT traffic. In fact, the packet loss probability can be kept below 0.05 even for a highly loaded system independent of the NRT bandwidth guarantee. Next, we study the impact on performance of non real-time users by the adaptive control of the queueing weights. Figure 13 plots the average carried traffic measured in kbps for each priority class of non real-time traffic. As shown in Table 7, we assume 10% NRT users with high priority, 30% with normal priority, and 60% with low priority. Recall that higher priority service is more expensive and, hence, more users choose low priority service. If the overall load in the cell is low (i.e., less than 0.5 call arrivals per second) NRT users with low priority utilize the greatest portion of the NRT bandwidth because most NRT users have priority low. However, when the cell gets heavily loaded (arrival rate of more than 1.5 arrivals per second), bandwidth for low and normal priority packets will be more utilized by high priority users. The intention of adaptively controlling the queueing weights is to reduce heavy bandwidth degradation of low priority users in this case. The performance increase of low priority users and the decrease of high priority users is shown in Figure 13. In a further experiment, we study the effect of QoS provisioning for real-time sessions, i.e., the probability of violating the QoS guarantees of corresponding QoS profiles. Figure 14 plots curves for the probability of real-time session degradation below the guaranteed bitrate.
-24Recall that the degradation of real-time sessions steams from the introduction of the voice priority preempt packets bandwidth bv. That is, a newly arriving voice call will be admitted if less than the bandwidth portion bv is allocated to voice calls even than if bandwidth guarantees for real-time sessions will not be fulfilled anymore. Therefore, we studied the probability of real-time session degradation for different values of bv. Note that for bv = 0% the probability of real-time sessions degradation equals zero. As explained in Section 2.3 degradation of real-time sessions is performed stepwise. The probabilities shown in Figure 14 correspond to the first degradation step to 32 kbps assuming that the real-time session continues in lower quality (e.g., only the audio component of a video real-time session is transmitted). The probability of degrading a real-time session more than one step was in all experiments less than 10-5. An interesting effect than can be observed from the curves of Figure 14 is that for increasing traffic load the probability of real-time session degradation first increases and then decreases. The decrease for high traffic load is due to the fact that real-time sessions get no chance to be accommodated in the voice priory preempt packets area because at all time there are sufficient voice calls in the cell. From Figure 14 we conclude that average bandwidth requirements can almost always be maintained. In fact, the degradation of real-time sessions below their guaranteed bandwidth requirements takes place only in 1 out of 1,000 sessions for bv = 10%.
Conclusions We introduced a performance management information base (P-MIB) for dynamically adjusting the packet scheduler and admission controller of the UMTS air interface. The aim of this adaptive control framework lies in improving bandwidth utilization of the UMTS radio channels. The proposed framework distinguishes three different types of services: circuitswitched services as well as packet-switched real-time services and non real-time services. The P-MIB adaptively adjusts the system parameters of the admission controller at a base station responsible for a cluster of cells. Controlled system parameters constitute the portion of bandwidth reserved for handovers, the buffer threshold of the non real-time queue, and the queueing weights for scheduling non real-time packets by the packet scheduler. Using the UMTS traffic model of [19] and a simulator on the IP level for the UMTS system, we presented performance curves for various QoS measures to illustrate the benefit of the performance management information base. Considering a rush hour scenario, we showed that the adaptive performance management makes the handover failure probability insensitive against changes in the ratio between incoming and outgoing handover flows. Furthermore, we observed that the adaptive performance management achieves a significant improvement for the packet loss probability independent of bandwidth guarantees for non real-time users.
-25Throughout the paper, we considered the services and QoS profiles standardized for UMTS. Thus, the proposed adaptive control framework is tailored to UMTS networks. However, by considering other services and QoS profiles, the basic ideas underlying the control framework can also be applied for the adaptive control of wire-line multi-service IP networks (e.g., in terms of a bandwidth broker [18] that performs intra-domain resources allocation through admission control).
References [1]
3GPP, http://www.3gpp.org.
[2]
3GPP, QoS Concept and Architecture, Technical Specification TS 23.107, 2001.
[3]
3GPP, UTRAN Overall description, Technical Specification TS 25.401, 2001.
[4]
M. Ajmone Marsan, S. Marano, C. Mastroianni, and M. Meo, Performance Analysis of Cellular Mobile Communication Networks Supporting Multimedia Services, Mobile Networks and Applications (MONET) 5, 167-177, 2000.
[5]
E. Anderlind and J. Zander, A Traffic Model for Non Real-Time Data Users in a Wireless Radio Network, IEEE Communications Letters 1, 37-39, 1997.
[6]
F. Barceló, J. Jordán, Channel Holding Time Distribution in Public Cellular Telephony, Proc. 16th International Teletraffic Congress, Edinburgh, Scotland, 107-116, 1999.
[7]
J.C.R. Bennett and H. Zhang, WF2Q: Worst-case Fair Weighted Fair Queueing, 15th Conf. on Computer Communications (IEEE Infocom), San Francisco, CA, 120-128, 1996.
[8]
V. Bharghavan, S. Lu, and T. Nandagopal, Fair Queuing in Wireless Networks: Issues and Approaches, IEEE Personal Communications 6, 44-53, 1999.
[9]
C. Coutras, S. Gupta, and N.B. Shroff, Scheduling of real-time traffic in IEEE 802.11 wireless LANs, Wireless Networks 6, 457-466, 2000.
[10] M. Crovella, C. Lindemann, and M. Reiser, Internet Performance Modeling: The State of the Art at the Turn of the Century, Performance Evaluation 42, 91-108, 2000. [11] CSIM18-The Simulation Engine, http://www.mesquite.com. [12] S.K. Das, R. Jayaram, N.K. Kakani, and S.K. Sen, A Call Admission and Control Scheme for Quality-of-Service Provisioning in Next Generation Wireless Networks, Wireless Networks 6, 17-30, 2000. [13] A. Demers, S. Keshav, and S. Shenker, Analysis and Simulation of a Fair Queueing Algorithm, Proc. ACM Conf. on Applications, Technologies, Architectures, and Protocols for Computer Communication (SIGCOMM), Austin TX, 1-12, 1989. [14] M. Elaoud and P. Ramanathan, Adaptive Allocation of CDMA Resources for Networklevel QoS Assurances, Proc. 6th Int. Conf. on Mobile Computing and Networking (MobiCom), Boston, MA, 191-199, 2000.
-26[15] ETSI, Universal Mobile Telecommunication System (UMTS); Selection Procedures for the Choice of Radio Transmission Technologies of the UMTS, Technical Report TR 101 112 v3.2.0, 1998. [16] J.F. Huber, D. Weiler, and H. Brand, UMTS, the Mobile Multimedia Vision for IMT2000: A Focus on Standardization, IEEE Comm. Magazine 38, 129-136, 2000. [17] Y. Ishikawa and N. Umeda, Capacity Design and Performance of Call Admission Control in Cellular CDMA Systems, IEEE Journal on Select. Areas in Comm. 15, 16271635, 1997. [18] V. Jacobson, K. Nichols, and L. Zhang, A two-bit differentiated service architecture for the internet, Request for Comments 2638, Internet Engineering Task Force, 1999. [19] A. Klemm, C. Lindemann, and M. Lohmann, Traffic Modeling and Characterization for UMTS Networks, Proc. IEEE Globecom 2001, San Antonio Texas, November 2001, (to appear). [20] J. Kilpi and I. Norros, Call Level Traffic Analysis of a Large ISP, Proc. 13th ITC Specialist Seminar on Measurement and Modeling of IP Traffic, Monterey, CA, 6.1-6.9, 2000. [21] M. Krunz and A. Makowski, A Source Model for VBR Video Traffic Based on M/G/∞ Input Processes, Proc. 17th Conf. on Computer Communications (IEEE Infocom), San Francisco, California, 1441-1449, 1998. [22] T. Liu and J. Silvester, Joint Admission/Congestion Control for Wireless CDMA Systems Supporting Integrated Services, IEEE Journal on Select. Areas in Comm. 16, 845-857, 1998. [23] M. Meyer, TCP Performance over GPRS, Proc. 1st Wireless Communications and Networking Conference (IEEE WCNC), New Orleans, 1248-1252, 1999. [24] M. Schwartz, Network Management and Control Issues in Multimedia Wireless Networks, IEEE Personal Communications 2, 8-16, 1995. [25] UMTS-Forum, UMTS/IMT-2000 Spectrum, Report No. 6, 1999. [26] G. Záruba, I. Chlamtac, and S.K. Das, An Integrated Admission-Degradation Framework for Optimizing Real-Time Call Mix in Wireless Cellular Networks, Proc. 3rd Int. Workshop on Modeling, Analysis and Simulation of Wireless and Mobile Systems (ACM MSWiM), Boston, Massachusetts, 20-26, 2000. [27] H. Zhang, Service Disciplines for Guaranteed Performance Service in Packet-switched Networks, Proc. of the IEEE 83, 1374-1396, 1995.