Computers extend the scope of a sequential decision making paradigm by enhancing ..... of the task. First, a list of all of the subjects' preferred values was shown ...
Behavior Research Methods, Instruments, & Computers 1987, 19 (2), 237-242
Adaptive rating scales in sequential decisions BRUCE G. BERG and N. JOHN CASTELLAN, JR. Indiana University, Bloomington, Indiana The benefits gained in decision research through the use of computer-controlled procedures, as opposed to the use of traditional pencil-and-paper techniques, can exceed the expected gains of efficiency and standardization. Computers extend the scope of a sequential decision making paradigm by enhancing (1)the strength of experimental design, (2) reliability of measurement, (3)procedural flexibility, and (4) single-subject data analysis. Data are reported that indicate the necessity of using computers to obtain reliable measurements and valid results for this type of decision research.
Decision making research, like experimental research in general, benefits in a number of ways from computercontrolled procedures. Efficient collection, storage, and analysis of data; standardized presentation of stimuli; and self-paced sessions for individual subjects are but a few benefits. However, many of these benefits are simply labor-saving devices. They fail to extend the scope of computer-eontrolled procedures beyond paradigms similarly accomplished with pencil-and-paper procedures. Consider several innovations in decision research that more fully exploit computer-controlled procedures. MacCrimmon and Sui (1974) developed an interactive program to assess directly an individual's indifference curvefor utility tradeoffs between attributes. Theyreport that subjects' actual choices were more consistent with indifference curves generated by the computer-assisted technique thanwiththose produced by traditional indirect methods of assessment. Process tracing techniques developed by Payne (1976), and related developments by Klayman (1983), are easily adapted to computercontrolled procedures. Interactive programs using procedural branching that is contingent on subjects' responses cangreatly increase our understanding of predecision search behavior. Russo andRosen (1975) developed a sophisticated methodology to study patterns of information search in multiattribute decision tasks. Informationwaspresented ona monitor, andeyemovements were tracked andrecorded as thesubjects examined thedisplay. These studies illustrate howthe utilization of computercontrolled procedures canenhance decision research. This paperextends thesedevelopments witha detailed discussion of one paradigm. We show here how a computercontrolled procedure can increase the strength of ex-
perimental design and precision of measurement beyond levels attainable with pencil-and-paper procedures. A sequential decision taskwasusedto testthe assumptions of several decision models developed within the framework of multiattribute utility theory (Adams & Fagot, 1959; Fischer, 1977; Keeny & Raiffa, 1976). To allow a focus on methodological issues in thispaper, discussion of theoretical details has beenomitted. However, in orderto provide an appropriate context, a briefdescription of the theory is included, followed by a description and rationale of a sequential decision task. Next, several improvements in experimental design resulting from a computer-eontrolled procedure are discussed. Thisis followedby a discussion of procedural and methodological issues, including several difficulties encountered by subjects in performing such tasks. Next, data are reported that illustrate the necessity of usingcomputer-eontrolled procedures for this type of paradigm if we are to understand the decision making process. Finally, generalizations to other experimental paradigms are made.
DESCRIPTION OF THE PROBLEM
A basicpremise of multiattribute utility theory is that a decomposition strategy is used by subjects in complex decision tasks. Consider the following descriptive model of a cognitive process for choosing between several alternatives (i.e., choosing an apartment to rent). First,each alternative is "decomposed" into a set of defining featuresor attributes (i.e., cost, location, available utilities, etc.). Next, two quantitative or qualitative measures are assessed for eachattribute: the value of the attribute and a weighting factor reflecting its relative importance in relation to other attributes. Then these measures are integrated to obtain a measure of worthor utilityfor a parThe authors are indebted to Terri Sawyerfor her supportand assistance ticular alternative. Finally, the alternative yielding the in softwaredevelopment. We also wish to thank Laura Thomas for her highest utility is selected. assistance in collecting data from our subjects. Requests for reprints A common method of investigating these presumed deshould be sent to N. John Castellan, Departmentof Psychology, Indiana University, Bloomington, IN 47405. cision processes consists of presenting the subject with
237
Copyright 1987 Psychonomic Society, Inc.
238
BERG AND CASTELLAN
a set of attributes describing an alternative and obtaining a single response as a measure of that alternative's utility. This technique has had some degree of success, particularly when the set of attributes is relatively small (Anderson, 1979; Fischer, 1977). However, it is questionable whether a single terminal decision can be used to model decision processes when we use increasingly complex tasks involving greater numbers of attributes. Instead of relying on a single response, several investigators have used on-line techniques in which the state of the decision is probed or traced at several stages during the decision process (Payne, 1976; Payne, Braunstein, & Carroll, 1978). Following these developments, we have developed a sequential decision technique to investigate decision processes at times prior to the fmal decision.
SEQUENTIAL DECISIONS In a sequential decision task, information about an alternative is presented one aspect or item at a time, and the decision maker is allowed to modify his or her judgment about the alternative following each item of information. A subject's modifications are assumed to reflect changes in the decision state produced by the new information. Assessing the impact of new information allows one to compare different models of information integration. Specifically, an additive model assumes that the contribution from a single item or source of information is independent of other information, whereas a nonlinear model assumes nonindependence between items. Borcherding (1982) obtained equivocal results using a sequential task to determine whether a multiplicative or additive model could best account for the data. However, several aspects of her design may have precluded a defmitive assessment of the models. First, presentation sequences of specific attributes were determined probabilistically. Second, the ranked order of importance for attributes and preferences for specific levels were defined by consensus. Individual differences were not considered. There are several ways that these problems can be overcome and the general paradigm improved. Stricter experimental control can be gained by using predetermined rather than probabilistic sequences of attributes, allowing one to structure the order of presentation in order to provide stronger tests of specific assumptions. Furthermore, the use of a subject's own unique set of weights and preferences can be used to construct a presentation sequence "tailored" to the individual subject. These modifications of the paradigm would be extremely difficult to implement using pencil-and-paper procedures. Traditional techniques lack the procedural flexibility to accommodate individual differences in a controlled and welldefmed manner. In contrast, as discussed in greater detail below, a computer-controlled procedure allows the experimenter to exploit individual differences to gain more precise experimental control. Combining computer procedures with a sequential decision task leads to a process
tracing technique that yields information at the level of the individual subject, a primary goal of these techniques. In our experiment, subjects sequentially rated the attractiveness of hypothetical apartments. The task consisted of three stages. During Stage 1, subjects' preferences (values) and ratings of importance (weights) for a set of attributes were obtained. During Stage 2, subjects reviewed their stated preferences and importance ratings and were allowed to revise any of their prior decisions. During Stage 3, subjects used an adaptive rating scale to rate the attractiveness of hypothetical apartments. Statements describing the attributes of an apartment were presented one at a time, and subjects could increase, decrease, or leave unchanged their rating following each presentation. A subject's successive ratings for an apartment defmed his or her decision path.
EXPERIMENTAL DESIGN One advantage of a computer-controlled procedure is the strength of design gained by tailoring the presentation order of attributes as a function of a subject's own unique set of weights and preferences. For example, consider two different fixed sequences of attributes, each describing an apartment. For one sequence, a subject first receives his or her 3rd, 1st, and 5th most important attributes, in that order. For the other apartment, the initial sequence consists of the subject's 9th, 7th, and 11th most important attributes, in that order. Because each sequence is based on individual choices, the specific attributes and their order vary across subjects. A subject's rating following the third attribute establishes a high and low anchor point for the first and second sequences, respectively. An attribute ranked 4th in importance is presented as a target on the fourth trial of both sequences. By analyzing the magnitude of the rating change following presentation of the target, one can assess the impact of the information afforded by the target for the two cases, one when relatively important information is available, and the second when relatively unimportant information is available. This simple design can easily be extended. Consider two additional sequences with the same initial three attribute orders as described above. The attribute ranked 4th in importance is the target for all four sequences. However, a preferred value of the target is presented for the first two sequences, and a nonpreferred value of the target is presented for the two additional sequences. This yields a factorial design: high versus low anchor points followed by negative versus positive information. Given that subjects' ratings for an apartment increase and decrease following the presentation of a preferred and nonpreferred attribute, respectively, a factorial analysis of the rating changes can be used to test the predictions of several information integration models. (See Berg, 1986, for a complete discussion of the experimental design and results.)
SEQUENTIAL DECISIONS It is obvious that individual differences in preference weights (i.e., the combined value and weight of an attribute) would make implementation of thisdesign exceedingly difficult using a pencil-and-paper procedure. In contrast, this designcan be accomplished with relative ease using a computer-eontrolled procedure. First, a subject's preference weights are obtained. Subsequently, specific attributes for individual subjects are mapped onto a predetermined presentation sequence. The structureof a sequence is defined according to ranked preference weights and remains fixed across subjects, whereas the specific content varies across subjects to accommodate individual differences in preferences and their weights. For example, if a sequence required thatthefourth presentation consist of a nonpreferred value of an attribute ranked3rd in importance, this requirement couldbe met for all subjects, even though specific attributes differed across subjects. An important caveat is that the validity of the experimental design is dependent on an accurate assessment of subjects' preference weights. Moreover, oncesubjects make initial determinations, how stable are they?
EXPERIMENTAL PROCEDURE Subjects were run individually using Apple microcomputers, andall instructions, response collection, andstimulus presentations were computer controlled. Self-paced sessions lastedapproximately 30 min, during which preference weights for eight attributes and sequential decision paths for 12 apartments were obtained. Rating linespresented on the monitor wereusedto collect ratings of importance for the attributes and ratings of attractiveness for the apartments. A horizontal rating line consisted of 100 equally spaced intervals, with every 10thintervaldesignated by a hash mark and labeled witha singledigit. A verticalmarkercouldbe movedby usingthe right and left arrow keys, witha single depression of either key moving the marker one unit. An integer between 0 and 100was displayed to the rightof the rating line, so that subjects knew the precise location of the marker. Both the marker and the position indicator werepresent continuously during a trial. A carriage return ended a trial, and the subject's response was recorded. Obtaining ratings with an interactively controlled ratinglinehaveseveral advantages over conventional penciland-paper techniques. First, responses are recorded efficiently, withno ambiguity of markerplacement for either the experimenter or subject. Measurement is preciseand reliable. Second, subjects canmake unlimited adjustments in the rating before terminating a trial. Third, adaptive characteristics of the rating line are essential to the sequential judgments of apartments made during the third stage. The marker is continuously presentduringthe sequential task and remains at the point of the last rating between trials, thusavoiding the problem of subjects forgettingthe currentrating. Whennewinformation is presented, the subject adjusts the location of the marker to
239
indicate changes in his/her rating. Achieving these seeminglysimple and basicgoalsusingpencil-and-paper techniques is, at best, an exceedingly difficult andclumsy endeavor.
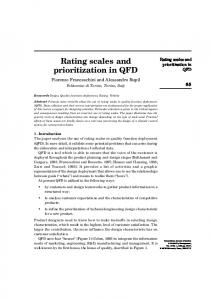
Stage 1: Initial Preferences and Importance Ratings Three descriptive statements were written for each attribute. One statement was neutralwith no qualitative or quantitative value (e.g., distance fromcampus, availability of air conditioning). Two statements were assigned a different quantitative or qualitative value (e.g., 5 min/30 min walkfromcampus; air conditioning/no air conditioning). To familiarize subjects withthe attributes, a list of the neutral attribute descriptions was presented prior to any data collection. To obtain a subject's preferred value for an attribute, the twovalued statements wererandomly assigned a label, A or B, andpresented simultaneously on the monitor. The subject indicated his/her preferred value by pressing the corresponding key, and the selected andunselected values were defined as positive and negative attribute values, respectively. An importance rating for theattribute wasobtained next. As shown in Figure 1, a neutral statement (e.g., availability of air conditioning) was presented below the rating line, withthe markerset at the midpoint of the line. Subjectswere instructed to decide howimportant or howmuch consideration would be given to the attribute when choosing an apartment to rent, and to move the marker to a point on the line corresponding to their judgment. The procedure was repeated until eachattribute wasevaluated. Stage 2: Reassessment of Preference Weights Thereare several justifications for allowing subjects to reassess their initialjudgments. First, a reliable assessmentof subjects' ranked orderings of the attributes is crucial to the validity of the experimental design. Errors in these obtained measures could result in the construction of a presentation sequence that was incongruous withthe intended properties of the designand maketesting of the models impossible. Second, in several pilot studies, apparent inconsistencies in the data were observed. Some subjects had a substantial numberof "reversals" in their decision paths (i.e., Stage 3 data). A reversal occurs when the direction of change in the rating for an apartment is opposite that expected by a subject's preferred valuefor the presented attribute. For example, a subject may state a preference for air conditioning, yet decrease the rating for an apartment when this value of the attribute is presented. It is difficult to assess whether reversals reflect the use of idiosyncratic adjustment strategies, or whether they result from unreliable measurement of subjects' preferences in the initial stage. To increase the reliability of measurement, subjects reassessed their previously stated preferences and importance ratings during the second stage of the task. First, a list of all of the subjects' preferred values was shown
240
BERG AND CASTELLAN
I
o
1
2
3
4
8
5
7
8
AVAILABILITY OF AIR C(JIlOITl(JllING
Figure 1. Representation of a trial for obtaining a rating of importance for an attribute.
1 -
WHETHER OR NOT UTILITIES ARE INCLUDED
90
2 -
AHOLNT OF TRAFFI C PAST APARTMENT
87
3 -
WHETHER OR NOT A LEASE IS REQUIRED
83
4 -
WALKING 01STANCE FROM CAMPUS
70
AVAILABILITY OF LAUNDRY FACILITIES
64
6 -
AVAILABILITY OF AIR C(JIlDITI(JIlING
4~
7 -
SIZE OF LIVING ROOM
40
8 -
SIZE OF THE BATHROOM
33
~
-
DO YOU WANT TO CHANGE ANY RATINGS?
Figure 2. Representation of a subject's importance ratings as listed during Stage 2.
on a single screen. Subjects were instructed to review their preferences and decide whether they wished to make any changes. A "yes" response was followed by a prompt asking which value was to be changed, and a preference choice trial, identical to that described above, was initiated for that attribute. After the trial, the revised list of preferred values was presented, and the procedure continued until the subject responded that no more changes were desired. Next, the neutral statements defining the attributes were presented on a single screen, as shown in Figure 2. The order of the list corresponded to the ranked ordering of the subject's previously obtained importance ratings; the attribute with the highest rating was presented first, and the attribute with the lowest rating was presented last. The subject's current rating was presented to the right of each attribute, and an integer indicating its ranked position was presented to the left. Subjects were asked whether any
changes were desired. Following a "yes" response, subjects indicated which attribute rating was to be changed by typing the integer corresponding to its ranked position, and a rating trial was initiated for that attribute. The trial was identical to that described above in Stage 1, with the exception that the pretrial location of the marker was the point corresponding to the subject's previous rating, rather than the midpoint of the rating line. Following the rating trial, any necessary reordering of the rankings was made, and the revised list of ranked attributes was presented. The procedure was repeated until the subject responded that no more changes were desired. To assess the effectiveness and the need for revisions, we monitored the frequency of revisions for preferences and importance ratings. These data were not central to the main objectives of the study, but were collected to gain insight to methodological issues outlined above and are the empirical focus of this paper.
SEQUENTIAL DECISIONS Stage 3: Sequential Ratings of Apartments Much of the procedure for Stage 3 has been described above. Sincethe primaryfocusof this paper concerns the first two stages, a reiterationof the sequential rating task is omitted.
RESULTS The Stage 2 revisions of all the subjects (N =68) were analyzed. Results showed that20% of the subjects revised their initialpreferences, 50% revised their initial importance ratings, and only 43 % of the subjects made no revisions. A more detailed descriptive analysis was done to determine the extent to which revisions of the importance ratings alteredthe initial rankedorderings of the attributes. Subjects made a total of 51 revisions, only 4 of which producedno changein ranked orderings. Revisions producingchanges in the rankedposition of an attribute were tabulated according to the ordinaldifferencebetweenthe attribute's initial and revised rank, and these results are shownin Figure 3. The highestproportion of revisedratings (37 %) changed the ranking of the reassessed attribute by a single ordinal position, 27% of the revisions led to a two-position change, and 31% resulted in a change of three or more positions. Revisions occurredthroughout the range of rankedpositions. That is, subjects changedthe highest rated attributes as well as the lowest rated attributes. The number of changes as a function of the initialranked order is summarized in Figure 4. With the exception of the greater tendency to revise the lower rankedattributes, the distribution of revisions is relatively uniform.
241
20
z
o ...... (f) ...... > w
15
.----
Ck::
u,
o
10
>-
u
-
.----
z
W
::::J
[3
5
Ck::
f----
c---
u,
o
I 2
3
q
5
6
7
INITIAL RANKED POSITION
6
Figure 4. Distribution of changes in rank as a function of initial ordinal position.
able and that revisions in initialjudgmentsare often substantialand nontrivial. Moreover, a computer-eontrolled procedurefor this type of task, whichgainsan advantage in terms of experimental design, becomesa necessity in terms of experimental control and reliability of measurement. The importance of obtaining reliable estimates of preference weights cannot be emphasized too strongly. Tests of theoretical assumptions are madeduringthe third stage of the task, but the validity of any conclusions are entirely dependent on the reliability of measurement in earlier stages. Inaccuracies lead to uncertainty about the correspondence between the actualand the intended structure of presentation sequences. The percentageof subjects (50%) that made revisions DISCUSSION in attributeratingsis large. However, Keeny(1977) also The results indicate that a single assessment of sub- found that a number of reassessments by the decision jects' preference weights may be inadequate and unreli- maker are required to obtain stable estimates of preference weights. Assessing the importance of an attribute relative to other attributes may be a difficult strategy dur20 ing the first pass when attributes are presented singly. Also, it is reasonable to assumethat presentingthe rated attributes on a single screen during the second stage 15 allowed subjects to more readily assess the relative importance of an attribute. Comparing Figures 1 and 2 il>u z lustrates the different information conveyed to subW ::::J 10 jects during the first and secondstages, respectively. ErC3 w rors resulting from a greater relianceon memory and unCk:: u, familiarity with the attributes during the initial stage couldreasonably accountfor a large proportion of the re5 visions. The frequency of revision of subjects' preferred level of each attribute is disturbingly large, since one would expect stablejudgmentsfor this binary measure. During o 1 2 3 q 5 debriefing sessions, severalsubjects commented that they CHANGE IN RANKED POSITION had mistakenly pressed the wrong key during the initial Figure 3. Distribution of changes in rank as a function of the ordinal difference between initial and final rank of a revised impor- assessment. Thus, at least some of the revisions can be tance rating. attributed to such corrections.
242
BERG AND CASTELLAN
In conclusion, we summarize several general aspects of our technique and the importance of extending computer-controlled procedures to other paradigms. First, the use of an adaptive, interactively controlled rating line is particularly important for sequential decision tasks. However, given the prevalent use of rating lines and scales in decision research, the technique offers several general advantages over traditional pencil-andpaper methodologies. These include: (1) no ambiguity of marker placement, (2) efficient data collection, (3) the ability to make within-trial adjustments, and (4) flexibility in anchoring the pretrial location of the marker. Second, we have demonstrated how the ability to accommodate individual differences allowed us to develop and to utilize an experimental design that would otherwise remain unattainable. An extension of this enhanced procedural flexibility to other paradigms would place researchers in the promising position of having fewer methodological constraints imposed on complex and innovative experimental designs. Third, sequential decision research, and process tracing techniques in general, explicitly recognize that decision making is a dynamic process, placing an emphasis on how a particular decision is reached rather than what the final decision is. As our theories become increasingly sophisticated, the demand for computer-eontrolled procedures will also increase.
REFERENCES ADAMS, E. W., & FAGOT, R. (1959). A model of riskless choice. Behavioral Science, 4, 1-10. ANDERSON, N. H. (1979). Algebraic rules in psychological measurement. American Scientist, 67, 467-471. BERG, B. G. (1986). Sequential decisions and multiattribute decision theory. Unpublished manuscript, Indiana University, Bloomington. BORCHERDING, K. (1982). Successive evaluation of multiattribute desion alternatives. Unpublished manuscript, Sonderforschungsbereich 24, Universitat Mannheim, 06800 Mannheim I, West Germany. FISCHER, G. W. (1977). Convergent validation of decomposed multiattribute utility assessmentfor risky and riskless decisions. Organizational Behavior & Human Performance, 18, 295-315. KEENY, R. L. (1977). The art of assessing multiattribute utility functions. Organizational Behavior & Human Performance, 19,267-310. KEENY, R. L., & RAIFFA, H. (1976). Decisions with multiple objectives: Preferences and value tradeoffs. New York: Wiley. KLAYMAN, J. (1983). Analysis of predecisional information search patterns. In. P. Humphreys, O. Svenson, & A. Vari, Analysingand aiding decision processes (pp. 402-414). Amsterdam: NorthHolland. MACCRIMMON, R. K., & SUI, J. K. (1974). Making tradeoffs. Decision Science, S, 680-704. PAYNE, J. W. (1976). Task complexity and contingent processing in decisionmaking: An informational searchand protocolanalysis. Organizational Behavior & Human Performance, 16, 366-387. PAYNE, J. W., BRAUNSTEIN, M. L., & CARROLL, J. S. (1978). Exploring predecisional behavior: An alternative approach to decision research. Organizational Behavior & Human Performance, 22, 17-44. Russo, J. E., & ROSEN, L.O. (1975). An eye fixation analysisof multialternative choice. Memory & Cognition, 3, 267-276.