56
IEEE JOURNAL OF SELECTED TOPICS IN SIGNAL PROCESSING, VOL. 1, NO. 1, JUNE 2007
Adaptive Waveform Design for Improved Detection of Low-RCS Targets in Heavy Sea Clutter Sandeep P. Sira, Douglas Cochran, Antonia Papandreou-Suppappola, Senior Member, IEEE, Darryl Morrell, William Moran, Member, IEEE, Stephen D. Howard, and Robert Calderbank, Fellow, IEEE
Abstract—The dynamic adaptation of waveforms for transmission by active radar has been facilitated by the availability of waveform-agile sensors. In this paper, we propose a method to employ waveform agility to improve the detection of low radar-cross section (RCS) targets on the ocean surface that present low signal-to-clutter ratios due to high sea states and low grazing angles. Employing the expectation-maximization algorithm to estimate the time-varying parameters for compound-Gaussian sea clutter, we develop a generalized likelihood ratio test (GLRT) detector and identify a range bin of interest. The clutter estimates are then used to dynamically design a phase-modulated waveform that minimizes the out-of-bin clutter contributions to this range bin. A simulation based on parameters derived from real sea clutter data demonstrates that our approach provides around 10 dB improvement in detection performance over a nonadaptive system. Index Terms—Detection, sea clutter, waveform design, waveform-agile sensing.
I. INTRODUCTION
T
HE detection of small targets on the ocean surface by active radar is particularly challenging due to the low signal-to-clutter ratio (SCR) that can result from low grazing angles and high sea states. Advances in radar technology that permit pulse-to-pulse waveform agility provide many opportunities for improved performance. For example, waveforms can be adapted to match the target characteristics and the environment or a desirable level of estimation accuracy of specific Manuscript received September 1, 2006; revised February 14, 2007. This work was supported in part by the U.S. Department of Defense under Multi University Research Initiative Grant AFOSR FA9550-05-1-0443 administered by the Air Force Office of Scientific Research; by DARPA, Waveforms for Active Sensing Program under NRL Grant N00173-06-1-G006; and the International Science Linkages established under the Australian Government’s innovation statement “Backing Australia’s Ability.” The associate editor coordinating the review of this manuscript and approving it for publication was Dr. Maria Sabrina Greco. S. P. Sira, D. Cochran, and A. Papandreou-Suppappola are with the Department of Electrical Engineering, Arizona State University, Tempe, AZ 85287 USA (e-mail:
[email protected];
[email protected];
[email protected]). D. Morrell is with the Department of Engineering, Arizona State University Polytechnic Campus, Mesa, AZ 85212 USA (e-mail:
[email protected]). W. Moran is with the Department of Electrical and Electronic Engineering, University of Melbourne, Melbourne, Australia (e-mail:
[email protected]. edu.au). S. D. Howard is with the Defence Science and Technology Organisation, Edinburgh, Australia (e-mail:
[email protected]). R. Calderbank is with the Department of Electrical Engineering, Princeton University, Princeton, NJ 08540 USA (e-mail:
[email protected]). Color versions of one or more of the figures in this paper are available online at http://ieeexplore.ieee.org. Digital Object Identifier 10.1109/JSTSP.2007.897048
target parameters. This paper proposes an approach to the suppression of sea clutter using waveforms that are designed on-the-fly to minimize the effect of clutter in areas of interest, thereby improving target detection performance. Recent work on dynamic waveform adaptation, to improve tracking performance, for example, has often assumed perfect detection [1], [2] or simplistic clutter models [3], [4]. While this may be appropriate when the signal-to-noise ratio is high, neither assumption is justified in scenarios that involve heavy sea clutter. Early investigations of detection in the presence of interference in space-time adaptive processing [5], and waveform design for clutter rejection [6], assumed that the clutter returns were independent, and identically Gaussian distributed. However, when a radar has a spatial resolution high enough to resolve structure on the sea surface, the Gaussian model fails to predict the observed increased occurrence of higher amplitudes or spikes. This lead researchers to use two-parameter distributions to empirically fit these longer tails [7]. As a result, the compound-Gaussian (CG) model for sea clutter has now gained wide acceptance [8], [9] and has been tested both theoretically [10] as well as empirically [11]. Both coherent detection [9] and waveform optimization [12] in non-Gaussian backgrounds require knowledge of the statistics of the clutter echoes and, in [13] for example, the target impulse response. However, the dynamic nature of the ocean surface necessitates a reliance on estimates of the statistics, thus precluding optimal solutions. Moreover, these approaches typically seek optimal but fixed, or dynamically nonadaptive, waveform designs, that fail to exploit the potential of waveform agility. The main contribution of this paper is a methodology to adapt the transmitted waveform on-the-fly, based on online estimation of sea clutter statistics for improved target detection. It is motivated by the fact that, in a radar, the signal obtained after matched filtering at the receiver is a convolution of the ambiguity function of the transmitted signal with the radar scene [14], which smears energy from one range-Doppler cell to another. Therefore, the incorporation of information about the clutter into the design of a waveform whose ambiguity function minimizes this smearing in the region of interest, can improve the SCR and detection performance. In our proposed method, the statistics of the clutter at different ranges are estimated using the expectation-maximization (EM) algorithm and are then used to design a phase-modulated (PM) waveform for the next transmission that improves the SCR. Using clutter covariance estimates derived from real data, we provide numerical simulation examples to demonstrate around 10 dB improvement in detection performance for a single target. Although the development
1932-4553/$25.00 © 2007 IEEE
SIRA et al.: ADAPTIVE WAVEFORM DESIGN
57
is focused purely on range estimation, it is believed to be applicable to range-Doppler estimation; this is the subject of ongoing research. The use of principal component analysis (PCA) for the mitigation of colored interference is well known [15]. This approach can be used to exploit the spatial and temporal correlations in sea clutter returns [11] to mitigate them as was demonstrated in [16]. The primary difficulty with this approach revolves around the estimation of the interference covariance matrix [17], [18] and the subsequent determination of a low-rank interference subspace. Assuming a high pulse-repetition frequency (PRF), we use the CG model to demonstrate that we can form a waveform-independent estimate of the clutter subspace. The orthogonal projection of the received signal into this subspace provides appreciable clutter suppression. The paper is organized as follows. In Section II, we describe the CG model for sea clutter and the processing of the received signal. Section III presents the estimation of the clutter statistics, while Section IV describes the generalized likelihood ratio test (GLRT) detector. The design of a PM waveform is described in Section V, and simulation examples are presented in Section VI. II. SIGNAL AND SEA CLUTTER MODELING pulses We consider a medium-PRF radar that transmits in a dwell on a region of interest before switching to other tasks. Each dwell consists of two sub-dwells, Sub-dwells 1 identical pulses of the waveforms and 2, during which and are transmitted, respectively. The implied waveform agility is thus between sub-dwells rather than on a pulse-to-pulse basis. Each pulse returns a view of the radar scene which consists of clutter and the target, if present. In this section, we describe the CG model for sea clutter and the processing of the received signal.
pulses, conditioned on the texture of the th scatterer over , and speckle covariance matrix with denoting the identity matrix, is a circular complex Gaussian random vector with zero mean and covariance matrix , or [9]. Thus, the samples in (1) are correlated and is nonwhite. Given the texture and the speckle covariance matrix, the reflectivities of two scatterers and are independent so that (2) denotes the probability density function of given where . Due to the high PRF, the duration of each sub-dwell can be made much smaller than the decorrelation time of the speckle, and we assume that the radar scene is practically stationary during this period. Thus, we assume that the number of scatterers in each cell, and the scatterers’ delays and Doppler shifts, are constant during a sub-dwell. However, the scatterer ammay fluctuate randomly because small changes in plitudes range, on the order of the radar wavelength, may cause significant changes in the phase of the received signal [21]. We will also assume that the value of the texture is identical for all clutter scatterers within a cell and is fully correlated across a dwell [22]. B. Received Signal Processing The processing of the received signal is identical in Subdwells 1 and 2. Accordingly, we will use to denote the transand ), and only differentiate mitted signal (instead of between the sub-dwells where necessary, by means of a sub, script. The received signal at the th pulse, is given by
(3)
A. Sea Clutter Modeling According to the CG model, sea clutter returns are believed to be the result of two components: a speckle-like return that arises due to a large number of independent scattering centers reflecting the incident beam, and a texture caused by large-scale swell structures that modulates the local mean power of the speckle return [7],[19].ThespecklegivesrisetolocallyGaussianstatistics,characterized by short correlation time ( ms), while the texture s) [7], [8], [11]. The texture decorrelates much less rapidly ( component also exhibits spatial correlation that depends on the range resolution, sea state, and wind speed [20]. Its probability distribution has been the subject of much investigation. From various studies, sea clutter has been modeled to have K, log-normal, or Weibull distributions [7]. In this paper, we will not assume any particular distribution for the texture, as it is not needed for our waveform design. The radar scene is defined to consist of a number of clutter scatterers and at most one point target, distributed in range and Doppler. In each range-Doppler cell, the number of scatterers is assumed to follow a Poisson distribution with a rate determined by the cell volume and a clutter density . The complex reflectivity
and are the complex reflectivity, delay and where and Doppler shift, respectively, of the target (if present), are the delay and Doppler shift of the th scatterer, respectively, and is additive noise. We will henceforth assume a high clutter-to-noise ratio so that the clutter is the dominant component and additive noise is negligible. Since we only consider transmitted signals of very short duration, the Doppler resolution is very poor. Therefore, we completely ignore Doppler processing and restrict our attention to delay or range estimation alone. to yield a The received signal in (3) is sampled at a rate sequence . Note that is a scalar because a single sensing element is being used to obtain it in contrast to [17], where an array of sensors is used. The sampled signal is matched filtered at each sampling instant to yield the sequence . We define to be the vector of matched-filtered outputs at the th delay or range bin. Then, (4)
(1)
58
IEEE JOURNAL OF SELECTED TOPICS IN SIGNAL PROCESSING, VOL. 1, NO. 1, JUNE 2007
where defines the set of scatterers that lie in the th range is the index of the range bin that contains the target, if bin, present, and is the length of the transmitted signal . Analogous to (1), in (4) is the target reflectivity, which, assuming a Swerling I point . The target [14], is distributed according to in (4) is the autocorrelation function of at function lag and is given by
exact solution for . Therefore, we attempt to find the maximum-likelihood estimate of given the observed data. With , we then seek
(7)
The concept of individual scatterers presented in this section can be thought of as a limiting case of incremental scattering centers on the ocean surface [23], the combined responses of which give rise to the clutter return. It is more convenient to think of a single, aggregate scatterer in each bin with complex amplitude
where is the probability density function of that depends on . Since the maximization in (7) requires a complicated multidimensional search, we instead attempt to find an , where the unobserved estimate of that maximizes or complete data upon which the observed or incomplete data depends is and , where is the Kronecker delta. Reis the amplitude of the aggregate call from (5) and (6) that is the scatterer in the th bin, is the target reflectivity, and index of the range bin in which the target is located. Thus, we seek
(5)
(8)
(6)
which can be accomplished by the application of the EM algorithm as follows [25]. , let be the estimate Starting with an initial guess of after iterations. Then, the EM algorithm is given by the iteration of
for the th range bin, so that (4) is replaced by
We henceforth take the view that the sea clutter return is the result of reflections from these aggregate scatterers. From (2) and (5), we note that . Due to the independence in the contributions of individual scatterers in (2), and the assumption of the texture invariance within a range-Doppler associated with can be seen to be the cell, the texture product of the number of scatterers in the cell and the common texture value associated with each one of them.
III. TEXTURE ESTIMATION The GLRT detector and the waveform design algorithm, both require estimates of the clutter statistics. In this section, we describe the application of the expectation-maximization (EM) algorithm to the estimation of the speckle covariance and the texture values in each range bin. as the Define set of parameters upon which the probability densities of depend. Note that, although the texture is a random process, we consider its values in each bin to be deterministic but unknown variables because they are assumed to be constant across a dwell. This approach is in contrast to most sea clutter research, where the parameters of the probability distribution that is assumed to model the texture are estimated, rather than its actual values (see [24] for example). The speckle however, is treated as a random variable and we estimate its covariance matrix . From (6), we note that there is a many-to-one mapping between the scatterer reflectivities and the matched-filtered vector. This mapping is noninvertible and precludes an
(9) (10) where in (9) is the expectation operator. The details of the computations in (9) and (10) are described next. The mapping in (6) between the unobserved and observed data is linear, which indicates that the probability density funcand , is tion of , given complex Gaussian densities. We thus have a mixture of the linear transformation (11) where the first rows of the are given by
matrix
where
indicates the Kronecker product. Each successive block of the matrix is obtained by circularly shifting the previous block columns to the right. Using the conditional independence of and in (5), the probability density of , given , is complex multivariate Gaussian with zero mean and covariance
(12) is such that
where .
SIRA et al.: ADAPTIVE WAVEFORM DESIGN
59
The log-likelihood function in (9) is therefore given by
(13) where is a constant that does not depend on and denotes the matrix trace. Since is a linear function of , the conis given by [26] ditional expectation of (13), given , at
This solution must be found numerically and provides the that maximizes (14). The algorithm defined by value of (9) and (10) is iterated until successive changes in the parameter values in drop below a set threshold. The form of (19) and (21) makes it computationally expensive to solve because simplifications afforded by the Kronecker product cannot be used in (15) and (16) to obtain . A simpler approach is to make the approximation , which is likely in low-SCR scenarios. Then, (19) reduces to
(14) which, upon substituting for
from (20) gives (22)
(15)
(16) The maximization of (14) is equivalent to the minimization of (17) Since written as
in (12) is a block diagonal matrix, (17) may be
the solution of which, together with (20), provides the value of in (10). Clearly, this approximation causes an inconsistency in modeling the covariance of the return in the bin in which the target is present, where it results in an overestimate of the value of the texture. However, as described in Sections IV-B and V, this inaccurate estimate is never used. On the other hand, in a bin where the target is not present, the weak contribution of the target return is further reduced by the weighting of the autocorrelation function. This can be neglected as long as the autocorrelation function sidelobes are generally much smaller than the peak at the zeroth lag. In practice this is easily achieved—the autocorrelation function of the LFM chirp we use in Sub-dwell 1 has a highest sidelobe level that is 16 dB below the peak. The use of numerical methods to solve (22) results in the major computational burden of this estimation procedure. The temporal variations of the speckle covariance do not appear to have been reported upon. If it is considered to be slowly varying over time, there may not be a requirement to estimate in (22) at each dwell. This can lead to significant savings in computational effort.
(18) IV. CLUTTER SUPPRESSION AND DETECTION where is the covariance matrix of and is the th matrix on the diagonal of . Taking the partial derivatives of (18) with respect to and and equating them to zero, the maximum-likelihood estimate of is obtained from the simultaneous solution of
is motivated by the need to imThe dynamic design of prove the SCR in a range bin that is to be interrogated for the presence of a target. At the end of Sub-dwell 1 therefore, we wish to identify a putative target location. In this section, we develop a GLRT detector that uses the estimates obtained in Section III. The same detector is used at the end of Sub-dwell 2 to provide the final detection from this dwell. A. Clutter Suppression
(19) (20)
(21)
Prior to forming the detector, we seek to suppress the sea clutter. This is motivated by the differences in the correlation properties of the target and clutter returns, as well as the inaccuracy in the estimates of the texture. The latter, which arises due to the lack of averaging in (20), deleteriously affects detection performance. A key requirement for this procedure is the knowledge of the covariance matrix of the clutter returns from which the clutter subspace can be obtained. This is not available and must be estimated online. Next, we demonstrate that the
60
IEEE JOURNAL OF SELECTED TOPICS IN SIGNAL PROCESSING, VOL. 1, NO. 1, JUNE 2007
clutter subspace can be obtained from the eigendecomposition of the speckle covariance matrix , which we have estimated in Section III. The covariance matrix of the matched-filtered return in (6) is given by
target, respectively. We seek to form a detector based on the log-likelihood ratio test, which for range bin is
(25) , and is a threshold where . that is set to obtain a specified probability of false alarm, Since we only have estimates for the parameters in (25), we instead form the GLRT so that From the CG model however, given the texture and covariand are independent if . Also, the ance matrix have zero mean and hence
(23) is a function where the scalar . From (23), we of the waveform due to the dependence on see that the eigenvectors of are identical to those of , and are waveform-independent. The space occupied by the clutter in the matched-filtered return is thus identical to that of , the speckle covariance matrix. This obviates the need to estimate in (23). be the matrix, whose columns are the eigenLet vectors, obtained by eigendecomposition, of in (22), corresmallest eigenvalues of that together sponding to the contribute 0.01% of its total energy. In our simulation study, we have observed that this typically corresponds to the 3–4 smallest . The projection eigenvalues out of
(24) provides the component of the received signal that lies in the space where the clutter has the least energy and represents a clutter-suppressed signal. We have assumed that the target reflectivity is circularly symmetric. Thus, some component of the useful echo does get canceled out while some fraction remains in the subspace orthogonal to the clutter, and thus in . Since is very weak, the projection operathe clutter component in tion in (24) leads to improved SCR. The determination of the interference subspace in principal component methods for clutter suppression has been extensively researched [17], [18], [27]. The method we have used is relatively straightforward but still provides around 5 dB improvement in detection performance at the end of Sub-dwell 1, as shown in Section VI. This is significant because it helps to limit the number of range bins that have to be interrogated in Subdwell 2 and thereby reduces system usage. B. GLRT Detection With respect to a given range bin, we define the hypotheses and to refer to the presence of only clutter or clutter and
(26) From (6) and (23), both probability density functions in (25) are complex Gaussian. The detection problem in (26), is therefore a test of Gaussian distributions with different variances [28]. With the estimates and obtained as described in Section III, the maximum-likelihood estimate can be obtained for an observed value of . Then, following [28], it can be shown that the test in (26) reduces to (27) where ance matrix
are the eigenvalues of the covari-
is a pre-whitened version of , where the columns of the unitary matrix are the , and is a diagonal matrix of the correeigenvectors of sponding eigenvalues. The GLRT detector requires the clutter statistics for each range bin. As discussed in Section III, the value of the texhypothesis is true, is typture in the range bin where the ically overestimated. This is detrimental to detection performance. One way of avoiding this problem is to consider a target that is moving fast enough so that it is located in a different range bin in successive dwells. Then, if the GLRT detector is being formed for the th bin at dwell , we can use the estiobtained during Sub-dwell 1 of the th dwell as mate the clutter statistics for the current dwell. Clearly, this requires the assumption that the texture does not change significantly between dwells, which is reasonable if the time between dwells is about 0.5–1 s. in (27) to It is important to select a suitable threshold permit efficient evaluation of detection performance via Monte in (27) Carlo simulation. Assuming that all the values of as the solution of are distinct, we compute the threshold , where
This computation assumes an exponential distribution for the test statistic in (27) [28], which is an approximation because the are data dependent. However, we do not use this weights threshold to analytically compute detection performance and
SIRA et al.: ADAPTIVE WAVEFORM DESIGN
61
make no claims to its optimality. Further, all the values of can be derived from data obtained in a previous dwell, thus making in (27). them practically independent of It is possible, of course, to perform the detection in (26) on the original matched-filtered signal , rather than on the cluttersuppressed signal . We have found that this approach leads to around 5 dB loss in detection performance. The reason is that, in would be used to this case, all eigenvalues of the matrix form the test statistic in (27). The texture estimation procedure described in Section III is not very accurate due to a lack of averaging, leading to poorly estimated eigenvalues. The clutter suppression described in Section IV-A reduces the number of eigenvalues used in the detector from to , thus limiting the effect of these inaccuracies.
with the total waveform duration and , is the number of samples in the designed signal. As where described in Section V-B, we will require the waveform dura. Consequently, the tion in (28) to be identical to that of and is . The advantage of the number of samples in formulation in (28) is that PM waveforms can be easily generated, and the absence of any amplitude modulation permits the maximum power of the radar to be employed. as Defining the autocorrelation function of
we want to determine the coefficients
in (29) that minimize (30)
V. WAVEFORM DESIGN At the end of Sub-dwell 1, suppose that we have decided to interrogate range bin . Excluding bin itself, all bins in the range contribute out-of-bin clutter to the matched-filtered return and thus to . The objective of our waveform design in Sub-dwell 2 is to minimize this out-of-bin in contribution. To achieve this, we design the waveform takes Sub-dwell 2 such that its autocorrelation function values close to zero at those lags where the clutter is estimated to have the highest energy. The synthesis of waveforms whose ambiguity function best matches a specified function was first investigated in [29]. The approach involves the selection of an orthonormal set of basis functions whose cross-ambiguity functions were shown to induce another orthonormal basis in the time-frequency plane. The coefficients of the expansion of the specified or desired ambiguity function on this induced basis were then used to synthesize the waveform. This approach was further developed using least-squares optimization in [30]. However, this method cannot be easily used to synthesize waveforms where only a desired autocorrelation function instead of an ambiguity function has been specified. In this section, we develop a method that designs a phase-modulated waveform using mean-square optimization techniques so as to achieve low autocorrelation magnitude values at specified lags [31]. A. Synthesis of Phase-Modulated Waveforms Let represent a unimodular phase-modulated (PM) waveform given by (28) where the phase modulation is expanded in terms of an orthogas onal set of basis functions (29)
where , and represents the (possibly disconnected) set of range values for which the texture values are large. The minimization problem posed in (30) can be seen as a special case of a larger problem for which the PM signal whose autocorrelation function best approximates a specified function in a mean-square sense is synthesized. It is relatively straightforward to show that the autocorrelation function for the PM waveform in (28) is
(31) where , and . Using the squared magnitude , the gradient and Hessian of can be easily comof puted and the minimization of (30) can be accomplished by the Newton-Raphson method. Note that it is also possible to use this approach to design two waveforms whose cross-correlation function is small where the clutter is strong, which may then be used in a mismatched filter for Sub-dwell 2. This will however entail added computational complexity. B. Implementation The texture estimation procedure described in Section III provides an estimate of the th texture . We then aim to design a waveform whose autocorrelation is large. For simplicity, function is negligibly small where and are idenwe assume that the signal duration of tical. We choose the bins corresponding to the largest estimated texture values to form the set , excluding , which corresponds to the putative target cell. Since may in (30) contain positive and negative lags, we form the set
62
IEEE JOURNAL OF SELECTED TOPICS IN SIGNAL PROCESSING, VOL. 1, NO. 1, JUNE 2007
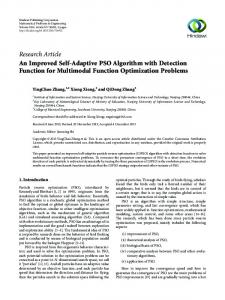
Fig. 1. Generation of K-distributed clutter. The in-phase (I) and quadrature (Q) components of the complex speckle variables are filtered to yield the temporal correlation specified by the speckle covariance matrix . The correlated texture is generated using the memoryless nonlinear transformation (MNLT).
6
with positive lags only, that, together with their corresponding negative lags, account for all the elements of . Since this set is discrete, the integral in (30) reduces to the summation
where the elements of . pling interval
are all integral multiples of the sam-
VI. SIMULATIONS Our simulation model consists of a single moving target that is observed by a single sensor in the presence of simulated sea clutter. Individual clutter scatterers that are randomly distributed in range and velocity are generated, and their amplitudes are sampled from a K-distribution. The received signal is generated according to (3) and is processed as described in Section II-B. Using a GLRT detector as in Section IV-B, Monte Carlo simulations were used to obtain the receiver operating characteristic (ROC) curves presented in this section. We first describe the generation of the synthetic sea clutter. A. Generation of Synthetic Sea Clutter The simulation of sea clutter with meaningful correlations has been the subject of much research (see [32] for a review). We use the method described in [8] and shown in Fig. 1. The scatterer amplitudes in (3) are generated as (32) where is the texture and represents the speckle component that follows a complex Gaussian distribution with zero mean and covariance . For the purpose of the simulations, the texture follows a gamma distribution
where is a scale parameter and is a shape parameter. In our and which results in highly simulations, we use non-Gaussian clutter. and in (32) with appropriate We aim to generate correlations. While it is straightforward to generate correlated speckle variables by independently sampling the real and imaginary parts from a zero mean Gaussian distribution with covariance matrix , gamma variates with arbitrary correlations cannot be easily generated and a number of alternative
Fig. 2. Correlation coefficient of the (a) speckle and (b) texture for the Nov7starea4 dataset, range cell 1, VV polarization, of the OHGR database.
techniques have been proposed [33]–[35]. We use a memoryless nonlinear transformation (MNLT) to generate the correlated gamma-distributed texture variables [36]. B. Speckle and Texture Temporal Correlations In order to simulate sea clutter with appropriate temporal correlations, we derived correlation estimates from experimental clutter data, collected at the Osborne Head Gunnery Range (OHGR) with the McMaster University IPIX radar [37]. Specifically, we used the procedure in [11] to analyze the clutter data in range cell 1 of the Nov7starea4 dataset with VV (vertical transmit and vertical receive) polarization, and the resulting speckle and texture temporal correlations are shown in Fig. 2(a) and (b), respectively. The variation of the correlation properties of sea clutter with time does not appear to have been reported upon. In this simulation, we will assume that the speckle and texture are stationary processes. In Section III however, the speckle covariance and texture values are dynamically estimated and therefore the stationarity assumption is not necessary. C. Simulation Setup At the start of each simulation consisting of 25 dwells, the target is located at a distance of 10 km from the sensor and moves away from it at a near-constant velocity of 5 m/s. At a carrier frequency of GHz, this results in a Doppler shift Hz. The clutter density is adjusted so of approximately that we obtain an average of 20 scatterers per bin, each of which is distributed uniformly in range over the extent of the range bin Hz. and uniformly in Doppler over transmitted in Sub-dwell 1 of each dwell The waveform was chosen to be a linear frequency-modulated (LFM) chirp of duration 1.5 s and a frequency sweep of 100 MHz. Note that the LFM chirp was chosen because it is widely used in radar and provides a useful benchmark for performance comparison. In order to ensure a fair comparison, the LFM chirp was chosen
SIRA et al.: ADAPTIVE WAVEFORM DESIGN
63
k k
Fig. 3. L norm of (a) the matched-filtered output r and (b) the cluttersuppressed output r , for a typical dwell with SCR = 35 dB. The true target range bin is marked with an asterisk.
Fig. 4. ROC curves for a GLRT detector operating on unsuppressed (dotted lines) and clutter-suppressed data (dashed lines). The numbers on the curves indicate SCR values in decibels.
to have the same time-bandwidth product as the designed waveform, . Each transmitted pulse has unit energy and a total pulses were transmitted in each sub-dwell. The pulse of repetition interval (PRI) was 100 s so that the duration of each sub-dwell was 1 ms, which is well within the decorrelation time of the speckle component, as seen in Fig. 2(a). The sampling was 100 MHz so that the number of samples in frequency . The amplitude of the target return was the signal was sampled from a zero mean complex Gaussian process with co, where was chosen to satisfy specified variance matrix values of SCR. We define the SCR to be the ratio of the target signal power to the total power of the clutter in the range bin containing the target. It is thus the SCR at the input to the rephase funcceiver. For the waveform design, we use tions in (29). Example 1: Sea Clutter Suppression The first example demonstrates the advantage of using the subspace-based approach for the suppression of sea clutter. In this example, only is transmitted. A plot of typical the Sub-dwell 1 signal, norms, and , is shown in Fig. 3 values of the dB. The range bin that contains the target for is marked with an asterisk. The ROC curves for this case are shown in Fig. 4 for different SCR. For comparison, the ROC curves obtained by GLRT detection on the raw matched filtered data in (6) are also shown. It is apparent that a performance improvement exceeding 5 dB SCR is obtained. The range bins that are investigated in Sub-dwell 2 with a designed waveform are determined by the detections in Sub-dwell 1. Thus, improved detection in Sub-dwell 1, as evidenced by Fig. 4, results in fewer false alarms to be investigated and leads to reduced system usage and improved efficiency. Example 2: Waveform Design for improved Detection In the second example, we examine the performance at the end of largest Sub-dwell 2. For the waveform design, we used values of the texture estimates to position the zeros of the auto. A typical result of the waveform correlation function of design algorithm is shown in Fig. 5(a), where the magnitude of
Fig. 5. (a) Comparison of the magnitude of the autocorrelation function of the designed PM waveform s [n] (dashed lines) with that of the LFM chirp used as s [n] (solid lines). (b) A zoomed view of the former with asterisks marking the range bins with large texture values.
k k
0
the autocorrelation function of is shown. From the zoomed view of the nulls in Fig. 5(b), it can be observed that the value of is indeed small in the range bins where the clutter was estimated to be strong (which are marked by asterisks). However, it is also evident that some sidelobes of the designed waveform are much higher than the corresponding sidelobes of the LFM chirp. Since these sidelobes occur where weak or negligible clutter has been estimated, their effect on the detection process is negligible. The ROC curves for different SCR values at the end of Subdwell 2 are shown in Fig. 6. Note that these are conditioned on the actual target range bin being interrogated. We also show the ROC curves at the end of Sub-dwell 1 for comparison. We can observe around 10 dB improvement in detection performance when dynamic waveform design is used. For example, the ROC
64
IEEE JOURNAL OF SELECTED TOPICS IN SIGNAL PROCESSING, VOL. 1, NO. 1, JUNE 2007
Fig. 6. ROC curves at the end of Sub-dwell 1 (dashed) and using adaptive waveform design in Sub-dwell 2 (solid). The numbers on the curves indicate SCR values in dB.
curve for dB SCR at the end of Sub-dwell 2 is comparable to the ROC curve for dB SCR at the end of Sub-dwell 1. , the probability Also, at a probability of false alarm improves by 76% and 30% at SCR of dB of detection dB, respectively, when the designed waveform is used. and These gains may be attributed to the fact that the false alarms due to clutter are significantly reduced when the designed waveform is used. In order to further investigate the benefits of dynamic waveform adaptation, we consider a scenario where a dwell is not divided into sub-dwells and all the pulses transmitted are identical. pulses identical to the LFM chirp described in Here, Section VI-C are transmitted and the resulting ROC curves are compared in Fig. 7 to the performance of the dynamic waveform adaptation algorithm. As it may be expected, the performance gains due to dynamic waveform adaptation reduce from those in Fig. 6 due to the increased pulse integration because the returns from 20 fixed LFM pulses are now processed together rather than from 10 pulses. However, the gains are still around 6–7 dB. It is also important to note that the processing of each burst of identical pulses assumes that the radar scene has not changed during the transmission of the burst. Thus, as the pulse duration is increased, it becomes less likely that this assumption remains satisfied. VII. CONCLUSION The problem of detecting small targets in sea clutter has been the subject of much research and has led to the development of clutter rejecting waveforms and improvements in detection performance. The knowledge about the statistical properties of sea clutter gained in the last few decades was used to further improve on these advancements. The application of dynamic waveform design to radar operations is a relatively new development following the availability of flexible waveform generators and waveform-agile sensors.
Fig. 7. ROC curves using
K = 20 LFM chirp pulses (dashed lines), and K = K = 10 dynamically designed waveforms (solid
10 LFM chirp followed by
lines). The numbers indicate SCR values in dB.
In this paper, we proposed an algorithm that utilizes the benefit provided by waveform agility to improve detection performance at low SCRs. Using a two-stage procedure, we first gather information about the clutter statistics and identify a putative target location. The knowledge of the correlation properties of the clutter over a short time period is exploited by a simple, subspace-based clutter suppression scheme that enhances detection performance. The waveform for the next transmission is dynamically designed using a mean square optimization technique applied to phase modulated waveforms so that its autocorrelation function is small where the clutter is estimated to be strong. This design of the waveform minimizes the smearing of energy from out-of-bin clutter into the range bin under investigation. A simulation study was presented to demonstrate the performance of the algorithm, and reasonable gains in the detection performance over the nonadaptive case were observed. The advantage of the waveform design can be more readily appreciated if the radar scene contains strong reflectors or emitters, such as other targets or jammers, for example, whose range sidelobes can mask a weak reflection from another target. The ability to position the sidelobes of the designed waveform may have significant payoffs in such scenarios. The waveform design development presented does not include Doppler processing. Although most elements of the algorithm can be immediately extended to range-Doppler estimation, the requirement to transmit longer waveforms to obtain meaningful Doppler resolution may invalidate the assumption of complete correlation of the texture across a dwell. ACKNOWLEDGMENT The authors thank Prof. M. Greco for providing them access to the OHGR sea clutter database (with permission from Prof. S. Haykin). They also thank Prof. A. Nehorai and Prof. L. Scharf for insightful discussions. They acknowledge the comments and suggestions of the reviewers which have resulted in substantial improvements in this paper.
SIRA et al.: ADAPTIVE WAVEFORM DESIGN
REFERENCES [1] D. J. Kershaw and R. J. Evans, “Optimal waveform selection for tracking systems,” IEEE Trans. Inform. Theory, vol. 40, no. 5, pp. 1536–1550, Sep. 1994. [2] S. D. Howard, S. Suvorova, and W. Moran, “Waveform libraries for radar tracking applications,” in Proc. Int. Conf. Waveform Diversity and Design, Nov. 2004. [3] S. P. Sira, A. Papandreou-Suppappola, and D. Morrell, “Characterization of waveform performance in clutter for dynamically configured sensor systems,” in Proc. Waveform Diversity and Design Conf., Lihue, HI, Jan. 2006. [4] S. P. Sira, A. Papandreou-Suppappola, and D. Morrell, “Dynamic configuration of time-varying waveforms for agile sensing and tracking in clutter,” IEEE Trans. Signal Processing, to be published. [5] I. S. Reed, J. D. Mallett, and L. E. Brennan, “Rapid convergence rate in adaptive arrays,” IEEE Trans. Aerosp. Electron. Syst., vol. 10, pp. 853–863, Nov. 1974. [6] D. F. DeLong and E. M. Hofstetter, “On the design of optimum radar waveforms for clutter rejection,” IEEE Trans. Inform. Theory, vol. IT-13, no. 3, pp. 454–463, Jul. 1967. [7] S. Haykin, R. Bakker, and B. W. Currie, “Uncovering nonlinear dynamics—The case study of sea clutter,” Proc. IEEE, vol. 90, pp. 860–881, May 2002. [8] K. Ward, C. Baker, and S. Watts, “Maritime surveillance radar Part I : Radar scattering from the ocean surface,” in Proc. Inst. Elect. Eng., Apr. 1990, vol. 137, no. 2, pp. 51–62. [9] K. J. Sangston and K. R. Gerlach, “Coherent detection of radar targets in a non-Gaussian background,” IEEE Trans. Aerosp. Electron. Syst., vol. 30, no. 2, pp. 330–340, Apr. 1994. [10] C. J. Oliver, “Correlated K-distributed clutter models,” in Optica Acta, 1985, vol. 32, no. 12, pp. 1515–1547. [11] A. Farina, F. Gini, M. V. Greco, and L. Verrazzani, “High resolution sea clutter data: Statistical analysis of recorded live data,” in Proc. Inst. Elect. Eng., Jun. 1997, vol. 144, no. 3, pp. 121–130. [12] J. S. Bergin, P. M. Techau, J. E. D. Carlos, and J. R. Guerci, “Radar waveform optimization for colored noise mitigation,” in Proc. IEEE Int. Radar Conf., May 2005, pp. 149–154. [13] S. U. Pillai, D. C. Youla, H. S. Oh, and J. R. Guerci, “Optimum transmit-receiver design in the presence of signal-dependent interference and channel noise,” IEEE Trans. Inform. Theory, vol. 46, no. 2, pp. 577–584, Mar. 2000. [14] M. I. Skolnik, Introduction to Radar Systems, 3rd ed. New York: McGraw-Hill, 2001. [15] A. Haimovich, “The eigencanceler: Adaptive radar by eigenanalysis methods,” IEEE Trans. Aerosp. Electron. Syst., vol. 32, no. 2, pp. 532–542, Apr. 1996. [16] S. Suvorova, B. Moran, and M. Viola, “Adaptive modeling of sea clutter and detection of small targets in heavy sea clutter,” in Proc. IEEE Int. Radar Conf., 2003, pp. 614–618. [17] J. R. Guerci, Space-Time Adaptive Processing for Radar. Norwood, MA: Artech House, 2003. [18] P. A. Zulch, J. S. Goldstein, J. R. Guerci, and I. S. Reed, “Comparison of reduced-rank signal processing techniques,” in Proc. Asilomar Conf. Signals, Systems, and Computers, Nov. 1998, vol. 1, pp. 421–425. [19] S. Watts, K. D. Ward, and R. J. A. Tough, “The physics and modelling of discrete spikes in radar sea clutter,” in Proc. IEEE Int. Radar Conf., 2005. [20] S. Watts and K. D. Ward, “Spatial correlation in K-distributed sea clutter,” in Proc. Inst. Elect. Eng., Oct. 1987, vol. 134, no. 6, pp. 526–532. [21] B. Friedlander, “A subspace framework for adaptive radar waveform design,” in Proc. Asilomar Conf. Signals, Systems, Computers, Oct. 2005, pp. 1135–1195. [22] F. Gini and A. Farina, “Vector subspace detection in compound-Gaussian clutter Part I: Survey and new results,” IEEE Trans. Aerosp. Electron. Syst., vol. 38, no. 4, pp. 1295–1311, Oct. 2002. [23] P. E. Lawrence and A. P. Szabo, “Clutter simulation in maritime environments,” in Proc. IEEE Int. Radar Conf., Sep. 2003, pp. 619–624. [24] J. Wang, A. Dogandˇzic, and A. Nehorai, “Maximum likelihood estimation of compound-Gaussian clutter and target parameters,” IEEE Trans. Signal Processing, vol. 54, pp. 3884–3898, Oct. 2006. [25] A. Dempster, N. Laird, and D. Rubin, “Maximum likelihood estimation from incomplete data via the EM algorithm,” J. R. Statist. Soc. B, vol. 39, no. 1, pp. 1–38, 1977.
65
[26] M. Feder and E. Weinstein, “Parameter estimation of superimposed signals using the EM algorithm,” IEEE Trans. Acoust., Speech, Signal Processing, vol. 36, no. 4, pp. 477–489, Apr. 1988. [27] I. P. Kiersteins and D. W. Tufts, “Adaptive detection using low-rank approximation to a data matrix,” IEEE Trans. Aerosp. Electron. Syst., vol. 30, no. 1, pp. 55–67, Jan. 1994. [28] S. M. Kay, Fundamentals of Statistical Signal Processing: Detection Theory. Englewood Cliffs, NJ: Prentice-Hall, 1993, vol. 2. [29] C. Wilcox, “The synthesis problem for radar ambiguity functions,” in Radar and Sonar Part I, ser. The IMA volumes in Mathematics and Its Applications. New York: Springer-Verlag, 1991, vol. 32, pp. 229–260. [30] S. M. Sussman, “Least-square synthesis of radar ambiguity functions,” IRE Trans. Inform. Theory, vol. IT-8, Apr. 26, 1962. [31] J. D. Wolf, G. M. Lee, and C. E. Suyo, “Radar waveform synthesis by mean-square optimization techniques,” IEEE J. Oceanic Eng., vol. AES-5, no. 4, pp. 611–619, Jul. 1969. [32] I. Antipov, Simulation of sea clutter returns, Defence Science and Technology Organisation,, Salisbury, South Australia, Tech. Rep. DSTO-TR-0679, Jun. 1998. [33] S. Watts, “Cell-averaging CFAR gain in spatially correlated K-distributed clutter,” in Proc. Inst. Elect. Eng., 1996, vol. 143, no. 5, pp. 321–327. [34] E. Conte, M. Longo, and M. Lops, “Modelling and simulation of nonRayleigh clutter,” in Proc. Inst. Elect. Eng., Apr. 1991, vol. 138, no. 2, pp. 121–130. [35] B. C. Armstrong and H. D. Griffiths, “Modelling spatially correlated K-distributed clutter,” Electron. Lett., vol. 27, no. 15, pp. 1355–56, Jul. 1991. [36] R. J. A. Tough and K. D. Ward, “The correlation properties of gamma and other non-Gaussian processes generated by memoryless nonlinear transformation,” J. Phys. D: Appl. Phys., vol. 32, pp. 3075–3084, 1999. [37] A. Drosopoulos, Description of the OHGR database. Transl.: Defence Research Establishment Ottawa, Tech. Rep. 94-14, Dec. 1994 [Online]. Available: http://soma.crl.mcmaster.ca/ipix/dartmouth/index.html
Sandeep Sira received the M.Tech. degree from the Indian Institute of Technology, Kanpur, India, in 1999, and the Ph.D. degree in electrical engineering in 2007 from Arizona State University (ASU), Tempe. He was a Commissioned Officer in the Corps of Signals, Indian Army, from 1988 to 2003. He is currently a Postdoctoral Research Associate at ASU. His research interests include waveform-agile sensing, target tracking, and detection and estimation theory.
Douglas Cochran received the S.M. and Ph.D. degrees in applied mathematics from Harvard University, Cambridge, MA, and degrees in mathematics from the Massachusetts Institute of Technology, Cambridge, and the University of California at San Diego, La Jolla. He has been on the faculty of the Department of Electrical Engineering at Arizona State University (ASU), Tempe, since 1989 and is also affiliated with the Department of Mathematics and Statistics. Since 2005, he has served as Assistant Dean for Research in the Ira A. Fulton School of Engineering at ASU. Between 2000 and 2005, he was Program Manager for Mathematics at the Defense Advanced Research Projects Agency (DARPA). Prior to joining the ASU faculty, he was Senior Scientist at BBN Systems and Technologies, Inc., during which time he served as Resident Scientist at the DARPA Acoustic Research Center and the Naval Ocean Systems Center. He has been a Visiting Scientist at the Australian Defence Science and Technology Organisation and served as a consultant to several technology companies. His research is in applied harmonic analysis and statistical signal processing. Dr. Cochran was General Co-Chair of the 1999 IEEE International Conference on Acoustics, Speech, and Signal Processing (ICASSP-99) and Co-Chair of the 1997 U.S.-Australia Workshop on Defense Signal Processing. He has also served as Associate Editor for book series and journals, including the IEEE TRANSACTIONS ON SIGNAL PROCESSING.
66
IEEE JOURNAL OF SELECTED TOPICS IN SIGNAL PROCESSING, VOL. 1, NO. 1, JUNE 2007
Antonia Papandreou-Suppappola (M’95–SM’03) received the Ph.D. degree in electrical engineering in 1995 from the University of Rhode Island (URI), Kingston. Upon graduation, she held a research faculty position at URI with Navy funding. In 1999, she joined Arizona State University, Tempe, and was promoted to Associate Professor in 2004. Her research interests are in the areas of waveform design for agile sensing, integrated sensing and processing, time-frequency signal processing, and signal processing for wireless communications. She is the editor of the book Applications in TimeFrequency Signal Processing (CRC, 2002). Dr. Papandreou-Suppappola is the recipient of the 2002 NSF CAREER award and 2003 IEEE Phoenix Section Outstanding Faculty for Research award. She served as the Treasurer of the Conference Board of the IEEE Signal Processing Society from 2004 to 2006. She is currently serving as an Associate Editor for the IEEE TRANSACTIONS ON SIGNAL PROCESSING and as a Technical Committee Member of the IEEE Signal Processing Society on Signal Processing Theory and Methods (2003-2008).
Darryl Morrell received the Ph.D. degree in electrical engineering in 1988 from Brigham Young University, Provo, UT. He is currently an Associate Professor in the Department of Engineering, Arizona State University at the Polytechnic Campus, Mesa, where he is participating in the design and implementation of a multidisciplinary undergraduate engineering program using innovative research-based pedagogical and curricular approaches. His research interests include stochastic decision theory applied to sensor scheduling and information fusion. He has received funding from the Army Research Office, the Air Force Office of Scientific Research, and DARPA to investigate different aspects of Bayesian decision theory with applications to target tracking, target identification, and sensor configuration and scheduling problems in the context of complex sensor systems and sensor networks. His publications include over 50 refereed journal articles, book chapters, and conference papers.
William Moran (M’95) is Research Director of Melbourne Systems Laboratory and a Professorial Fellow with the Department of Electrical and Electronic Engineering, University of Melbourne, Melbourne, Australia. He has participated in numerous signal processing research projects for U.S. and Australian government agencies and industrial sponsors. He has published extensively in both pure and applied mathematics. He has authored or co-authored well over 100 published mathematical research articles. His main areas of interest are in signal processing, particularly with radar applications, waveform design and radar theory, and sensor management. He also works in various areas of mathematics, including harmonic analysis and number theory. Dr. Moran is a Fellow of the Australian Academy of Science and a Member of Australian Research Council College of Experts. He also serves as a Consultant to the Australian Department of Defence, through the Defence Science and Technology Organization.
Stephen D. Howard received the B.S, M.S., and Ph.D. degrees from La Trobe University, Melbourne, Australia, in 1982, 1984, and 1990, respectively. He joined the Australian Defence Science and Technology Organisation (DSTO) in 1991, where he has been involved in the area of electronic surveillance and radar for the past 14 years. He has led the DSTO research effort into the development of algorithms in all areas of electronic surveillance, including radar pulse train deinterleaving, precision radar parameter estimation and tracking, estimation of radar intrapulse modulation, and advanced geolocation techniques. Since 2003, he has led the DSTO long-range research program in radar resource management and waveform design.
Robert Calderbank (M’89–SM’97–F’98) received the B.Sc. degree in 1975 from Warwick University, Warwick, U.K., the M.Sc. degree in 1976 from Oxford University, Oxford, U.K., and the Ph.D. degree in 1980 from the California Institute of Technology, Pasadena, all in mathematics. He is currently Professor of electrical engineering and mathematics at Princeton University, Princeton, NJ, where he directs the Program in Applied and Computational Mathematics. He joined Bell Telephone Laboratories as a Member of Technical Staff in 1980, and retired from AT&T in 2003 as Vice President of Research. He has research interests that range from algebraic coding theory and quantum computing to the design of wireless and radar systems. Dr. Calderbank served as Editor in Chief of the IEEE TRANSACTIONS ON INFORMATION THEORY from 1995 to 1998, and as Associate Editor for Coding Techniques from 1986 to 1989. He was a member of the Board of Governors of the IEEE Information Theory Society from 1991 to 1996 and began a second term in 2006. He was honored by the IEEE Information Theory Prize Paper Award in 1995 for his work on the Z linearity of Kerdock and Preparata Codes (joint with A. R. Hammons, Jr., P. V. Kumar, N. J. A. Sloane, and P. Sole), and again in 1999 for the invention of space-time codes (joint with V. Tarokh and N. Seshadri). He received the 2006 IEEE Donald G. Fink Prize Paper Award and the IEEE Millennium Medal, and was elected to the National Academy of Engineering in 2005.