ADB INSTITUTE RESEARCH PAPER 49
Track Record of Financial Institutions in Assisting the Poor in Asia
Richard L. Meyer December 2002 The impact of microfinance programs on the poor is difficult to assess, although a number of studies have tried. This paper usefully summarizes the performance of the industry and identifies a number of empirical pitfalls and methodological problems. While outreach is surprisingly impressive, financial sustainability remains a major problem in many countries. Most importantly, positive benefits vary by gender, type of program and country, and some households may be so poor and lacking basic skills that it could even be a mistake to encourage them to borrow.
adbi.org
ADB Institute Research Paper Series No. 49 December 2002
Track Record of Financial Institutions in Assisting the Poor in Asia
Richard L. Meyer
ADB INSTITUTE RESEARCH PAPER
49
ABOUT THE AUTHOR
Richard L. Meyer is Professor Emeritus and Senior Research Specialist in the Department of Agricultural, Environmental and Development Economics at The Ohio State University in Columbus, Ohio, United States. He has published widely on the topics of rural and microfinance and has conducted research on these subjects in Asia, Latin America and Africa. He led research projects in the Philippines, Bangladesh and Thailand and has been a consultant to US AID, World Bank, FAO, and the Asian Development Bank. For the ADB, he was the senior author of Rural Financial Markets in Asia: Policies, Paradigms, and Performance published by the Oxford University Press in 2000.
Additional copies of the paper are available free from the Asian Development Bank Institute, 8th Floor, Kasumigaseki Building, 3-2-5 Kasumigaseki, Chiyoda-ku, Tokyo 100-6008, Japan. Attention: Publications. Also online at www.adbi.org Copyright © 2002 Asian Development Bank Institute & the author. All rights reserved. Produced by ADBI Publishing.
The Research Paper Series primarily disseminates selected work in progress to facilitate an exchange of ideas within the Institute’s constituencies and the wider academic and policy communities. The findings, interpretations, and conclusions are the author’s own and are not necessarily endorsed by the Asian Development Bank Institute. They should not be attributed to the Asian Development Bank, its Boards, or any of its member countries. They are published under the responsibility of the Dean of the ADB Institute. The Institute does not guarantee the accuracy or reasonableness of the contents herein and accepts no responsibility whatsoever for any consequences of its use. The term “country”, as used in the context of the ADB, refers to a member of the ADB and does not imply any view on the part of the Institute as to sovereignty or independent status. Names of countries or economies mentioned in this series are chosen by the authors, in the exercise of their academic freedom, and the Institute is in no way responsible for such usage.
II
PREFACE
The ADB Institute aims to explore the most appropriate development paradigms for Asia composed of well-balanced combinations of the roles of markets, institutions, and governments in the post-crisis period. Under this broad research project on development paradigms, the ADB Institute Research Paper Series will contribute to disseminating works-in-progress as a building block of the project and will invite comments and questions. I trust that this series will provoke constructive discussions among policymakers as well as researchers about where Asian economies should go from the last crisis and recovery.
Masaru Yoshitomi Dean ADB Institute
III
ABSTRACT Major investments have been made in developing microfinance in Asia with reducing poverty as one of the frequently stated objectives. A variety of institutional forms of microfinance are being introduced in the regionincluding by the ADBand financial institutions pursue different objectives, so it is difficult to assess how well microfinance is actually contributing to poverty alleviation.
There is little systematic data available on which to make global or regional
generalizations. The objective of this paper is to provide some insights into how well the industry is performing by summarizing and evaluating key studies and data for the region. A critical triangle of microfinances, including outreach, sustainability and impact, is used as the conceptual framework to organize the presentation. Criteria are defined for these three objectives and methodological problems are discussed for each. Evaluating impact presents the most serious empirical challenge. The results reveal that outreach is quite impressive, especially in Bangladesh and Indonesia. Millions of poor households in the region are now receiving formal financial services because of the expansion of microfinance.
Financial sustainability, however, is an important
problem facing the industry in most countries. Many microfinance institutions still depend on government and donor subsidies for their existence. The impact studies reviewed reported some positive benefits but they vary by gender, type of program and country. Several implications of these findings for microfinance institutions and decision makers are discussed.
IV
TABLE OF CONTENTS About the Author
II
Preface
III
Abstract
IV
Table of Contents
V
1.
1
2.
Introduction Evaluating MFI Performance 2.1. The Critical Microfinance Triangle 2.2. Measuring Outreach 2.3. Measuring Financial Sustainability 2.4. Measuring Impact 2.4.1. Identifying Benefits from Financial Services 2.4.2. Methodological and Other Problems in Quantitatively Measuring Impacts 2.4.3. Qualitative Studies of Impact
7 11
3.
MFI Performance in Asia 3.1. Outreach 3.2. MFI Sustainability 3.2.1. Evidence from Microbanking Bulletin 3.2.2. Evidence from M-CRIL 3.2.3. The Subsidy Dependence Index 3.3. Impact of Microfinance 3.3.1. World Bank Study in Bangladesh 3.3.2. Studies of Village Banking in Thailand 3.3.3. AIMS Study of SEWA Bank in India 3.4. Unresolved Puzzles about Impact 3.4.1. Training 3.4.2. Impact on the Poorest 3.4.3. Dropouts 3.4.4. Vulnerability
12 12 14 14 17 17 18 18 20 23 26 26 27 27 27
4.
Implications for MFIs and Policy Makers in Asia 4.1. Expanding Outreach 4.2. Achieving Financial Self-sustainability 4.3. Improving Impact 4.4. Financial Components in Nonfinancial Projects
28 28 28 29 30
V
1 2 4 4 5 6
References
31
Tables and Figure (in body of text) Table 1. Average Results for Asian Peer Groups Compared to All and Financially Sustainable MFIs Table 2. List of MFIs included in the Asian Peer Groups Figure 1. The Critical Microfinance Triangle
VI
15 16 3
Track Record of Financial Institutions in Assisting the Poor in Asia† Richard L. Meyer 1. Introduction Major investments have been made in developing microfinance in Asia with reducing poverty as one of the frequently stated objectives for these programs. The purpose of this paper is to summarize evidence about how well the microfinance industry in Asia is performing towards meeting this objective. A general assessment of microfinance is complicated by the variety of institutional forms found in the region and the different objectives pursued by financial institutions. For example, the unit desa system of Bank Rakyat in Indonesia (BRI-UD) was designed to deliver market-oriented financial products to individuals with a heavy emphasis on mobilizing local savings. The Grameen Bank (GB) and most microfinance institutions (MFIs) in Bangladesh are designed to deliver subsidized loans1 through joint liability groups. Until recently, obligatory savings were treated largely as a source of loan capital rather than a useful financial service to clients. While the BRI and many MFIs use branch systems to deliver products directly to clients, others employ a village banking or credit union approach to build small independent member-owned financial institutions to serve local clients. Some countries have created specialized banks for the poor that offer a wide variety of banking services. Others countries are creating selfhelp groups linked to banks, and there are a few cases of commercial banks opening special windows to serve the poor. Therefore, it is difficult to generalize about the entire industry and there are no comprehensive data covering the thousands of MFIs that operate in the region. For these reasons, the information presented here is derived from studies conducted on individual institutions and the few countries that provide comprehensive data. In the next section of the paper, the criteria used to measure performance will be discussed. A section follows that summarizes key studies with empirical evidence on performance, and the last section identifies issues faced by MFIs and policy makers to improve microfinance performance in the region. 2. Evaluating MFI Performance Different segments of the microfinance industry propose different criteria to evaluate performance but a consensus is emerging among analysts to evaluate the industry in terms of a critical triangle.
†
We thank Robert Barro, Richard Portes and participants at the NBER Conference on Management of Currency Crises, Monterey, United States, March 2001 for their helpful comments on an earlier draft. SiYeon Lee and Do-Won Kwak provided able research assistance. 1 Subsidization in this case means that MFIs cannot fully cover with their interest earnings their actual financial costs including the opportunity cost of the resources they utilize.
1
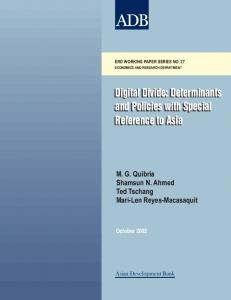
2.1. The Critical Microfinance Triangle 2 Our “critical microfinance triangle” is portrayed in Figure 1. The triangle presents a conceptual framework for thinking about three overarching policy objectives: outreach to the poor, financial sustainability, and welfare impact. Performance criteria are required for each objective and all three must be measured to thoroughly evaluate microfinance performance. The inner circle in the Figure represents MFI innovations in technology, policies, organization, and management that affect how well each objective is met. The outer circle represents the environment within which microfinance operates that also affects performance. This environment broadly includes the human and social capital possessed by the poor, the economic policies of the country, and the quality of the financial infrastructure that supports financial transactions. Improvements in the environment make it easier for MFIs to reach the three objectives. This framework reflects recent shifts in paradigms, strategies, and development practices that have emerged in financial sector development. Many changes can be traced to the failures of the traditional small farmer credit paradigm and the recent successes of a few microfinance institutions (MFIs). Policies to develop financial markets have been traditionally based on an assumed gap between the demandincluding the ability and willingness to payfor credit and savings services, and the supply of those services for specific population groups. Small farmers were the primary concern in the 1960s and 1970s; the poor emerged as the chief focus in the 1980s and 1990s. Matching the supply of financial services with demand has been a consistent challenge for financial institutions attempting to serve clientele groups outside the frontier of formal finance (Von Pischke, 1991). Policymakers have used various interventions to narrow the gap between the demand for and supply of financial services. Targeted subsidized credit channeled through parastatal development banks and agricultural credit projects dominated the small farmer credit era. These attempts have been largely replaced by a more market-oriented paradigm characteristic of the socalled “New Development Finance” (Adams, 1998; Meyer and Nagarajan, 2000). Many of the early microfinance innovations were created by GB in Bangladesh, by the BRI-UD, and by BancoSol in Bolivia. They focused on expanding the financial frontier by building cost-effective organizations responsive to client demand. Their efforts were consistent with the new paradigm argument that some root causes of the gap between demand and supply are high transaction costs and risks due to information asymmetries and moral hazard (Stiglitz and Weiss, 1981) for both financial intermediaries and clients. Therefore, the New Development Finance paradigm emphasizes building sustainable institutions, institutional innovation to reduce costs and risks, and a market-driven allocation of financial services. This paradigm has greater potential to sustainably expand the financial frontier, but it is also complex and challenging to implement.
2
The concept of the critical triangle is discussed more fully in the forthcoming book by Zeller and Meyer (2002).
2
Figure 1. The Critical Microfinance Triangle
Human Capital, Policies, and Financial Infrastructure
OUTREACH TO THE POOR
INSTITUTIONAL INNOVATIONS
FINANCIAL SUSTAINABILITY
IMPACT
Source: Zeller and Meyer (2002)
3
2.2. Measuring Outreach The first objective to be evaluated in MFI performance is outreach, commonly understood as number of clients served. In fact, the concept is multidimensional (Navajas, et al. 2000) of which four are emphasized here. The first is simply the number of persons now served that were previously denied access to formal financial services. Usually these persons will be the poor because they cannot provide the collateral required for accessing formal loans, are perceived as being too risky to serve, and impose high transaction costs on financial institutions because of the small size of their financial activities and transactions. Women often face greater problems than men in accessing financial services so number of women served is often measured as another criterion. Although difficult to measure, depth of poverty is a concern because the poorest of the poor face the greatest access problems. Some measure of depth of outreach is needed to evaluate how well MFIs reach the very poor. Finally, the variety of financial services provided is a criterion because it has been shown that the poor demand and their welfare will be improved if efficient and secure savings, insurance, remittance transfer and other services are provided in addition to the loans that are the predominant concern of policy makers. 2.3. Measuring Financial Sustainability The financial sustainability of MFIs is important as the poor benefit most if they have access to financial services over time rather than receive, for example, just one loan but denied future loans because the MFI has disappeared, or is illiquid because repayment rates are low, or funds promised by donors or governments have not materialized. Two levels of financial sustainability can be measured. One is a lower level of achievement in which the MFI reaches operational self-sustainability meaning that operating income is sufficient to cover operating costs, including salaries and wages, supplies, loan losses, and other administrative costs. Financial self-sustainability is a higher standard because it means that the MFI can also cover the costs of funds and other forms of subsidies received when they are valued at market rates. Achieving this level is important because it means the MFI would still break even if all subsidies would be withdrawn. However, this does not always assure long-term institutional sustainability. In addition, the MFI must earn enough income to build capital reserves required for growth and as protection against future shocks. Measuring financial sustainability requires that MFIs maintain good financial accounts and follow recognized accounting practices that provide full transparency for income, expenses, loan recovery, and potential losses. Many MFIs cannot meet this standard. There is some debate about the expected relationship between outreach and sustainability. Some analysts (e.g. Christen et al., 1995; Otero and Rhyne, 1994) argue that increasing outreach and sustainability are complementary objectives because larger numbers of clients help MFIs achieve economies of scale and reduce costs. Hulme and Mosley (1996), however, argue that a trade-off might exist between depth of outreach and sustainability. This trade-off arises because MFI transaction costs are high for obtaining information needed to determine the creditworthiness of poor clients (Navajas et al., 2000). Transaction costs have a large fixed cost component so the unit costs for 4
smaller savings deposits or smaller loans are higher than for larger financial transactions. This law of decreasing unit transaction costs with larger size transactions means that serving the nonpoor may increase the potential to reach sustainability. MFIs, of course, can still be sustainable while serving the poor if they charge high enough interest rates or achieve high levels of efficiency (Woller, 2000).3 2.4. Measuring Impact For this paper, impact assessment is defined as attributing specific effects, impacts, or benefits to specific interventions, in this case, improved access to financial services. Reducing poverty is an explicit or implicit benefit of most microfinance programs. An important conceptual challenge is that the conceptualization of poverty has changed during the past couple of decades. Historically, poverty was viewed as a problem of the poor earning too little income, consequently consuming too little to attain a socially acceptable standard of living, and possessing too few assets to protect themselves against unforeseen problems. During the past two decades, analysts concluded that this traditional view of poverty was too narrow and simplistic. A recent example of an expanded view of poverty is found in the World Bank’s World Development Report 2000/2001. It notes that not only do the poor lack income; they lack adequate food, shelter, education and health. They are vulnerable to ill health, economic dislocation, and natural disasters. They are often exposed to ill treatment by the state and are powerless to influence decisions that affect their lives. Determining if microfinance actually helps lift people out of poverty requires selecting which definition of poverty to use, then measuring if they become less poor by receiving financial services. Measuring the impact on clients of financial services provided by MFIs is the most difficult and controversial aspect of performance evaluation. The key problems faced in measuring impact are summarized in this section so readers can appreciate why the results of impact assessments must be interpreted with great caution. Because of the methodological difficulties and high costs involved in conducting robust studies, it has been argued that the most important evidence of impact should be whether or not MFI clients continue to use the services. If they do, they must value the benefits received more than the costs of obtaining them. Impact analysis, therefore, should focus on understanding the impacts on MFIs of programs offering services to the poor rather than impacts on the clients of such services. A counter argument is that most of the industry requires substantial amounts of public funds at least in the form of start-up costs if not in the form of long-term subsidization. These funds have opportunity costs (they have alternative uses for society) so policy makers need evidence as to whether or not clients are receiving direct measurable benefits from microfinance. If not, the funds should be allocated to other means to fight poverty. Moreover, in light of the large number of dropouts reported by some MFIs and the opportunity to redesign MFI products to better 3
Morduch (December, 1999) argued that MFIs might be institutionally sustainable in the long-term through continuous subsidization as long as they demonstrated they provided to the poor services highly valued by society. The challenge in practice, however, is for subsidized institutions to not slip into the abyss of inefficiency in supplying such services. The author accepts the argument that the strong incentives created when nonsubsidized institutions compete to survive in the market place is the best way to assure the efficiency and long-term sustainability of MFIs in Asia.
5
meet client demands (Meyer, 2002), the issue of impact on clients is increasingly important. 2.4.1. Identifying Benefits from Financial Services The benefits identified and measured depend importantly upon the definition of poverty used and the attributes of microfinance offered in particular situations. As a result, a rich and diverse set of impact indicators are used in impact assessments. The most common analysis attempts to identify and measure the economic benefits associated with any traditional or new investment and production activities that firms and households engage in due to additional liquidity in the form of loans received. A second possible economic benefit from loans could be consumption smoothing and changes in firm and household balance sheets, such as holding less crop and livestock inventories due to the availability of additional financial resources.4 Some analysts have searched for various noneconomic benefits that incorporate newer views about poverty. For example, some MFIs expect to empower women clients in cultures where their economic and social opportunities are limited. Women often have the primary responsibility for household and family welfare, so impact studies have attempted to determine if providing women with improved access to financial services produces different impacts in the household compared to providing the same services to men. Studies have tested for such widely divergent noneconomic benefits as improved nutrition and hygiene, investments in children’s education, greater participation in family planning, and improved self-esteem. Some benefits may be separate and independent while others form part of a causal chain in which short-term or intermediate effects may produce other longer-term benefits, such as when a MFI client earns more income and spends it to improve her family’s nutrition (Hulme, 2000). Improved nutrition for children, in turn, may improve their performance in school. Since most impact studies focus on relatively short-term benefits, they miss longer-term benefits that may occur through increased nutrition and education. An impact assessment is designed to collect and analyze data to determine if the benefits expected were actually realized by MFI clients. The identification of benefits to be studied can be based on theory, on the objectives and procedures of the MFI being studied, on the opinions of knowledgeable persons in the MFI, and by listening to client perceptions of benefits received. The fungibility of loan funds makes it nearly impossible for analysts to fully anticipate the range of benefits that may accrue to a large number of heterogeneous clients (Von Pischke and Adams, 1980; Dunn, 2002). Therefore, choices must be made to identify those benefits expected to be most probable and important.
4
Zeller et al. (1997) pioneered the idea of three economic pathways of possible impact within a household.
6
2.4.2. Methodological and Other Problems in Quantitatively Measuring Impacts A large number of methodological problems exist in designing and conducting quantitative microfinance impact studies, and the ways they are resolved influence the robustness of the results obtained. Many problems are similar to those faced in assessing the impact of any development project, while others represent problems unique to finance (Baker, 2000; Coleman, 1999; Hulme, 2000; David and Meyer, 1980; Karlan, 2001; Khandker, 1998; Ravallion, 2001; Roche, 1999). They include issues of study design, data collection, and statistical and econometric analysis. Unless these issues are resolved in satisfactory ways, the benefits estimated from microfinance may be exaggerated, or they may appear negligible when in fact they are significant. The key concepts and problems are summarized below:5 •
•
•
Poverty proxiesThe first fact that must be established is whether or not the poor actually receive microfinance services. This requires the use of some type of poverty proxy to measure the poverty level of clients and perhaps nonclients. MFIs often establish specific targeting criteria, such as land ownership, income level, or household characteristics, to identify those who qualify for their services. Some MFIs simply offer small loans assuming that richer people have access to alternatives so only the poor will choose to become clients. Whether or not specific criteria are established, there is evidence to show that many nonpoor use microfinance and most MFIs do not serve large numbers of the very poor.6 Impact assessments must establish proxy indicators to measure the level of client poverty, and members of control groups that are used in the study. Variables must also be selected as proxies to measure the impacts or benefits expected from microfinance. Many benefits can be easily stated as concepts but are complex to measure in practice. For example, literally dozens of variables involving quantities and prices must be specified and estimated to determine if the income of a farm household improved. Benefits such as improved health cannot be directly measured so appropriate measurable proxies must be selected, such as number of days of sickness. Selecting appropriate proxies for broad concepts such as empowerment is especially complicated. CounterfactualA method is required to estimate what would have happened to MFI clients if they had not received the financial services (i.e. the counterfactual) to compare with the outcome observed with finance. Since the counterfactual can never be directly observed, using an appropriate method to estimate it is critical for correctly measuring the impact “caused” by the financial services. Treatment groupThis is the group of selected MFI clients studied to estimate the impact or benefit received because of financial services. They must be selected as representative of the clients for whom the results are to be generalized.
5
A nontechnical treatment of many of these issues can be found in Ravallion (2001). One of the most rigorous studies of the poverty levels of clients in MFI loan portfolios was done by Navajas et al. (2000).
6
7
•
•
•
•
Control and comparison groupsThe counterfactual can be approximated by using control or comparison groups that did not receive the financial services. Control groups are selected at random from the same population as the MFI clients and are used in experimental research designs. In nonexperimental designs, comparison groups consisting of non-MFI clients are chosen to compare with the treatment group. These groups must be as similar as possible to MFI clients in all attributes, including their level of poverty, except for the fact they did not receive MFI services. Meeting this standard is difficult under any circumstance, but especially so in places such as Bangladesh where MFI coverage is intensive, making it difficult to identify potential control villages and persons not directly or indirectly affected by microfinance. An additional value of analyzing the control and comparison groups over time is that it may be possible to detect if “displacement” has occurred in economic activities. For example, MFI clients may use loans to expand their businesses and crowd out members of the control groups who are negatively affected because of the microfinance program. The losses realized by nonclients must be subtracted from the benefits realized by clients to estimate the “net benefits” of microfinance. Current versus past clientsMost analysts create treatment groups by sampling current MFI clients, excluding those who are no longer active. But MFI benefits may be underestimated if the inactive group includes many very successful “graduates.” In practice, however, it is difficult for even the most successful clients to graduate to commercial sources of finance, and the additional profits earned from borrowing during only a few loan cycles are unlikely to enable borrowers to self-finance their activities. Therefore, it is likely that the largest share of inactives will be “dropouts” who have withdrawn or were pushed out of MFI membership. Some may have suffered setbacks so they could not repay or faced enough difficulty in doing so that they refused to take another loan. Others may have been forced out by their peers or loan officers. The results obtained from studying only active clients will overestimate the true impact of microfinance if dropouts are mostly “failures” and represent a significant number of clients. AttritionSome study designs require interviewing treatment and control groups several times over a year or several years. Attrition occurs when persons or households disappear through migration and death, and when some refuse to continue furnishing data. Households grow in size through births and marriage, while others shrink. Households that are lost or experience major changes need to be analyzed to determine if they are systematically different so their inclusion or exclusion in the analysis will bias the results. Differential impact by poverty levelThe extent to which microfinance produces benefits is influenced by the degree to which finance is a constraint for clients at different levels of poverty. There may be significant “interaction” between finance and poverty where wealthier clients may realize greater benefits than very poor ones. When MFIs serve a wide range of clients, the impact study should contain a sufficient number of clients at different levels of poverty so analysis can determine if there is differential impact by client poverty.
8
•
•
•
•
Causality and attributionIf treatment and control groups truly differ only because one received the treatment (i.e. the financial services) and the other did not, then any differences found in the impact measures between the two groups can be “attributed” to the financial services; it can be argued that financial services “caused” the difference. The amount of impact is represented by the magnitude of the differences. However if there are other differences between the two groups, it is impossible to determine if positive differences were truly caused by finance, by initial unobserved differences between the two groups, or by unobserved events that affected the treatment but not the control group. Likewise, if no differences are found or if negative impacts seem to exist, there is no way of determining if finance really made no impact or if its positive effects were overwhelmed by other factors producing negative impacts. Fungibility and additionalityMoney is fungible so loan funds can be used for various purposes. This quality makes finance valuable and efforts to constrain the use of loan funds make them less valuable. Fungibility makes it difficult to determine how loan funds were actually used and what benefits were realized. For example, a MFI client may plan to expand her business through existing resources including personal savings, supplier’s credits, or informal loans. If the MFI supplies a loan, the borrowed funds may “substitute” for these other resources that can then be used for other purposes, perhaps increasing consumption or sending a child to school. Therefore, the “additionality” that occurred because of the loan was not business expansion, which she already planned, but what she actually did with the resources released. Likewise, funds supposedly borrowed for some purpose, such as business expansion, may be “diverted” to another use, perhaps paying for an unexpected medical expense. It is difficult to estimate the additionality caused by a fungible resource like MFI loans without collecting tremendous amounts of data from both treatment and control groups on resources received and allocated. Control variablesFactors other than microfinance, such as macroeconomic shocks, education, and participation in other poverty programs, influence changes in household poverty. Information on these factors needs to be collected and “controlled for” in both the treatment and control groups so that the only difference between the two groups is access to microfinance. Selection biasTwo especially important biases have to be anticipated in designing impact studies. First, selection of clients is not likely to be completely random. The treatment group of MFI clients will likely possess characteristics that are systematically different from a randomly selected control group. For example, the first clients to enter a new microfinance program may be more entrepreneurial or willing to take risks than the general population. Moreover, if clients are required to form peer groups and exert peer pressure on fellow members who fall into arrears, they will choose group members thought to earn income and manage money so loan payments will be made on a timely basis. Likewise, loan officers will likely select those persons least likely to cause collection problems if they influence the decisions about who should join groups and receive loans. If these differences between clients and nonclients can be observed and measured, they can be controlled for statistically. If not, the impact results will be biased, as the same unobservable characteristics that lead the poor 9
•
•
to become clients will also affect the impact measures. Second, program placement may not be random. MFIs may choose to start operations in areas/villages with better communication and transportation infrastructure than found in randomly chosen villages. Therefore, the poor are likely to receive microfinance if they live in a richer than in a poorer area. With these two types of selection biases, it is difficult to determine if differences between treatment and control groups are actually due to the financial services or to unrepresentative clients and/or locations. Identifying and measuring the treatmentMFIs differ in their services. Some are minimalist and only supply loans with limited orientation to borrowers on matters such as disbursement and repayment procedures. Others provide obligatory or voluntary savings services. Still others provide training in nutrition or business planning. Some lend for any purpose while others attempt to direct loans to “productive” purposes. Therefore, clients receive different “treatments” including different loan sizes with different terms from the same MFI and different combinations of services by one or more household members simultaneously participating in two or more MFIs. Treatment must be measured in some way. Most studies simply look at loans. Sometimes treatment is crudely measured as participation in the loan program, while other studies attempt to capture intensity of participation by measuring the amount of loans and other services each client receives and the time period they were received. Usually no attempt is made to disentangle the impact of receiving a loan versus simply participating in a group, or receiving training as either an obligatory or voluntary component of the MFI’s lending program. When several types of MFIs are analyzed without differentiating their services, the benefits generated by those producing the greatest impact will be masked by others producing fewer benefits. Unit of assessmentFinancial services are normally provided to clients as individuals, but entire households may realize benefits. Therefore, data need to be collected on all household members for both treatment and control groups to evaluate who benefits and by how much. This becomes difficult in studies designed to collect household data in repeated interviews because household composition changes whenever someone marries, dies or migrates. In group lending programs, data may also need to be collected at the level of the groups to test the impact of group dynamics separate from the impact of finance. Data may need to be collected on enterprises to determine if enterprise-specific changes can be attributed to households that receive financial services. Some studies attempt to evaluate changes beyond households in financial markets and/or communities. For example, data need to be collected on informal lending to determine if the expansion of microfinance contributed to changes in terms and conditions of moneylender loans.7
7
The USAID project entitled AIMS (Assessing the Impact of Microenterprise Services) emphasized possible project impacts at several levels in its field studies beginning at the individual up through the community.
10
•
•
•
Measurement errors and baseline dataAll analyses must anticipate errors in the measurement of variables or in responses provided by persons interviewed. A frequent problem is that an assessment is conducted after a MFI has been operating for some time and no baseline data were collected at the beginning for the treatment or control groups. If a “before and after” analysis is to be undertaken, members of the treatment and control groups must “recall” their situation prior to the time that the financial services began. The interval could be several years. The resulting measurement errors introduce unknown biases that may overestimate or underestimate the true impact of finance. It is logical to expect that the treatment group will perceive that analysts will desire large benefits so they will exaggerate the data they report. Collecting and analyzing the dataIndependent analysts are responsible for collecting and analyzing the data used in most sophisticated and complex impact studies. They presumably have greater objectivity but face the challenge of obtaining correct data from members of treatment and control groups who do not know them. Some studies reduce costs by using MFI staff to collect and analyze data. Apart from the problem of having little time to do this, there is a potential for distortions because the staff have a vested interest in reporting favorable impacts. Their clients may also want to please them by giving “desired” responses that skew the results. Statistical analysisMany impact studies report the average or mean differences calculated for the variables or indicators measured for the treatment and control groups. However, if no statistical tests are reported, there is no way of knowing if differences that appear large between the two groups are “not significant” because of the large variability recorded among the observations in the two groups. Econometric analysis is frequently used that requires specialized knowledge and skills usually superior to most persons who undertake microfinance impact assessment.
2.4.3. Qualitative Studies of Impact The problems discussed above can be minimized or largely resolved if sufficient time, talent and resources are devoted to carefully undertake quantitative impact assessments. However, the magnitude and scope of these problems, the complexity of the solutions, and the costs and long time periods involved in conducting robust quantitative assessments have prompted two responses. On the one hand, some have argued that only a few carefully designed and well-funded quantitative studies should be conducted to statistically test for the benefits expected from microfinance. On the other hand, many analysts advocate using simpler and cheaper qualitative studies involving small samples, case studies, rapid appraisal and client participation to produce “plausible” results more quickly, to give more guidance to MFIs for product development and institutional improvement, and to facilitate greater client involvement in the assessment process. Qualitative approaches may produce information at a sufficient level of reliability to justify their use in some applications. Moreover, good qualitative studies may produce results superior than quantitative studies done poorly. But qualitative analyses can also be done poorly and the validity and reliability of the results depend 11
critically on the skills, sensitivity and training of the evaluators. A strong case can be made for a combination of approaches to effectively capture the true impact of microfinance, while at the same time providing MFIs with maximum guidance about product and institutional changes needed to produce greater benefits. 3. MFI Performance in Asia 3.1. Outreach The largest MFIs in the world are found in Asia, and many serve huge numbers of clients.8 Some countries have made major efforts to develop microfinance and the results are impressive in terms of total outreach, women clients, and size of portfolio. For example, in 2000 the BRI unit desas in Indonesia had about 2.7 million borrowers with over $800 million in outstanding loans. They also reported over 25 million savers, and this relationship of almost ten savers per borrower is evidence of the potential demand by the poor for safe savings services (Robinson, 2002). Bangladesh is another leading microfinance country and has the most complete MFI data. At the end of 2000, the Grameen Bank reported 2.4 million members, 95 percent of which were women, with $225 million in outstanding loans. In addition, some 1000 other MFIs were operating in the country, of which 585 reported almost 8 million borrowers with over $390 million in outstanding loans. The country’s commercial banks reported microcredit disbursements during 2000 of $65 million and various government departments reported $55 million in disbursements. Typically 80 percent or more of MFI clients are women. Today, the industry must reach close to 40 percent of the households in the country, probably the greatest penetration rate of any country in the world. Savings mobilization has been relatively weak by comparison as it has not been stressed by the MFIs, and the government has threatened to enforce regulations that permit only regulated financial institutions to accept savings from nonmembers. As a result, much of the MFI capital comes from donors and the second tier institution, PKSFPalli Karma-Sahayak Foundation (Credit and Development Forum, 2001). Thailand has achieved impressive outreach in agricultural lending through BAAC, the Bank for Agriculture and Agricultural Cooperatives. Some 4.7 million of the country’s five million plus farm households are registered to receive its services and as many as 70-80 percent borrow in a given year, either directly or indirectly through cooperatives that BAAC finances. As a result, there are relatively few NGOs and other institutions providing microfinance. Wealthier farmers borrow individual loans, while poorer farmers borrow directly from BAAC through joint liability groups or indirectly through farmer cooperatives and associations. In 1997 it had about $7 billion in loans outstanding and was the seventh largest bank in the country. But its savings
8
The world of microfinance consists of a large number of small institutions and a few exceptionally large ones. Lapenu and Zeller (2001) conducted a worldwide survey of MFIs concentrating on those supported by international agencies. Of the 633 that reported numbers of members served, 19 institutions with more than 300,000 members each represented only 3 percent of the total but reached 81 percent of the total number of members served. They note that the giants of the industry are found in Asia.
12
mobilization performance has lagged so that savings deposits totaled only $2.6 billion (Meyer and Nagarajan, 2000). The government’s major effort in India is to develop self-help groups and link them to the country’s vast banking network. The National Bank for Agricultural and Rural Development (NABARD) has set a target of reaching a million groups covering 100 million rural poor by 2008. As of March 31, 2001, it reported over 260,000 SHGs involving over four million poor families had been linked to banks. Over 70 percent were concentrated in five of the wealthier states in the south and over 85 percent of the groups were composed of women. Some 750 NGOs and 14,000 branches of 318 banks were associated with the program. Banks serving some 213,000 SHGs had received refinancing from NABARD in a cumulative amount of $100 million. Several MFIs operate in the country, but none has yet reached the scale of MFIs in neighboring Bangladesh (Meyer, 2003). An example of a lesser-known MFI is ACLEDA Bank Limited in Cambodia. It was established as a national NGO in 1993 and was transformed into a bank in October 2000. At the end of March 2001, it had about 66,000 clients, nearly 80 percent were women, with an outstanding loan portfolio of almost $20 million, which represented about a 50 percent market share of MFIs in the country. Average loan size was approximately $296 compared to average GNP per capita of about $350. It is in the process of developing savings and money transfer services.9 Additional information on outreach can be obtained from the data that 29 Asian MFIs regularly supply to the MicroBanking Bulletin. It is summarized and presented in the form of average values for selected variables for peer groups of MFIs. Table 1 reports several variables of interest and Table 2 lists the MFIs included in the four Asian groups. Two comparison groups are also presented. The first group reports the averages for all 148 MFIs that supply data and the second is a subset of 57 of the 148 MFIs that are financially self-sufficient after all resources used have been valued at approximate market levels. To reduce distortions in the averages for the Asian groups, the values for the largest and smallest observations for each variable were deleted before the averages were calculated. These data cannot be interpreted as representative of the entire industry because it is widely believed that only the strongest MFIs choose to supply data to the Bulletin. The data show that the Asia Large and Pacific groups serve many more clients than the average MFI and those in the other two Asian groups. All four Asian groups have a larger proportion of women borrowers than the two comparison groups, especially in Asia South. Little detailed information is available about the distribution of clients in terms of depth of poverty. In spite of its obvious limitations, the best proxy indicator routinely reported is the ratio of average outstanding loan size to per capita GNP of the country. It is assumed that the lower the ratio the poorer must be the clients served. The averages for all four of the Asian groups are favorable relative to the two comparison groups, but the results are not statistically significant. The 57 MFIs in the FSS group appear to be reaching fewer poor because the average of 76.3 is significantly different from the average for all MFIs. These data show that many of the 29 Asian MFIs have grown to great size and serve thousands of clients, the majority of which are women. They seem to be reaching 9
Reported in http://www.bellanet.org/partners/mfn/acleda.htm on Feb. 12, 2002.
13
a depth of poverty of their clients that is as good as the average MFI and better than the FSS group. No information is available to show the extent to which the Asian MFIs have moved beyond simply providing loans, but the individual cases discussed above suggest that BRI in Indonesia is unusual in emphasizing voluntary savings mobilization. Supplying other services such as insurance and money transfer is still in its infancy in the region. Borrowers, therefore, have been and continue to be the primary concern of policy makers in Asia. 3.2. MFI Sustainability 3.2.1. Evidence from Microbanking Bulletin Data supplied to the Bulletin are useful in gauging MFI financial performance and factors that influence it. Rows four and five in Table 1 report data on the operational and financial self-sufficiency ratios for the comparison groups and the Asian peer groups. Three of the four Asian groups on average cover their operating costs as shown by average ratios exceeding 100 percent. The exception is the Asia South group that covers only about 80 percent of its operating costs, which is significantly lower than all MFIs. Likewise, the Asia Large and Pacific groups cover financial as well as operational costs as shown by financial self-sufficiency ratios above 100 percent. The Asia Central group almost reaches that standard but the Asia South MFIs lag by covering only three-fourths of total costs. Many factors determine operational and financial self-sufficiency, but three variables reported in Table 1 provide insights into the reasons for differences among the four groups. The Asia Pacific and Central groups lag behind the other Asian groups and the comparison groups in lending efficiency as measured by the number of active borrowers per loan officer, but the differences are not significant.10 Administrative expenses as a percent of average total assets are widely different. The Asia Central group has exceptionally high expenses of 33 percent, while the Asia Large and South groups are exceptionally low at 6 to 10 percent. Three of the four Asian groups are quite efficient on average compared to the industry. A problem for the Asia South group is that its portfolio yield is the lowest at 21.8 percent, so one reason for not reaching self-sufficiency is that the interest rates charged are not as high as the others. This group relies heavily on subsidies, which retards full commercialization of microfinance. The Asia Central group, however, earns a high portfolio yield of 68.1 percent, which compensates for the group’s higher administrative costs. The conclusion is that on average, the 29 Asian MFIs are fairly efficient and the 10 in Asia South could become self-sufficient at current levels of efficiency if they would raise interest rates to levels closer to the rest of the industry.
10
In their comparative analysis, Lapenu and Zeller (2001) found that staff productivity in Asian MFIs measured in both number and volume of loans was lower than in their Latin American and African counterparts. The difference in these two sets of results may be due to the fact that the MFIs reporting to the Bulletin are thought to be among the best in the world, while the Lapenu and Zeller database was broader and probably included MFIs representing a wider range in performance.
14
Table 1. Average Results for Asian Peer Groups Compared to All and Financially Sustainable MFIs
Indicator Number of borrowers with loans outstanding Percent of active borrowers that are women Average loan balance as percent of GNP per capita Operational selfsufficiency ratio Financial selfsufficiency ratio Nominal portfolio yield in percentb Administrative expenses as percent of average total assets Active borrowers per loan officer
All MFIs (148)a 10,710
Asia Large (5)
FSS (57)
89,370 2,278,992*
Asia Pacific (9)
Asia South (10)
Asia Central (5)
9,266
24,499*
5,103
62.2
54.4
64.8
77.0
86.1*
85.3
46.0
76.3*
35.8
40.7
25.2
18.2
101.6
134.8*
117.5
116.0
81.5*
115.1
89.8
121.5*
111.1
110.3*
76.0
98.6
38.1
41.4
23.3
44.0
21.8*
68.1*
19.8
16.9
6.4
21.4
10.3*
33.3*
279
334
339
171
364
143
a. Numbers in ( ) refer to the total number of MFIs in that category. b. Operating income less investment income divided by average loan portfolio. *
Indicates that the average is statistically different from the average for all MFIs at the 1% level.
Source: MicroBanking Bulletin, Issue No. 7, November 2001.
15
Table 2. List of MFIs included in the Asian Peer Groups Peer Group
Asia Large
Country Bangladesh Cambodia Indonesia Thailand
Asia Pacific Cambodia Indonesia
Philippines
Asia South
Bangladesh India
ASA – Association for Social Advancement BRAC – Bangladesh Rural Advancement Committee ACLEDA – Assoc. of Cambodian Local Econ. Dev. Agencies BRI – Bank Rakyat Indonesia, Unit Desa System BAAC – Bank for Agriculture and Agricultural Cooperatives EMT – Ennathian Moulethan Tchonnebat Hattha – Hattha Kakesekar BRP-A – Pt bank Perkreditan Rakyat - A BRP-B – Pt bank Perkreditan Rakyat - B BRP-C – Pt bank Perkreditan Rakyat - C BRP-D – Pt bank Perkreditan Rakyat - D CARD – Center for Agriculture and Rural Development RSPI – Rangtay Sa Pagrangay Inc. TSPI – TSPI Development Corporation
Sri Lanka
BT – BURO, Tangail BASIX – Bharatiya Samruddhi Finance Ltd. FWWB – Friends of WWB GV – Grama Vidiyal SHARE – Society for Helping Awakening Rural Poor through Education Swayam – Swayam Krushi Cooperative Society NIRDHAN – Nirdhan Utthan AKRSP – Aga Khan Rural Support Programme KASHF – Kash Foundation SEEDS – Sarvodaya Econ. Enterprises Dev. Society
Azerbaijan
FINCA AZ
Georgia Kazakstan Kyrgyz Rep. Mongolia
CONSTANTA KCLF – Kazakstan Community Loan Fund FINCA KY XAC – Golden Fund for Development
Nepal Pakistan
Asia Central
MFI
16
3.2.2. Evidence from M-CRIL Additional evidence on the financial situation of Asian MFIs is found in the summary report of the rating agency M-CRIL (M-CRIL, 2001). It rated 53 Asian MFIs, of which 44 were in India, four in Nepal, and three in Bangladesh. They had been operating for an average of 5.9 years and employed different lending methodologies with the largest number, 31, using self-help groups (SHGs). Ten employed the Grameen model and ten used individual lending. Total outreach and coverage was almost 700,000 persons of which the SHGs served about 50 percent. About 300,000 were borrowers, but the total volume of lending was only about US$23.5 million, much smaller than just one of the large MFIs in Bangladesh. Savings mobilization, including amounts generated by SHGs but not deposited with financial institutions, totaled only US$12.3 million, in spite of the supposed emphasis on savings and self-help. The total savings represented only 34 percent of the amount lent to clients reflecting great dependency on non-member funds for lending. SHG programs had low levels of productivity as they averaged only 50 clients per staff member compared to 94 clients for Grameen programs and over 100 for the individual lenders. This was due to the heavy staff input required during the start-up phase and the social rather than business orientation of many SHGs in India. The sample average of 15 percent portfolio at risk (defined as 60 days overdue) is high, and the SHGs averaged a much larger 29 percent of portfolio at risk. The average operating cost ratio of 23 percent exceeded the average portfolio yield of 17 percent so most of these MFIs were unable to cover costs without subsidies. The average return on assets of negative 4.8 percent shows how far they are from commercial viability. The report concluded that microfinance in South Asia has a long way to go before it can achieve commercial viability and become a dynamic and sustainable component of the region’s poverty reduction efforts. 3.2.3. The Subsidy Dependence Index Another way of measuring the financial self-sufficiency of financial institutions is by calculating the Subsidy Dependence Index (Yaron, 1992). It is an accounting technique used to calculate the ratio between the value of the subsidies received by a financial institution and the revenue received from loans. The SDI is the percentage change in the yield on loans required to make the subsidy zero. For example, a SDI of 0.40 means that in increase in yield of 40 percent would be required to wipe out the subsidy. The SDI has been calculated for three major Asian MFIs. The BRI unit desas were so profitable in 1996 that the SDI was actually negative. The yield on loan portfolio could be reduced from 31.6 to 16.3 percent and they still could have remained subsidy independent (Charitoneko, Patten, and Yaron, 1998). The SDI for BAAC in Thailand in 1995 was 35.4 percent indicating that it would have had to increase its portfolio yield from 11.0 to 14.89 to be free of subsidies in that year (Muraki, Webster, and Yaron, 1998). The third MFI was the Grameen Bank. In the 1985-1996 period, Grameen would have had to increase its nominal interest rates on general loans from 20 to 33 percent to become free of subsidies (Morduch, 1999a). 17
3.3. Impact of Microfinance The results of four microfinance impact studies conducted for the region are summarized in this section. They were chosen because the authors clearly recognized many of the methodological problems identified above and attempted to resolve them by careful design and analysis. The results, therefore, are considered to be far more robust than others found in the region. They provide the best evidence available on which to form an opinion about the impact of microfinance in Asia. 3.3.1. World Bank Study in Bangladesh The World Bank conducted one of the most ambitious studies for the region in Bangladesh. The results were summarized by Khandker (1998). The data used were collected from 29 thanas (districts), 87 villages and 1,798 households randomly selected. Of the households selected, 1,538 were target and 260 were nontarget. The households were surveyed three times during the 1991/92 farming year, which marked the beginning of the great expansion of microfinance in the country. Anthropometric data were collected from 315 of the sampled households for a nutrition study. Three microcredit programs were studied; their approaches at the time were similar with important differences. The first was the Grameen Bank (GB) that argued that lack of credit was the greatest constraint for the poor so it provided loans with only limited skills training. The second was the Bangladesh Rural Advancement Committee (BRAC), a huge NGO that combined lending with training. Its borrowers typically received more hours of skills-based training than GB borrowers. The third was the Rural Development Project -12 (RD-12) of the Bangladesh Rural Development Board, a semiautonomous government agency charged with developing cooperatives for rural development. For RD-12, the Board adopted the skills-based training approach of BRAC in addition to lending. Loans made by these three organizations were made to individuals through joint-liability solidarity groups of typically five members. The groups were organized into five to eight group centers in GB, into BRAC village organizations of 30-40 members, and into 15-35 member primary cooperatives in RD-12. Borrowers attended weekly meetings, made weekly loan payments and savings deposits, contributed to a nonrefundable group fund, and paid nominal amounts for group insurance or cooperative shares. The maximum loan size was Tk. 10,000, and the repayment schedules required 50 weekly principal installments with interest paid at the end. Nominal interest rates for production loans were 20 percent for GB and BRAC and 16 percent for RD-12. Members were instructed in a code of conduct established for each program that encouraged thrift, discipline, good health and nutrition, and socially desirable behavior. They emphasized membership for women and all borrowing groups are single sex. The three organizations targeted the poor defined as persons holding less than half an acre of land. In addition, BRAC and RD-12 required that at least one household member work for wages. The survey was designed to include eligible (target) and ineligible (nontarget) households. The analysis measured the differences between eligible and ineligible households in program and nonprogram villages. After controlling for other factors, any differences found in these comparisons were attributed 18
to participation in one of the programs.11 Participation was measured as the deflated cumulative amount of borrowing over the five-year period before the survey was conducted. Impact was expected to vary because loan sizes and program durations varied, because the programs provided different mixes of services to members, and because the gender of members varied. Selected key results are summarized here. Borrowing by men and women had an expected positive impact on household per capita weekly expenditures, but while the impacts were significant for women’s borrowing in all three programs, they were significant for men’s borrowing only for RD-12. The increase in consumption by women was roughly the same for all three programs but the impacts were about twice as great as for men. However, borrowing by women produced either no or a much smaller positive effect on household net worth than borrowing by men, except that women’s nonland assets rose with borrowing. These findings are consistent with the view that women allocate resources differently than men. Because of their family responsibilities, women may prefer to meet immediate welfare needs of the family while men may prefer to accumulate assets for longer-term gains. When women invest, they may prefer assets used in the home and in-home enterprises rather than land.12 Micro loans are expected to facilitate self-employment, particularly for women at home, so they may increase time allocated to income-earning activities because of borrowing. The results showed that women’s borrowing increased their labor supply and the effects were slightly higher for GB than the other two programs, but both men’s and women’s borrowing reduced men’s labor supply. Since men had access to wage labor prior to program participation, perhaps increased income associated with borrowing induced men to choose more leisure. Borrowing affected children’s schooling but the impacts varied by gender of borrower, by child and by program. For example, for GB and RD-12, female borrowing seemed to benefit boys’ school enrollment more than girls. Boys’ time is less likely to substitute for women’s and girls’ time so they are less likely to get drawn into selfemployment activities. Women’s borrowing was also more likely to make a significant impact on the nutritional well-being of both male and female children, a finding consistent with consumption expenditures discussed above. The seasonality of the crop cycle is a major source of seasonality of labor use and income flows so microfinance can assist households to diversify into nonagricultural activities to smooth consumption. No differences were found among the three programs in their effect on seasonality of consumption or labor supply. Households with larger than average seasonal variation in consumption were most likely to participate. Men and women both borrowed more from the credit program during the peak season and reduced their market labor supply. 11
Morduch (1999) subsequently criticized this approach on the grounds that the programs did not strictly enforce the eligibility criteria so that as many as 30 percent of the participants had more than the wealth level specified. He used the same survey data to re-estimate the results using a different econometric approach, and came up with conclusions different from those published by the original authors in Pitt and Khandker (1998). However, to my knowledge the Morduch paper has not gone through peer review nor has it been published so I choose to present the original results here. Moreover, Pitt and Khandker have written a lengthy reply explaining why they think their approach is superior to that of Morduch. 12 Todd (1996) analyzed women who had been long-term clients of GB and found that several used their loans and savings to acquire land as security for their old age.
19
Several potential impacts were analyzed beyond the household level because of the possible spillover effects of microfinance into nonparticipating households in program villages. Production and income in program villages was more than twice that in nonprogram villages and higher nonfarm production and income was an important source of the difference. The number of hours worked was also higher in program villages. Participation in both GB and BRAC tended to increase nonfarm income, while RD-12 increased farm income. The presence of traditional banks also increased total household income largely through farm income. None of the programs made an important impact on village level socioeconomic indicators. Finally, the analysts made estimates of program impact on poverty alleviation. The moderate poverty level was established at Tk. 5,270 per person per year. Actual per person expenditures of participating households amounted to Tk. 4,004. Average cumulative borrowing for all three programs was Tk. 5,499 for women and Tk. 3,692 for men. By estimating consumption before participation and using the observed relationship between borrowing and consumption, it was concluded that five percent of the participant households rose above poverty each year. 3.3.2. Studies of Village Banking in Thailand The village banking microfinance methodology involves developing member-owned mini-banks in villages. Two studies of village banking programs have been conducted in Thailand. Coleman reported on his impact study of village banks in Northeast Thailand conducted in 1995-96 (Coleman, 1999). Since BAAC has a high degree of penetration in rural areas, there may be fewer capital-constrained households to be served by specialized MFIs than is the case in Bangladesh. In the 14 villages surveyed, 63 percent of the households were BAAC members. BAAC emphasizes men and it permits only one loan per household so only 19 percent of the surveyed households included women with direct access to BAAC credit. The objective of the Coleman study was to assess the impact of two NGOs promoting a village banking model in which women villagers were organized into peer groups of 20-60 members. Members were selected to serve on committees that managed the banks. Loans were granted to individual members, but group members coguarantee each other’s loans. The first loan was the same amount for all members (about $60) usually for a term of six months. For each subsequent loan, the member could borrow an amount equal to her previous loan plus her accumulated savings in the village bank, up to a fixed maximum of about $300. In comparison, the average size BAAC loan in the survey region was over $600. The BAAC interest rates varied from 3 to 12 percent while the village banks charged 24 percent per year. Initially, loans are made with funds provided by the NGOs and are referred to as external account loans. In addition the village banks make internal account loans out of the savings mobilized. It is expected that the banks will mobilize enough funds to self-finance all loans and eventually repay the NGO. The NGOs reduced loan sizes after the first few loans in order to “wean” the villages from external loans. Of the 14 villages selected, six were treated as control villages as they had not benefited from a village bank. The control villages were identified by the NGOs as locations that would begin receiving village bank loans in 1996. The NGOs organized the villages and allowed the villagers to self-select into the bank following standard 20
procedures, except that they would not receive loans for one year. Four treatment villages were randomly selected from the list of villages served by each of the NGOs. To ensure greater comparability with control villages, some village banks were eliminated because they were located in villages too large or in too favorable locations or had been operating for too many years. A stratified random sample of households was selected. In the treatment villages, 25 village bank members and 19 nonmembers were randomly selected, while in the control villages 25 members and 13 nonmembers were selected. Of these households, 445 completed all four surveys conducted over the course of the year. With this design, the “old” members of the treatment villages are compared with the “new” members in the control villages. Participation was defined as months of village bank membership. A model was estimated to first explain level of member borrowing and it was found that loan size did not significantly increase with months of membership for three reasons. First, there was the weaning effect. Second, some members borrowed less than the maximum and, third, some women used the bank largely for savings rather than for borrowing. Borrowing increased with women’s education level, with number of relatives in the village, with the village chief or assistant chief being in the household, and with the value of female-owned land. The impact results showed that months of village bank membership had no significant impact on household physical assets, production, sales, expenses, labor time, or expenditures on health care and education. Paradoxically, village bank membership appeared to increase the women’s high-interest debt and lending out at positive interest. The author explained these results by noting that several women reportedly fell into a vicious circle of debt in which they borrowed from moneylenders at three percent per day to repay their village bank loans, then used their subsequent village bank loans to repay moneylenders leaving little to invest. Many women reported joining the bank largely for social reasons without having any specific investment plan. Still others borrowed from the bank at relatively low rates and lent out money at higher rates. There was no evidence that the village bank loans were being directly invested in productive activities with a positive return. Coleman argued that the lack of impact could be due to relatively small loan sizes. The average household wealth was about $21,000, and average low-interest household debt was about $1,250 of which women held $370. Therefore, village bank loans of $60-300 added relatively few additional resources to the households for productive activities. These small loans may have been used largely for consumption smoothing in many households rather than for investment. The author subsequently refined the study to test for impact on subgroups of borrowers (Coleman, October, 2001). He found that the probability of wealthier households self-selecting into the village bank was nearly twice that of poor villagers. Some borrowers used multiple names, such as family members living outside the village, to obtain larger loans. These persons tended to be influential committee members, who were wealthier, set policy, and managed daily operations. Households reported that 35 percent of the loan volume was borrowed by someone other than the persons listed in the bank records. Committee members were found to borrow significantly more than other members from both the external and internal accounts.
21
The impact model was retested to separate committee members from “rank and file members.” The results continued to be insignificant for number of months of membership by the rank and file. But months of committee member membership were significant and positive for household wealth, savings, low-interest debt, household moneylending, women’s self-employment sales, expenses and labor time, and educational expenses for boys in the household. Committee members may have been able to invest in larger, more capital-intensive projects by borrowing more from both the village banks and other low-interest sources. If the constraints on loan size were relaxed, the temptation for manipulation by committee members might be reduced, but empowerment of poor people through local institutions like village banks is likely to be frustrated when they are dominated by wealthier people for their own self-interest. The second village banking study was conducted in 1993 also in Northeast Thailand (MkNelly, et al., 1996). It evaluated the Freedom from Hunger credit with education program operated through village banks. The program began in Thailand in 1989 and by 1993 had grown to 26 credit associations or village banks, each with about 40 women, totaling 1,022 members of whom 586 were borrowers. The program attempted to build self-help capacity by providing women with credit, savings opportunities, and nonformal health and nutrition education. The first and maximum loan sizes were approximately the same size as in the village banks studied by Coleman, but the groups met monthly rather than weekly, interest was paid in five equal monthly installments, and the principal was paid in a balloon payment at the last meeting of the six-month loan cycle. These adaptations were made to accommodate the agricultural and livestock raising activities for which most members desired loans. A total of 68 members from 11 program villages were selected to be interviewed by program staff along with 60 nonparticipants selected at random in 5 nonparticipating villages. Participants were selected from village banks that were at least one year old, had taken at least one loan in the year, and had at least one preschool child participating in the government’s growth monitoring sessions. About 23 percent of the borrowers in 11 villages met these criteria and they had borrowed an average of about $150 in external loans. Almost 40 percent had also borrowed internal loans in an average amount of $30. The most important uses of the funds were reported to be animal husbandry and agricultural production, followed by small-scale trading and consumption. No attempt was made to measure impact on members who did not borrow or failed to meet the selection criteria in other ways. The control villages were matched by proximity and size. No test was made for possible placement bias, but no significant differences were found in demographic and socioeconomic characteristics between participants and nonparticipants. Over 80 percent of both groups farmed their own land, and the monetary value of their assets was similar. The nonparticipants were slightly better off in number of large animals owned, but the participants owned more pigs and poultry, perhaps because many loans were reported for animal raising. No specific eligibility criteria were required for participation by villagers. Village leaders in the smaller villages conducted wealth ranking of participants and the village population. The results showed that participants were drawn from all wealth levels, except there were proportionately fewer from the
22
wealthiest and poorest groups in the village population. The wealthiest may have better opportunities while the poorest may be too risk averse to participate.13 Comparisons between the participant and control groups revealed that the participants were more involved in economic activities by investing funds in agriculture and earning income from animal raising and microenterprises. They also had more savings and liked the program’s saving component. The health education provided by the program staff led to a higher proportion of participants using preferred practices for diarrhea treatment and prevention, breastfeeding and infant feeding. Participants spent more money on food and family nutrition was better than nonparticipants. The program apparently changed attitudes as participants reported to be more hopeful about the future, more self-confident, and more cooperative with others in the village. The results of this study were consistent with the positive benefits expected from credit with education, at least for women village bank participants with preschool children. Unfortunately, no statistical tests were reported so there is no way of knowing if the differences reported between participants and nonparticipants were large enough to be significant. There is potential measurement bias because the field staff that did the interviewing were also responsible for operating the program. No implications can be derived from the study about benefits for those participants who did not meet the selection criteria required to be included in the analysis. 3.3.3. AIMS study of SEWA Bank in India The U.S. Agency for International Development (AID) supported the research project Assessing the Impact of Microenterprise Services (AIMS)14 that recently studied the impact of SEWA Bank in India (Chen and Snodgrass, 2001). It attempted to measure the impact of the credit and savings programs of SEWA Bank clients in Ahmedabad in the state of Gujarat. The Bank was established in 1974 as part of the activities of the Self-Employed Women’s Association (SEWA), a trade union dedicated to advancing the interests of low-income women working in the informal sector. The Bank has been financially self-sufficient and received its first outside capital in 1999 when it borrowed from the Indian government to make housing loans. The Bank stresses savings mobilization and as of March 31, 1999 deposits totaled $4.4 million from almost 120,000 depositors. Four types of savings deposits are offered: interest free current accounts that allow clients to deposit and withdraw at any time, savings accounts with limited withdrawals that earn 4.5 percent annual interest, fixed term accounts with penalties for early withdrawal with interest rates varying from 6 to 13 percent depending on term, and recurring accounts that require deposits at established intervals with rates varying from 7 to 13 percent. The Reserve Bank of India determined the interest rates for both deposits and loans. The Bank offers three types of individual loan products. Unsecured loans require one or more guarantors depending on loan size. Secured loans are granted in the maximum amount of 65 percent of the value of gold jewelry or 80-85 percent of the 13
In personal communication the authors reported that people in the poorest households often left in the dry season to find work in urban areas. This meant they could not attend regular meetings and were not as attractive as group members because of the threat they might not return. 14 The research strategy employed in the AIMS assessments is described by Dunn (2002).
23
value of fixed deposits provided as collateral. Both types are made for three-year terms with a maximum ceiling of 25,000 rupees ($538) and interest of 17 percent. Loan payments, until recent revisions, were calculated on the basis of 20 installments payable over 36 months. Five-year housing loans were offered beginning in 1999 after receipt of the government loan. They are payable in 60 monthly installments at the interest rate of 14.5 percent. If a borrower’s credit rating is good, she can apply for a new loan double the size of the previous loan. A woman can have only one unsecured loan at a time, but may have an unsecured and a secured loan simultaneously. The Bank strives to build or rebuild borrow assets so loans are made for working capital, asset purchase, home repair, housing, and repayment of old debts for mortgaged assets. Most borrowers are SEWA members, above 18 years of age and, prior to obtaining an unsecured loan, must have been a member with a saving account for at least six months, and have saved regularly. Local organizers of the SEWA Union must verify the applicant’s creditworthiness and her economic activity. SEWA Union established life, health, and property insurance with two insurance companies in 1992. In 1996, insurance was made compulsory for all who borrowed 5,000 rupees or more. Total policyholders reached 32,000 in 1999. The premiums can be paid in annual installments, or through interest earned in a fixed deposit. The objective of the study was to test the impact of being SEWA borrowers and savers compared to a nonclient control group. The survey target was 300 interviews for each of the three categories. Ten out of 43 of the city’s municipal wards with the largest numbers of Bank borrowers were selected for the study. Just under half of SEWA’s borrowers and savers were located in these wards. These wards are located in older parts of the city so it is unclear if the results are representative of clients in other wards. Borrowers with loans outstanding and savers who had made at least one deposit during the 1997 fiscal year were defined as the treatment group. The control group was constructed by identifying 50 households in the neighborhoods of each of the 300 sampled borrowers, then drawing 300 households at random from this pool of 15,000 households. Like the treatment group, they consist of economically active women over the age of 18 engaged in informal sector activities. The first round survey was conducted in early 1998 and the second round in early 2000. There was a 13 percent dropout rate as 798 of the 900 households interviewed in round 1 were located and re-interviewed for round 2. Twelve households were selected for in-depth case studies leaving 786 for the quantitative analysis.15 Data were collected from all households on indicators expected to be affected by borrowing and/or saving, and on several control or “moderating” variables. The data were first tested to determine if there were significant differences among the three groups in round 1. Then tests were made to determine if differences measured for the groups between rounds 1 and 2 were significant and likely to be due to financial services. Many of the demographic characteristics of age, marital status, etc. were similar for the three groups in round 1, but there appeared to be systematic differences in primary economic activity. Forty-eight percent of the borrower group reported “own account” as their primary activity, compared to 41 percent in the saver group and 35 15
The authors analyzed the characteristics of the 102 “dropouts” and concluded that their absence would not bias the panel.
24
percent in the control group. This category refers to women who use their own capital to produce and sell or buy and sell goods, while other women produce goods on a subcontract basis, or are wage workers. Some women had been clients of SEWA Bank for years prior to the survey and no data were available about them prior to becoming clients. Therefore, there is no way of knowing if women with different types of economic activities selected to become clients or once they became clients if borrowing and saving in the Bank caused them to change economic activities. For this reason, the differences noted above cannot necessarily be attributed to the Bank. The round 1 data also showed that borrower households had higher average incomes, followed in order by savers and the control group. Borrowers earned a somewhat larger share of income from microenterprises and a smaller share from casual labor. Borrowers were clearly more active in financial markets than the other two groups. They carried more total debt, but saver and control groups carried slightly more debt from non-SEWA sources, and they held even more SEWA savings than the savers group, while the control group reported more non-SEWA savings. Only 39 percent of borrowers fell below the $1 per day poverty line, compared to 53 percent for savers and 67 percent for the control group. The borrower category was generally less poor than the other two and was more active in its use of financial services, but it is unclear if financial services contributed to their economic well-being. Changes measured between rounds 1 and 2 were analyzed to evaluate the extent to which the changes were systematically related to use of financial services. The results revealed expected and unexpected patterns. Relatively few changes were significant in the indicators associated with enterprises compared to the household level indicators. By round 2, 13.1 percent of the sample had ceased to be economically active and they were spread fairly equally among the three groups. Average annual household income rose 17.3 percent per year for savers, 16.2 percent for borrowers, and only 6.8 percent for controls and the differences were statistically significant when the analysis introduced the control variables. The largest source of increase in income for savers and the control group was semi-permanent employment and salaried income that tend to be male activities. Borrowers tended to spend more on housing improvements than the other two groups but there were insignificant results for expenditures on food. Repeat borrowers seemed to experience more positive impacts. Participation in financial services for both borrowers and savers seemed to have more of an impact on boys’ educational enrollment than it did for girls. Neither borrower nor saver status made a significant difference in ability to cope with financial shocks. The financial activities of all three groups increased by the second round. In round 2, the borrowers on average had increased their debt by 17 percent through decreasing their SEWA debt but increasing debt from other sources, so they continued to be the most indebted group. The saver group boosted its total debt by 51 percent, as a few savers borrowed from SEWA and the group sharply increased borrowings from other sources. The control group increased its debt by only 12 percent. Total household financial savings represented roughly 16 percent of sampled household debts in both rounds 1 and 2. Borrower savings rose 13 percent and all the increase was in nonSEWA forms. The saver group increased savings by 54 percent and the increase in nonSEWA savings was greater than the increase in SEWA savings. Total savings by the controls were still much smaller on average than the other two groups but rose by 75
25
percent. Some of these changes may be associated with the households being more confident about providing data in the second round so they engaged in less underreporting of their financial affairs. The results revealed considerable movement both upwards and downwards in poverty status of these women. Some moved out of poverty while others moved into it suggesting that women are vulnerable to changes in poverty. Comparing round 2 with round 1, there were almost no changes in the overall proportions of households below $1 (severe poverty), between $1-2 and above $2 (non-poor) per day in spite of the average increases noted in household income. Roughly 53 percent of all households were below $1 per day for both rounds implying that the increases reported in income were not large enough to pull average household per capita income above this threshold level. Moreover, there were large shifts within groups. Nearly half of the 264 borrower households changed poverty status: 62 fell to a lower category, while 60 rose to a higher category. Of the 62, 10 fell all the way from non-poor to severe poverty. Similarly, of the 260 savers, 58 fell to a lower category and 52 rose to a higher one. For the 262 controls, 42 rose and 44 fell. The greatest proportions of households experiencing shifts were in the borrower and saver groups, with the sharpest changes occurring with the borrowers. This is consistent with the principle of leverage and financial risk: with borrowing, households have more downside risk when business income falls because debts have to be paid. The conclusion of this study is that although some of the changes observed among the three groups may have been associated with being a client of SEWA Bank, the amount of change was modest at best. On the crucial issue of poverty, without stronger evidence for the counterfactual, there is little evidence to conclude that the financial services provided by SEWA Bank made a change in poverty status on average or reduced client vulnerability. Some of the differences noted in favor of the borrower and saver groups may have been associated with attributes not controlled for by the methodology. 3.4. Unresolved Puzzles about Impact Despite the considerable efforts made by these researchers to conduct robust impact assessments, there are many unresolved issues and at least four important puzzles emerge. 3.4.1. Training The poor face many constraints, only one of which is access to financial services. Lack of education is certainly another. Yet the results from these studies are surprising. The credit with education program in Thailand seemed to produce some positive results in the form of better family health and nutrition. But the results in Bangladesh did not show that the 3-6 month skills training provided to clients by BRAC and RD-12 produced better outcomes than Grameen that provided only 15-30 days of training. In fact, for several indicators Grameen clients performed better than the other two. Does this imply that it is easier to change household behavior regarding personal habits than it is to generate business income through training? Are conditions different in Thailand compared to Bangladesh so that training makes a greater impact in the former? Does 26
membership interaction at group meetings produce desirable effects separate from the impacts of loans and training? What do these results imply for the current emphasis on supplying business development services in conjunction with financial services? 3.4.2. Impact on the Poorest Economic theory suggests that the poorest would experience the greatest benefit from receiving loans because they face the greatest capital constraints. But Hulme and Mosely (1996) argued that their case studies showed that greater impacts were realized for clients that were less poor. Their rationale was that the poor were too risk averse to borrow for “promotional” purposes to increase income, but would borrow for “protectional” purposes to preserve consumption standards. Does this suggest that the impacts would be modest even if MFIs were more successful in reaching the poorest? Would some type of safety net or insurance have to be provided so the poor could risk borrowing to make more productive investments? Are larger loans to finance larger investments needed to generate greater impacts as suggested in the Thailand study? 3.4.3. Dropouts Evidence is now emerging that the level of dropouts or desertions from MFIs is quite large. For example, Nagarajan (2001) analyzed 33 MFIs that reported desertion rates to the MicroBanking Bulletin. The eight Asian MFIs reported an average rate of 29 percent.16 Some even higher rates were found in Bangladesh (Meyer, 2002). If MFIs are really producing a positive impact on clients, why are so many clients deserting? What are the characteristics of the dropouts? Are they the poorest? The most vulnerable? Are many of them failures in the sense that their income and assets fell during the time they were clients? If so, does this mean that positive benefits are overstated in impact studies because they usually do not account for dropouts? 3.4.4. Vulnerability The vulnerability of the poor has been the subject of much concern in recent years as understanding about the nature and determinants of poverty has changed (e.g. Sebstad and Cohen, 2001; World Bank, 2001). It is argued that more emphasis should be placed on savings, insurance and other financial services to help the poor cope with shocks that can drive them into debt spirals and deep poverty. Yet the results from the SEWA Bank study suggest that borrowers and savers were more likely to shift poverty status than the control group. It seems that financial services are associated with greater volatility, and both great increases and decreases in income. Does this suggest that the SEWA financial services were inadequate to assist clients to cope with shocks or would the clients have been worse off without SEWA services? Do the services offered by SEWA 16
The desertion rate was calculated as active borrowers beginning of the year plus new clients for the year minus active clients at end of year, divided by active clients at the beginning of the year. New clients were defined as borrowers with first loans and returnees after two years.
27
and other MFIs have to be redesigned if finance is to achieve its purpose of alleviating poverty? 4. Implications for MFIs and Policy Makers in Asia The Asian microfinance industry has achieved some major accomplishments in its objective to reduce poverty through improved access to financial services. It has been particularly successful in creating MFIs with large outreach. But it faces significant challenges in expanding outreach in many countries where the industry is nascent, in making further inroads in countries where it has already reached large scale, and in reaching the very poor everywhere. It also needs to become more financially selfsustainable and to improve its impact on poor clients. Some implications for MFIs and policy makers that derive from the survey presented above are identified in this section. 4.1. Expanding Outreach Outreach is impressive in some countries and some MFIs have grown to serve millions of clients, but there are many areas in the region that are still outside the frontier of microfinance. Even in countries such as Bangladesh where coverage is intensive, it is widely believed that there are major population pockets in poorer regions that are barely touched, and the very poor tend to be bypassed in regions with intensive coverage. The major problem for expanding outreach in most countries is the lack of efficient MFIs to deliver services. Generally, there are more funds available from donors and governments than efficient market-oriented institutions to absorb and efficiently use them. Therefore, building and strengthening institutions is still the first priority in most countries. The proliferation of small NGOs in many Asian countries, however, fragments the effort. Fernando (2001) argues that too many donors and governments are involved in supporting these start-ups without appropriate performance–based contracts. He cites a 1997 survey in the Philippines that revealed only 3 of 223 MFIs were operating nationwide. The total outreach of 131 microfinance NGOs amounted to only 67,000 clients. Consolidations may be necessary in such situations so that a few institutions can achieve the size and economies of scale necessary to efficiently reach large numbers of clients. Fernando argues that more donor coordination is also needed to build a viable and robust industry. The major problem for increasing the depth of outreach to the poorest appears to be the lack of appropriate financial products and services, with related nonfinancial services and safety nets. The overemphasis on lending compared to the provision of insurance, savings and other financial services is a major constraint for reaching those who are most vulnerable and risk-averse. Interesting experiments are underway in the region that may provide guidance on how to design financial services for the very poor along with risk reducing strategies so they dare to use them. 4.2. Achieving Financial Self-sustainability The record for MFI financial self-sustainability is mixed in the region. On the one hand, the BRI unit desa system has been hugely profitable while serving millions of clients. On the other hand, Grameen and many other MFIs in Bangladesh, as well as the 28
majority of MFIs in most countries, rely on subsidies to help cover costs. Part of the problem is that some MFI leaders and many national decision makers believe that the poor cannot and/or should not pay the full costs required to deliver financial services to them, so they argue for subsidies as a matter of choice. These views often result in unrealistic usury laws and interest rate controls that must be changed. When interest rates have been liberalized, such as in India, the challenge for efficient MFIs is to find ways that are socially and politically acceptable to raise interest rates and fees. For inefficient MFIs, the challenge is to improve technology, management, training and incentives. The transfer of technology and nonproprietary information among MFIs within networks and associations will help the entire industry improve its efficiency, and help inefficient MFIs reach higher levels of efficiency achieved by others in the marketplace. MFIs in some locations, such as in Nepal, face especially difficult challenges due to low population density and poor transportation and communication infrastructure. Village banking may be the only viable microfinance alternative because a bank branch system may be too expensive in this environment. These unfavorable environments require public investments in financial and other infrastructure and in human capital if they are to obtain access to financial services with terms and conditions that approach those in richer regions. 4.3. Improving Impact The research summarized above presents an uncertain picture about the impact of financial services on clients. Undoubtedly, some borrowers who have good investment alternatives but face financial constraints may be able to make profitable use of loans and pay high interest rates to cover MFI costs. There are other clients who will receive benefits primarily through smoothing family consumption and avoiding asset sales and informal loans in times of distress, but these impacts may be too subtle to be detected easily in quantitative impact assessments. There is anecdotal evidence in many countries showing that some borrowers get caught in debt spirals because of poor management and financial shocks. This may cause them to drop out and sink deeper into poverty. These cases are not adequately captured in most impact assessments, so it is likely there is a systematic upward bias in estimates of impact. Moreover, little attention has been paid to the impact of savings mobilization and other financial services, so it is unclear if users are realizing the expected benefits. There is a tendency to adopt the model of many Bangladesh MFIs in expecting clients to follow a lockstep system of borrowing ever-larger loans and continuously attending weekly meetings to pay installments and deposit savings. The “one size fits all” approach to lending is too inflexible to meet adequately the demands of heterogeneous clients, and results in multiple memberships (overlap), switching MFIs, dropouts, loan delinquencies and continual reliance on informal sources of financial services. MFIs need to develop additional client-friendly products to fit the heterogeneous demands of the market. This will increase both outreach and impact on clients. Increasing impact for the poorest is especially difficult. There may be a segment of the poorest that can successfully manage financial services if they also receive business management training and other assistance. Others may need special 29
programs and social safety nets to assure food security so that they dare risk borrowing for investments. Still others are so poor, vulnerable, and lacking in basic skills that it would be a mistake to entice them into borrowing. Rather they need safe access to savings instruments to help save for emergencies, to avoid the unwanted claims of family members and friends, and to resist unplanned family consumption. The problem is that there has been relatively little experimentation with delivering small-scale savings and insurance to the very poor so it is unclear how it can be done in a sustainable fashion.17 The challenge in serving the poorest is to determine who can benefit from financial services alone, who needs nonfinancial services along with finance, and who needs nonfinancial services before participating in market-oriented finance. BRAC in Bangladesh is experimenting with a collaborative program with the government and the World Food Program to provide destitute rural women with food grain assistance along with savings and credit services (Hashemi). More governments need to experiment with creative ways to link microfinance with other social assistance programs so the benefits of both are more fully realized. 4.4. Financial Components in Nonfinancial Projects The emphasis of this paper has been to analyze MFIs that specialize in delivering financial services to the poor. Many agricultural, health and other development projects contain small microfinance components. Usually they channel loans to a specific set of persons or households targeted for the project. The design is similar to old style agricultural credit projects in which credit was supposedly necessary to finance the adoption of new technology. These components are usually administered through project implementation offices, ministries, foundations, or some organization other than a financial institution. Such organizations are not designed to engage in careful client screening, monitoring, and loan collection. Often they charge highly subsidized rates and there are few incentives to carefully allocate and recover loans. Most of these microfinance components will likely perform as poorly as the old style subsidized agricultural credit projects. These components should be avoided because they undermine efforts by MFIs to develop efficient, competitive, and sustainable market-oriented finance. Making grants rather than loans will be a far better way to achieve project objectives without creating negative spillovers into the financial markets.
17
A particularly interesting experiment is underway in Bangladesh to provide very flexible savings and loan products to urban slum women in Dhaka. See further the SafeSave website www.safesave.org
30
References Adams, Dale W. “The Decline in Debt Directing: An Unfinished Agenda.” Paper presented at the Second Annual Seminar on New Development Finance, Goethe University of Frankfurt, 21-25 September 1998. Baker, Judy L., Evaluating the Impact of Development Projects on Poverty: A Handbook for Practitioners, World Bank, Washington, D.C., 2000. Charitonenko, Stephanie, Richard H. Patten, and Jacob Yaron, “Indonesia, Bank Rakyat IndonesiaUnit Desa 1970-1996,” Case Studies in Microfinance, Sustainable Banking with the Poor, Washington, D.C., 1998. Chen, Martha A. and Donald Snodgrass, Managing Resources, Activities, and Risk in Urban India: The Impact of SEWA Bank, AIMS Project Report, USAID, Washington, D.C., September 2001. Christen, Robert P., Elisabeth Rhyne, Robert C. Vogel, and Cressida McKean, Maximizing the Outreach of Microenterprise Finance: An Analysis of Successful Microfinance Programs, Program and Operations Assessment Report No. 10, USAID, Washington, D.C., 1995. Coleman, Brett E., “The Impact of Group Lending in Northeast Thailand,” Journal of Development Economics, Vol. 60, 1999, pp. 105-141. Coleman, Brett E., “Microfinance in Northeast Thailand: Who Benefits and How Much?” Unpublished paper, Asian Development Bank, October, 2001. Coleman, Brett E., “Measuring Impact of Microfinance Programs,” Finance for the Poor, Asian Development Bank, Manila, Philippines, Vol. 2, No 4, December 2001, pp. 5-8. Credit and Development Forum, CDF Statistics, Dhaka, Bangladesh, July, 2001. David, Cristina C. and Richard L. Meyer, “Measuring the Farm Level Impact of Agricultural Loans,” in Borrowers and Lenders: Rural Financial Markets and Institutions in Developing Countries, John Howell (ed.), Overseas Development Institute, London, England, 1980, pp. 201-234. Dunn, Elizabeth, “Research Strategy for the AIMS Core Impact Assessments,” AIMS Project Report, USAID, Washington, D.C., March 2002. Fernando, Nimal A., “Proliferation of Microfinance Institutions,” Finance for the Poor, Asian Development Bank, Manila, Philippines, Vol. 2, No. 3, September 2001, pp. 4-5. Hashemi, S. M., “Linking Microfinance and Safety Net Programs to Include the Poorest: The Case of IGVGD in Bangladesh,” Focus Notes No. 21, CGAP: World Bank, Washington, DC, 2001. 31
Hulme, David, “Impact Assessment Methodologies for Microfinance: Theory, Experience and Better Practice,” World Development, Volume 28, No. 1, January 2000, pp. 79-98. Hulme, David, and Paul Mosley, Finance Against Poverty, Volumes 1 and 2, Routledge: London, 1996. Karlan, Dean S., “Microfinance Impact Assessments: The Perils of Using New Members as a Control Group,” Journal of Microfinance, Vol. 3, No. 2, Fall 2001, pp. 75-85. Khandker, Shahidur R., Fighting Poverty with Microcredit: Experience in Bangladesh, New York: Oxford University Press, 1998. Lapenu, Cecile and Manfred Zeller, “Distribution, Growth, and Performance of Microfinance Institutions in Africa, Asia, and Latin America,” FCND Discussion Paper No. 114, International Food Policy Research Institute, Washington, D.C., June 2001. M-CRIL, The M-CRIL Report, 2000. Micro-Credit Ratings and Guarantees India Ltd., Gurgaon, India, 2001. Meyer, Richard L., “The Demand for Flexible Microfinance Products: Lessons from Bangladesh,” Journal of International Development, Vol. 14, No. 3, April 2002, pp. 351-368. Meyer, Richard L., “Microfinance, Poverty Alleviation and Improving Food Security: Implications for India,” Food Security and Environmental Quality in the Developing World, edited by Rattan Lal, David Hansen, Norman Uphoff, and Steven Slack, Boca Raton: CRC Press, 2003, pp. 347-367. Meyer, Richard L. and Geetha Nagarajan, Rural Financial Markets in Asia: Policies, Paradigms, and Performance, Oxford University Press and Asian Development Bank, Manila, Philippines, 2000. MkNelly, Barbara, Chatree Watetip, Cheryl A. Lassen, and Christopher Dunford, “Preliminary Evidence that Integrated Financial and Educational Services can be Effective Against Hunger and Malnutrition,” Research Paper No. 2, Freedom from Hunger, Davis, California, April 1996. Morduch, Jonathan, “The Role of Subsides in Microfinance: Evidence from the Grameen Bank,” Journal of Development Economics, Volume 60, 1999a, pp. 220-248. Morduch, Jonathan, “Does Microfinance Really Help the Poor? New Evidence from Flagship Programs in Bangladesh,” Unpublished paper, Princeton University, 1999b.
32
Morduch, Jonathan, “The Microfinance Promise,” Journal of Economic Literature, Volume XXXVII, December, 1999c, pp. 1569-1614. Muraki, Tetsutaro, Leila Webster, and Jacob Yaron, “The Thai Bank for Agriculture and Agricultural Cooperatives (BAAC): Outreach and Sustainability through 1966,” Unpublished paper, World Bank, Washington, D.C., 1998. Nagarajan, Geetha, “Productivity Drivers and Trends,” The MicroBanking Bulletin, Issue No. 6, April 2001, pp. 35-39. Navajas, Sergio, Mark Schreiner, Richard L. Meyer, Claudio Gonzalez-Vega, and Jorge Rodriguez-Meza, “Microcredit and the Poorest of the Poor: Theory and Evidence from Bolivia,” World Development, Vol. 28, No. 2, February 2000, pp. 333-346. Otero, Maria, and Elisabeth Rhyne (eds.), The New World of Microenterprise Finance, Hartford: Kumarian Press, 1994. Pitt, Mark, and Shahidur R. Khandker, “The Impact of Group-Based Credit Programs on the Poor in Bangladesh: Does the Gender of Participants Matter?,” Journal of Political Economy, Volume 106, No. 5, October, 1998, pp. 958-996. Ravallion, Martin, “The Mystery of the Vanishing Benefits: An Introduction to Impact Evaluation,” The World Bank Economic Review, Vol. 15, No. 1, September 2001, pp. 115-140. Robinson, Marguerite S, The Microfinance Revolution, Volume 2: Lessons from Indonesia, World Bank, Washington, D.C., 2002. Roche, Chris, Impact Assessment for Development Agencies, Oxfam, Oxford, United Kingdom, 1999. Schreiner, Mark, and Jacob Yaron, Development Finance Institutions: Measuring their Subsidy, The World Bank, Washington, D.C., 2001. Sebstad, Jennefer, and Monique Cohen, Microfinance, Risk Management and Poverty, CGAP, World Bank, Washington, D.C., 2001. Stiglitz, Joseph E. and Andrew Weiss, “Credit Rationing in Markets with Imperfect Information,” American Economic Review, Volume 71, No. 3, 1981, pp. 393-410. Todd, Helen, Women at the Center: Grameen Bank after One Decade, Dhaka: The University Press Limited, 1996. Von Pischke, J.D., Finance at the Frontier, Economic Development Institute, World Bank, Washington, D.C., 1991. Von Pischke, J.D. and Dale W. Adams, “Fungibility and the Design and Evaluation of Agricultural Credit Projects,” American Journal of Agricultural Economics, Volume 62, No. 4, November, 1980, pp. 719-726.
33
Woller, Gary, “Reassessing the Financial Viability of Village Banking: Past Performance and Future Prospects,” MicroBanking Bulletin, Calmeadow, Washington, D.C., Issue No. 5, September 2000, pp. 3-8. World Bank, World Development Report 2000/2001: Attacking Poverty, Washington, D.C., 2001. Yaron, Jacob, “Successful Rural Finance Institutions,” Discussion Paper No. 150, Washington, D.C.: The World Bank. 1992. Zeller, Manfred, Gertrud Schrieder, Joachin Von Braun, and Franz Heidhues, Rural Finance for Food Security for the Poor, Food Policy Review 4, International Food Policy Research Institute, Washington D.C. 1997. Zeller, Manfred and Richard L. Meyer (eds.), The Triangle of Microfinance: Financial Sustainability, Outreach and Impact. Forthcoming. The John Hopkins University Press (in cooperation with the International Food Policy Research Institute). Baltimore and London, 2002.
34
ADB INSTITUTE RESEARCH PAPER 49 RESEARCH PAPER SERIES Measuring the Extent and Implications of Director Interlocking in the Pre-war Japanese Banking Industry July 2002 Code: 39-2002
by Tetsuji Okazaki and Kazuki Yokoyama
Exchange Rate Co-movements and Business Cycle Synchronization between Japan and Korea August 2002 Code: 40-2002
by Sammo Kang, Yunjong Wang and Deok Ryong Yoon
Is the Equity Market Really Developed in the People’s Republic of China? September 2002 Code: 41-2002
by Sayuri Shirai
Taipei,China’s Banking Problems: Lessons from the Japanese Experience September 2002 Code: 42-2002
by Heather Montgomery
Banks’ Lending Behavior and Firms’ Corporate Financing Pattern in the People’s Republic of China September 2002 Code: 43-2002
by Sayuri Shirai
An Overview of PRC’s Emergence and East Asian Trade Patterns to 2020 October 2002 Code: 44-2002
by David Roland-Holst
Financial Crisis and Recovery: Patterns of Adjustment in East Asia, 1996-99 October 2002 Code: 45-2002
by Yung Chul Park and Jong Wha Lee
Beyond Sequencing: What does a risk-based analysis of core institutions, domestic financial and capital account liberalization reveal about systemic risk in Asian Emerging Market Economies? November 2002 Code: 46-2002
by James H. Chan-Lee
Financial Repression, Liberalization, Crisis and Restructuring: Lessons of Korea’s Financial Sector Policies November 2002 Code: 47-2002
by Yoon Je Cho
Prospects for Financial Integration and Exchange Rate Policy Cooperation in East Asia December 2002 Code: 48-2002
by Yung Chul Park
Track Record of Financial Institutions in Assisting the Poor in Asia December 2002 Code: 49-2002
by Richard L. Meyer
HOW TO CONTACT US? Asian Development Bank Institute Kasumigaseki Building 8F 3-2-5 Kasumigaseki, Chiyoda-ku, Tokyo 100-6008 Japan
Tel: +81 (03) 3593-5500 Fax: +81 (03) 3593-5571 E-mail:
[email protected] www.adbi.org
Papers are also available online at the ADBI Internet site: http://www.adbi.org/publications/