Adding Numbers to Text Classification Sofus A. Macskassy
[email protected] Dept. of Information, Operations & Mgmt Sciences Leonard N. Stern School of Business New York University 44 W. 4th Street, Suite 8-82 New York, NY 10012-1126 Abstract Many real-world problems involve a combination of both text- and numerical-valued features. For example, in email classification, it is possible to use instance representations that consider not only the text of each message, but also numerical-valued features such as the length of the message or the time of day at which it was sent. Text-classification methods have thus far not easily incorporated numerical features. In earlier work we described an approach for converting numerical features into bags of tokens so that text classification methods can be applied to numerical classification problems, and showed that the resulting learning methods are competitive with traditional numerical classification methods. In this paper we use this as a way to learn on problems that involve a combination of text and numbers. We show that the results outperform competing methods. Further, we show that selecting a best classification method using text-only features and then adding numerical features to the problem (as might happen if numerical features are only later added to a pre-existing text-classification problem) gives performance that rivals a more time-consuming approach of evaluating all classification methods using the full set of both text and numerical features.
Categories and Subject Descriptors: I.2.6 Learning: Concept learning General Terms: Algorithms, Experimentation, Performance Keywords: Text Classification, Machine Learning, Information Retrieval, Numerical Features
1.
INTRODUCTION
Information retrieval (IR) and machine learning (ML) researchers have converged on a common problem, text classification learning, in which a corpus of labeled text documents are used to form procedures for labeling otherwise uncharacterized text documents [22]. IR researchers have taken methods initially designed for text retrieval tasks and have found ways to use them effectively for text classifi-
Permission to make digital or hard copies of all or part of this work for personal or classroom use is granted without fee provided that copies are not made or distributed for profit or commercial advantage and that copies bear this notice and the full citation on the first page. To copy otherwise, to republish, to post on servers or to redistribute to lists, requires prior specific permission and/or a fee. CIKM’03, November 3–8, 2003, New Orleans, Louisiana, USA. Copyright 2003 ACM 1-58113-723-0/03/0011 ...$5.00.
Haym Hirsh
[email protected] Dept. of Computer Science Rutgers University 110 Frelinghuysen Rd Piscataway, NJ 08854-8019
cation problems. On the other hand, ML researchers have found ways to take learning methods designed for numericaland nominal-valued data and use those for text classification problems, typically by viewing each word as a binary feature, or through the use of set-valued features [3]. However, many real-world text classification problems involve a combination of both text- and numerical-valued features. For example, for email classification, each message might have both text-valued features (the message body, the subject field) and numerical features (message length, how many people it was sent to, or the time it was sent) [13]. For ML such combinations of feature-types imposes little challenge — their text-classification methods started off being suitable for numerical features, so both sets of features can be transparently used. For IR it is more problematic — IR methods typically either ignore numbers or use them as semanticless, unrelated text tokens, leaving the question of using numbers with text ill-defined when considering such methods for text classification. This is unfortunate, for it is IR methods that are often the most tractable and thus most realistic for use on classification problems that require speedy, real-time performance. Recently, we have shown that IR text-classification methods are effective for ML numerical-classification tasks using a “bag of tokens” representation [14, 15]. This approach converts every number into a set of tokens such that if two values are close, their sets of tokens will have high overlap, and if the values are further apart the sets will have less overlap. In that work we show that across a range of benchmark numerical classification tasks IR text classification methods perform competitively with traditional ML methods. This paper describe experiments that show that in addition to serving as a way to apply text classification methods to pure numerical classification tasks, it is also effective for classification learning on problems involving both text and numbers. Our experiments demonstrate two domains in which this approach leads to improved learning results on problems involving both text and numbers. We further show that using the bag-of-tokens representation outperforms a more naive “binning” representation (converting numbers into buckets, which are then represented as unique tokens). Moreover, we show that selecting a best classification method using text-only features and then adding numerical features to the problem gives performance that rivals a more time-consuming approach of re-evaluating all classification methods using the full set of both text and numerical features. This is particularly relevant if numerical fea-
Feature name birth rate death rate infant mortality budget elec. consumption elec. export GDP GDP per capita life expectancy literacy
Description Number of births/yr per 1,000 persons. Number of deaths/yr per 1,000 persons. Number of deaths per 1,000 births. Includes revenues and expenditures. Total electricity consumed annually. Total exported electricity. Gross Domestic Product (GDP). GDP divided by population. Expected life for people born in 2001. Percentage of population who read/write.
Table 1: Numerical features used in the CIA data sets. Feature name Description background Major historic events and current issues. economy overview Includes degree of market orientation, economic development and natural resources. government type Basic form of government (e.g., republic, monarchy, dictatorship, etc.)
Table 2: Text features used in the CIA data sets. tures are only later added to a pre-existing text-classification problem — there is no need to reassess the selection of the text-classification method. The remainder of this paper is organized in three primary sections. Section 2 describes our experimental setup, including a short description of our two problem domains, the methodology for encoding numbers, the learning methods used and the evaluation methodology. Section 3 describes our results on each of the two problem domains. Section 4 discusses related work. We end with some final remarks.
Feature name totalminutes hour minutes daynumber length textlength pager cmd recv recv subj sent sent subj logged in last cmd mail read num recpt
Description minutes since midnight which hour of the day is it how many minutes after the hour is it which day is it (0=Sunday, 6=Saturday) length in bytes length in bytes of textual parts seconds since pager last used seconds since last mail from sender seconds since last mail from sender on subject seconds since last mail to sender seconds since last mail to sender on subject seconds since user was last logged in online seconds since last online command seconds since last time mail was read online number of recipients (to and cc)
Table 3: Numerical features used in the Email data set. death-rate, literacy, etc.), and military, roads, etc. We consider seven different classification tasks within this domain, all based on a country’s economic development. In each task, the goal is to predict whether a country belongs to the given group: 1. Countries with Economies (CEIT): (27 countries)
in
Transition
http://www.uneptie.org/ozonaction/contacts/ceit.html
2. Developed Countries: (35 countries) http://www.bartleby.com/151/appendix/2d.html
3. Developing Countries: (100 countries) http://www.worldbank.org/data/countryclass/\ classgroups.htm
4. Least Developed Countries: (49 countries)
2.
http://www.unctad.org/conference
EXPERIMENTAL SETUP
In this section we review the benchmark problems in the two domains used in this work, the bag-of-tokens generation method, and the machine-learning methods used in this work.
5. Less Developed Countries: (176 countries) http://www.bartleby.com/151/appendix/2l.html
6. More/Less Developed Countries: (66/171 countries)
2.1 Benchmark Problems For most work on classification learning researchers have access to benchmark problems commonly used by members of that research community. Although for both numerical and text classification there are well-established sets of benchmark problems, they do not satisfy our need for classification problems involving both text-valued and numerical features. We have thus had to create new benchmark problems of this sort. In this section we present the two domains in which these benchmarks were created.
2.1.1
CIA World Factbook Database
The first domain concerns categorizing economically developing countries, and is based on data available from the 2001 CIA World Factbook Database of 266 countries (see http://www.cia.gov/cia/publications/factbook). The information available for each country spans 301 fields and sub-fields spanning topics such as background of country, government information (type of government, embassies, etc.), geography (location, size, borders, etc.), economy information (GDP, etc.), population information (growth,
http://www.ismmed.org/gdp.htm
7. The Organization For Economic Co-Operation and Development (OECD): (33 countries) http://www.oecd.org/oecd/pages/home/displaygeneral/\ 0,3380,EN-countrylist-0-nodirectorate-no-no-159-0,00.html
We constrain the set of features used for this study to ten numerical features and three text features. Tables 1 and 2 lists these features.
2.1.2
Wireless Email
The second study is in the domain of email filtering for wireless devices. The question we ask in this domain is whether it is possible to predict if a given user wants to read an incoming email on his or her pager. This question, adopted from an earlier study [13], is based on three people using wireless pagers for reading email over a period of many months. The system would send the headers of new incoming emails to the pager, at which point the user could decide whether to have the complete body of the email sent to the pager for reading.
Feature name Description dayname The name of the day daytype IS it a weekend or weekday from tokenized list of the from-field1 to tokenized list of the to-field1 tocc combined tokenized list of the to- and cc-field1 subject words in subject body words in body 1) email addresses of the form:
[email protected] were converted into the tokens: user user@domain
[email protected] domain machine.domain
Table 4: Text features used in the Email data set.
AD HH SM
Size 5999 23045 9211
Months of data used 16 months 14 months 36 months
Ratio of emails read on pager 20.11% 22.12% 14.00%
Table 5: Email data sets from three user’s extended use of an EmailValet. The data used in this study is based on usage archives of the three users split into one data set per user: AD, HH and SM. We were able to label each email message in these logs as either “Forward”, that the message’s full text was requested, or “NotForward”, that it was not. The historical use of the pager for each user was treated as a separate data set, giving us three unique data sets over this period. We use 22 features for this study, 15 of them numeric. Tables 3 and 4 show the features that were used in this experiment, while Table 5 shows the size and ratio of messages read by each respective user.
2.2 Encoding Numbers for Text Classification In a nutshell, the bag-of-tokens creation method takes each feature and finds a set of “threshold values” or “splitpoints” within the feature’s range of legitimate values by analyzing the values that the feature is observed to take on among the training examples. Given an example, its numerical value for a given feature is compared to each of that feature’s split points, and for each such comparison a token will be added, representing either that the value is less than or equal to the particular split point or greater than that split point. This will result in exactly one token being added per split point. Split points are selected by appropriating the Fayyad and Irani entropy-based method for feature discretization in decision-tree learning [6, 12]. For each numerical feature, A, the algorithm takes the set of data, S, pruned to contain only the values of that feature, A, sorts on the values of A, and finds the partitioning value, α, with the highest information gain. It then recursively finds the best partitioning of each of the two subsets of data that the split imposes, until reaching a stopping criteria based on Minimum Description Length Principles (MDLP) [20] is met. It ends by returning the list of α’s found. No modification was made to the decision-tree discretization procedure when used in this way. We refer the reader to the source papers for further details. We furthermore compare our results to a more simpleminded but also plausible baseline approach for converting
numbers to text. We generate the same split-points as just described, only we create single-token “bins” corresponding to the region between consecutive splits. Thus, for example, bin0 represents all values less than the first split point, bin1 all the values between the first and second split point and so on. A numerical value for feature fj is then converted into a single text-token by identifying the bin it belongs to and then converting the bin into one of the text-tokens “binone”, “bintwo”, etc.
2.3 Classification Learning Methods For this study, we make use of four classifiers often used for text classification: Maximum Entropy [16, 19], Naive Bayes [5, 9, 17], Rocchio [9, 21, 22], and Slipper [4].1 Three of the methods we use in this study are part of the Rainbow system (Maximum Entropy, Naive Bayes and Rocchio), which treats an instance as one big bag of tokens. Therefore, we had to create our tokens in such a way that the methods could distinguish between the different features (e.g., the token “market” in the Background field of a country in the CIA World Factbook benchmarks should be treated differently from the token “market” in the economic overview field). To achieve this, each token generated has the name of the feature prepended to it, thus creating the tokens “backgroundmarket” and “econonmicoverviewmarket”. The same methodology was used for numerical features, where a numerical value of 100 in the Literacy field would be converted to the token “literacymorethanten” if using the bag-of-tokens encoding and 10 was one of the split points found for the Literacy feature. (For the baseline tokenization method, we might analogously get the single text-token “literacybin1 ”.) These prefixes were not added for Slipper, since Slipper natively works with multiple features. Hence, for Slipper, the above examples would use the token “market” for each of the feature of background and economic overview and “morethanten” for the feature literacy if using the bag-of-tokens encoding. Our primary results use the following basic methodology: 1. Given a data set and a set of learners, run all the learners using only the text features. Keep the learner which has the best performance — the best text learner. 2. Run the best text learner from the previous step using both numerical and text features, where the numerical features are added using the bag-of-tokens representation. We consider it a win if the run using both types of features outperforms the run using only the text features. 3. Perform a statistical significance analysis to see if the win — whichever way the comparison went — is significant and at what level. Maybe the above methodology is flawed and any gain might be due to other factors or maybe it is possible to achieve even better performance. To address these issues, we ask these questions: 1. Maybe there is another method which is better. To answer this question, we compare the performance you get by adding numerical features to the best text-only 1
As initial runs of SVM-light [25, 10] showed that at best it performed comparably to the other methods and often worse, it is not used in these studies.
Table 6: Different sets of features used in the CIA classification tasks.
mixed features 100 95 best text method
numerical feature sets 1.GDP, GDP-per-capita 2.GDP, GDP-per-capita, life expectancy, literacy 3.all numerical features text feature sets 1.economy overview 2.background, government type 3.all text features
90 85 80 75 70 65 60
best text method: mixed vs. text
60
100
mixed features
70 75 80 85 90 non-best text methods
95
100
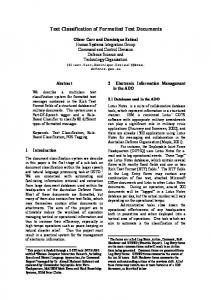
Figure 2: Comparison on the CIA data of the best text method using mixed features to other methods using mixed features.
95 90 85 80 75 75
80
85
90
95
100
text features
Figure 1: Comparison on the CIA data of the best text method using only text to best text method using mixed features. method and compare it to all other methods when given both text and numbers. 2. Perhaps any increase in performance is not because of the use of text and numbers but is soleley due to the numbers, where the performance gain is in spite of the text. To answer this question, we compare the performance achieved by adding numbers to the best textonly method, to the method which performs the best on the same classification task and same featurization using only numerical values. 3. Finally, maybe using a simpler numeric encoding than the bag-of-tokens is all that is required to get the same, or better, improvement in performance. To answer this question, we compare the performance of the best text-only method using the bag-of-tokens encoding to that of the same method using the binning encoding described in the previous section.
3.
65
RESULTS
We present our results in this section, divided into the two main domains in which the benchmarks were created.
3.1 CIA World Factbook Database We tested different featurizations of text and numerical features in our studies in the CIA World Factbook domain in order to get a sense of how stable the performance of the learners are as more features are used together. Thus, we
split the numerical and text features up into three sets each, as shown in Table 6, then perform learning on all nine possible featurizations of those sets. Each classification task was run using each of the four text classifiers mentioned in the previous section. Each experiment is thus one of the seven classification problems using one of the nine featurizations. The accuracy of each run was found using ten-fold stratified cross-validation [11]. As we compare many featurizations and classifications in this section, all results will be shown on scatter-plots. As outlined in the evaluation methodology, we start by selecting the best performing classifier using only the text features. Then we add the numerical features and run the same classifier again, and compare the accuracies of the two runs. We do this for all featurizations and all classification tasks, resulting in a total of 63 comparisons (9 featurizations times 7 classification tasks). Figure 1 shows a scatter-plot of these 63 comparisons. Each point on the plot represents one method, on one classification task, using one featurization. The x value of the point is the average accuracy of the method using only text features, and the y value of the point is the average accuracy method using both numerical and text features. If the point is above the diagonal line, then the method had better average accuracy using the mixed features. As is qualitatively clear from the figure, our approach performs very strongly and is the clear winner in the majority of cases and has only a few losses. Taking a closer look at the comparisons reveals that our approach won 49 times, lost 6 times and tied 8 times. Performing a paired t-test on the errors shows that it is significant above the 99.9% level.2 These results show only part of the picture. Perhaps the best text method is not the best method to use when using text and numbers. To test this question, we present additional results in Figure 2. For these experiments we take the performance you get by adding numerical features to the best text-only method and compare it to all other 2 Note that these 63 runs are clearly related to one another and thus they violate the independence assumption of the t-test. The statistical results of this sort presented in this section should be taken therefore only as suggestive of expected performance.
approach is all that is required to get the same, or better, improvement in performance as what our encoding has shown above. We used the same methodology as before — identify the best performers using only text features and then add numerical features using the binning encoding described in the previous section. We then compared the average accuracies of the bag-of-tokens encoding to that of the baseline encoding. Figure 4 shows the scatter-plot of this comparison. While visually the figure appears equivocal, the accuracies show that the bag-of-tokens encoding won 39 times, lost 13 times and tied 11 times. The t-test verifies this, showing it to be statistically significant above the 99.9% level.
best text method (mixed features)
Best text with mixed features vs best numeric 100 95 90 85 80 75 70 70
75 80 85 90 95 best numeric method (numeric features)
100
Figure 3: Comparison on the CIA data of the best text method using mixed features to best numerical method using numerical features. best text method: bag-of-tokens vs. binning
bag-of-tokens encoding
100 95 90 85 80 75 75
80
85 90 binning encoding
95
100
Figure 4: Comparison on the CIA data of the best text method using bag-of-tokens encoding to the best text method using binning encoding. methods when given both text and numbers. The scatterplot shows that with only a few exceptions, starting with the best method using only text and adding numeric features to it outperforms all other methods. The details show that it won 159 times and lost 30 times with no ties. A t-test shows this to be significant above the 99.9% level. Perhaps our results are not because of the use of text and numbers but in spite of it. Maybe using only numbers would outperform both mixed and text-only featurizations. Figure 3 shows that this is not the case. We again take the performance you get by adding numbers to the best text method, but now compare it to the method which performs the best on the same classification task and same featurization using only numerical values. The figure qualitatively shows that using both features is the better performer by winning 40 times — many of those being by a large margin — and losing 23 times with no ties. This is verified with a paired t-test which shows this to be significant at the 99.8% level. Finally, was the bag-of-tokens encoding more complex than what is needed? Maybe using a more simple binning
3.2 Wireless Email We now show similar results for our benchmarks in the wireless email domain. Because of the temporal nature of the data, we do not use cross-validation. Instead, for each test instance, we learn a model based solely on emails whose timestamp is less than the test email, then use that learned model to predict whether to forward that particular test email. Since it is unclear how much past data yields the most effective generalization, three different window-sizes were tested: The previous 100 emails, the previous 500 and an infinite window size (the complete user history). A test set of 500 instances was chosen at random from each user’s trace. These were chosen in such a way that they kept the overall class distribution, while ensuring that each message would have at least 5 instances of each class in the previous 100 messages (so that the classifiers would be able to learn at least a minimally discriminatory model for each test instance). Three different sets of runs were performed with differing sets of features and classifiers. This separation of runs was done due to Maximum Entropy and Slipper both being very slow and were infeasible to run using the full body, and in a domain where real-time speed is of essence, even using the full body with Naive Bayes and Rocchio (the fastest methods) might unduly slow down run times. We thus divide the runs into three different categories: (1) The fast methods, Naive Bayes and Rocchio, which enable easy updating of a model, without the body feature; (2) The slow methods, Maximum Entropy and Slipper, also without the body feature, and (3) The fast methods using a more comprehensive featurization including the body feature. We apply the evaluation methodology to each of the three window-sizes separately, as the optimal text learner is potentially different depending on the window-size. Figure 5 shows a scatter-plot of the results of all the comparisons. We plot, for all window sizes and all methods, the performance of a method using text only versus using numerical and text features. Each point on the plot is one method using one window-size, using either all text features or all text features except body, where the x value represents the accuracy using only the text features and the y value represents the performance when using both text and numerical features. As is clear in the figure, adding numerical features did in the majority of cases improve performance, sometimes quite dramatically, while in the cases where performance was hurt, it was done so only minimally. Taking a closer look at the comparisons in the figure, using the mixed features won 50 out of 63 times, with 3 ties. Performing a paired t-test on the errors shows that this is significant above the 99.9% level.
90 85 80 75 70 65 60 AD HH SM
55 50 50
55
60 65 70 75 80 Accuracy using text features only
85
90
Figure 5: Comparison on the email data of all classifiers using all window-sizes, using text only features versus adding numerical features. Comparison of accuracies of mixed features on email data
90 85 80 75 70 65 60 AD HH SM
55 50 50
55
60 65 70 75 80 Accuracy using binning encoding
85
90
Figure 7: Comparison on the email data of all classifiers using all window-sizes, using bag-of-tokens encoding versus using binning encoding. methodology as before — any point above the diagonal is a win for the bag-of-tokens encoding. The figure clearly shows a qualitative win for the bag-of-tokens encoding — it won 58 times, lost 11 times and tied 3 times (out of a total of 72 comparisons). The t-test shows that this is significant above the 99.9% level.
90 85 best text method
Comparison of bag-of-tokens vs binning on email data Accuracy using bag-of-tokens encoding
Accuracy including numerical features
Comparison of accuracies on email data with and without numerical features
80 75 70
4. RELATED WORK
65 60 AD HH SM
55 50 50
55
60
65 70 75 non-best text methods
80
85
90
Figure 6: Comparison on the email data of the best text method using mixed features to other methods using mixed features. Again we ask the question of whether it is the correct procedure to start with the learner that performs best using only text features and then add numbers. To answer this, we compared the performance of the learners for each type of run for each window size, giving us 27 comparisons. Each type of run (all learners, fast learners using body, fast learners with no body) we identified the learner that performed the best using only text features, then compared the performance of this learner using both types of features to the other learner(s) also using both types of features. Figure 6 shows the scatter-plot of this comparison. It is quite clear that starting with the learner that performs best using only text features is the correct choice. The details show that it won 21 times and lost 4 times with 2 ties. A paired t-test shows this to be significant above the 99.9% level. We also performed an analysis of learning with only numerical features. However, the performances of these runs were unilaterally worse than using only text or mixed features. We will therefore not do any in-depth analysis of these here. As in the previous study, we also compared the bagof-tokens encoding to that of the binning encoding using the same methodology as in the previous study. Figure 7 shows the scatter-plot of these comparisons, using the same
Using numerical values in an environment that does not easily handle numbers is not new, nor is converting numerical values into a representation that is more suited for the target environment. One example is the use of thermometer coding (TC) in neural networks which convert numerical values into a set of Boolean variables [8]. TC also uses a set of threshold or landmark values, where each value yields a Boolean variable representing on which side of the threshold a given value lies. Although the threshold values for TC are typically selected in an ad hoc fashion, [27] uses entropybased measures to build up a set of landmark values. The step forward here is to realize that instead of generating Boolean features the results can be converted to bags of tokens, enabling the use of text methods on such data. TC has also been successfully applied to numerical classification using entropy based threshold values [7]. Reinforcement learning is another such environment [26, 24]. One technique which is commonly used is known as tile coding function approximation, sparse coarse coding or CMAC [1, 26, 23]. This technique works by generating several overlapping grids of the state space, such that any given point in the state space will lie in exactly one cell in each grid. Thus, the representation of a point is represented by the set of cells that it lies in. This is in some sense a multivariate generalization of our baseline tokenization method, and merits further exploration in this different context. Finally, identifying a small set of landmark numerical values—known as feature discretization — to help classification is also a well-studied question within machine learning [2, 6, 12, 7, 18]. Feature discretization centers on the issue of finding good split points in a decision tree. As such, the main idea is to find the fewest and the most indicative values that can help make a good prediction. Quite simply, we appropriate such methods to be used in a new context in which it had not previously been envisioned.
5.
FINAL REMARKS
Until now, IR-based methods for text classification have inherited the challenges faced by using numerical information in text classification. Recent work has shown that IR text-classification methods can perform credibly on numerical classification problems, where numbers are converted to bags of tokens such that similar numbers have similar bags of tokens, and distant numbers have dissimilar bags of tokens. This paper has shown that in benchmark problems in two domains adding numerical features using the bag-of-tokens approach is an effective way to perform classification learning given both text and numbers. Moreover, using bag-of-tokens was shown to outperform a more naive binning representation. Further, we showed that if you have a text-classification system in place based on the best performance of text-only features, this classifier is likely also the best performer when adding numerical features using the bag-of-tokens scheme. We hope that this work will make people more aware of the possibility of tackling classification problems involving both text and numbers. We look forward to further exploring the merit of this approach (and improvements to it) as our experience with problems involving both text and numbers continues to increase. Finally, we are hopeful that the insights presented here may also shed new insights into how to exploit numerical information in text retrieval and other tasks where a combination of text and numbers may appear.
[7]
[8] [9]
[10]
[11]
[12]
[13]
[14]
Acknowledgments We would like to thank Foster Provost, Lyle Ungar, and members of the Rutgers Machine Learning Research Group for helpful comments and discussions. This work is sponsored in part by the Defense Advanced Research Projects Agency (DARPA) and Air Force Research Laboratory, Air Force Materiel Command, USAF, under agreement number F30602-01-2-585. The U.S. Government is authorized to reproduce and distribute reprints for Governmental purposes notwithstanding any copyright annotation thereon. The views and conclusions contained herein are those of the authors and should not be interpreted as necessarily representing the official policies or endorsements, either expressed or implied, of the Defense Advanced Research Projects Agency (DARPA), the Air Force Research Laboratory, or the U.S. Government.
6.
REFERENCES
[1] J. S. Albus. In Brain, Behavior, and Robotics, chapter 6, pages 139–179. Byte Books, Peterborough, NH, 1981. [2] J. Catlett. On changing continuous attributes into ordered discrete attributes. In Y. Kodratoff, editor, Proceedings of the European Working Session on Learning, pages 164–178. Berling: Springer-Verlag, 1991. [3] W. W. Cohen. Learning trees and rules with set–valued features. In Proceedings of the National Conference on Artificial Intelligence, pages 709–716, 1996. [4] W. W. Cohen and Y. Singer. A simple, fast, and effective rule learner. In Proceedings of the Sixteenth National Conference on Artificial Intelligence, pages 335–342, Menlo Park, CA, 1999. AAAI/MIT Press. [5] P. Domingos and M. Pazzani. Beyond independence: Conditions for the optimality of the simple Bayesian classifier. In Proceedings of the 13th International Conference on Machine Learning, pages 105–112, 1996. [6] U. M. Fayyad and K. B. Irani. Multi-interval discretization of continuous-valued attributes for classification learning.
[15] [16] [17] [18]
[19]
[20] [21] [22]
[23] [24] [25] [26] [27]
In Proceedings of the 13th International Joint Conference on AI, pages 1022–1027. Morgan Kaufmann, 1993. E. Frank and I. H. Witten. Making better use of global discretization. In Proc. of the 17th International Conference on Machine Learning, pages 115–123, 1999. S. I. Gallant. Neural Network Learning and Expert Systems. MIT Press, Cambridge, Massachusetts, 1993. T. Joachims. A probabilistic analysis of the Rocchio algorithm with TFIDF for text categorization. In D. H. Fisher, editor, Proceedings of the Fourteenth International Conference on Machine Learning, pages 143–151, Nashville, US, 1997. Morgan Kaufmann. T. Joachims. Making large-scale svm learning practical. In B. Sch¨ okopf, C. Burges, and A. Smola, editors, Advances in Kernel Methods - Support Vector Learning, chapter 11. MIT Press, Cambridge, MA, 1999. R. Kohavi. A study of cross-validation and bootstrap for accuracy estimation and model selection. In Proceedings of the 14th International Joint Conference on Artificial Intelligence, pages 1137–1143, San Francisco, CA, 1995. R. Kohavi and M. Sahami. Error-based and entropy-based discretization of continuous features. In Proceedings of the Second International Conference on Knowledge Discovery and Data Mining, pages 114–119, Menlo Park, CA, 1996. AAAI Press/MIT Press. S. A. Macskassy, A. A. Dayanik, and H. Hirsh. EmailValet: Learning user preferences for wireless email. In Proceedings of Learning about Users Workshop, IJCAI’99, Stockholm, Sweden, 1999. S. A. Macskassy, H. Hirsh, A. Banerjee, and A. A. Dayanik. Using text classifiers for numerical classification. In Proceedings of the Seventeenth International Joint Conference on Artificial Intelligence, Seattle, WA, August 2001. S. A. Macskassy, H. Hirsh, A. Banerjee, and A. A. Dayanik. Converting numerical classification into text classification. Artificial Intelligence, 143(1):51–77, January 2003. A. McCallum and K. Nigam. A comparison of event models for naive bayes text classification. In AAAI-98 Workshop on Learning for Text Categorization, 1998. T. Mitchell. Machine Learning. McGraw Hill, 1997. P. Nardiello, F. Sebastiani, and A. Sperduti. Discretizing continuous attributes in adaboost for text categorization. In Proceedings of the 25th European Conference on Information Retrieval, Pisa, IT, 2003. K. Nigam, J. Lafferty, and A. McCallum. Using maximum entropy for text classification. In Proceedings of Machine Learning for Information Filtering Workshop, IJCAI’99, Stockholm, Sweden, 1999. J. Rissanen. Minimum description length principle. Encyclopedia of Statistical Sciences, 5:523–527, 1987. R. Schapire, Y. Singer, and A. Singhal. Boosting and Rocchio applied to text filtering. In Proceedings of ACM SIGIR, pages 215–223, 1998. F. Sebastiani. Machine learning in automated text categorization. ACM Computing Surveys, 34(1), March 2002. P. Stone and R. S. Sutton. Scaling reinforcement learning toward robocup soccer. Journal of Artificial Intelligence Research, 2002. To Appear. R. S. Sutton and A. G. Barto. Reinforcement Learning: An Introduction. MIT Press, Cambridge, MA, 1998. V. N. Vapnik. The Nature of Statistical Learning Theory. Springer, 1995. C. J. C. H. Watkins. Learning from Delayed Rewards. PhD thesis, Kings College, Cambridge, UK, 1989. J. Yang and V. Honavar. A simple randomized quantization algorithm for neural network pattern classifiers. In Proceedings of the World Congress on Neural Networks, pages 223–228, San Diego, CA, September 1996.