ADDRESSING CLIMATE CHANGE
901 D Street, S.W., Suite 900 Washington, D.C. 20024-2115
Initial Findings from an International Public-Private Collaboration
ADDRESSING CLIMATE CHANGE Initial Findings from an International Public-Private Collaboration
Battelle Memorial Institute
Richard Balzhiser, President Emeritus, EPRI
BP
Richard Benedick, Former US Ambassador to the Montreal Protocol
EPRI
Ralph Cavanagh, Co-director, Energy Program, Natural Resources Defense Council
ExxonMobil
Charles Curtis, Executive Vice President, United Nations Foundation
Kansai Electric Power
Zhou Dadi, Director, China Energy Research Institute
National Institute for Environmental Studies (Japan)
E. Linn Draper, Chairman, President and CEO, American Electric Power
New Energy and Industrial Technology Development Organization (Japan)
Daniel Dudek, Senior Economist, Environmental Defense Fund
North American Free Trade Agreement–Commission for Environmental Cooperation
John H. Gibbons, Former Director, Office of Science and Technology Policy, Executive Office of the President
PEMEX (Mexico)
José Goldemberg, Former Environment Minister, Brazil
Tokyo Electric Power
Jim Katzer, Strategic Planning and Programs Manager, ExxonMobil
Toyota Motor Company
Yoichi Kaya, Director, Research Institute of Innovative Technology for the Earth, Government of Japan
US Department of Energy
Hoesung Lee, President, Korean Council on Energy and Environment Robert McNamara, Former President, World Bank Kathryn Shanks, Vice President, Health, Safety and Environment, BP Hazel O’Leary, Former Secretary, US Department of Energy Rajendra K. Pachauri, Director, Tata Energy Research Institute
Core Institution Battelle
Thomas Schelling, Distinguished University Professor of Economics, University of Maryland Hans-Joachim Schellnhuber, Director, Potsdam Institute for Climate Impact Research Pryadarshi R. Shukla, Professor, Indian Institute of Management Gerald Stokes, Assistant Laboratory Director, Pacific Northwest National Laboratory
Collaborating Institutions
John Weyant, Director, Stanford Energy Modeling Forum
Autonomous National University of Mexico
Robert White, Former Director, National Academy of Engineering
Centre International de Recherche sur l’Environnment et le Developpement (France) China Energy Research Institute Council on Agricultural Science and Technolog y Council on Energy and Environment (Korea) Council on Foreign Relations Indian Institute of Management International Institute for Applied Systems Analysis (Austria) Japan Science and Technology Corporation National Renewable Energy Laboratory Potsdam Institute for Climate Impact Research (Germany) Stanford China Project Stanford Energy Modeling Forum Tata Energy Research Institute (India)
In 1998, Battelle, together with EP RI, established the Global Energy Technology Strategy Program with the aim of assessing the role that technology can play in addressing the long-term risks of climate change. Led by a core group of Battelle scientists, the program benefits from analyses and insights provided by a network of partner institutions around the world. The process is guided by an international steering group representing diverse perspectives and is funded by government agencies, research institutions, and private industry. This document was reviewed by the Steering Group and was principally drafted by Jae Edmonds, Tom Wilson, and Richard Rosenzweig with substantive contributions from Richard Benedick, Elizabeth L. Malone, John F. Clarke, James J. Dooley, and Son H. Kim. The authors appreciate the support of Chet Cooper and Bill Pennell. The views and opinions of the authors expressed herein do not necessarily state or reflect those of the sponsoring or participating institutions.
Executive Summary . . . . . . . . . . .2
The Challenge . . . . . . . . . . . . . .10
Energy Today and Tomorrow . . .20
Technology Needs . . . . . . . . . . .28
Technology Portfolio . . . . . . . . .34
Research & Development . . . . .44
Conclusion . . . . . . . . . . . . . . . . .52
. . . . . . . . . . . . . . . . . . . . . . . . . .58 1
Executive Summary
lobal climate change is one of the most complex environmental, energy, economic, and political issues confronting the international community. The impacts
This report focuses on carbon dioxide, the greenhouse gas contributing the majority of the projected human influence on climate. Carbon dioxide emissions can affect the atmosphere for hundreds of years. Some of the carbon dioxide emitted in 1800 is still in
of climate change are likely to vary
the atmosphere—and today’s emissions will
considerably by geographic region and occur
continue to influence climate in 2100. The
over a time scale of decades to centuries. The actions needed to manage the risks ultimately require substantial long-term commitments to technological change on the part of societies worldwide.
total concentration of carbon dioxide in the atmosphere at any given time is much more important in determining climate than are emissions in any single year. Limiting the human impact on the climate system therefore requires that atmospheric concentrations be stabilized. Recognizing this fact, more than 180 countries ratified the 1992 United Nations
The Challenge
Framework Convention on Climate Change (FCCC), and it has entered into force under international law. The ultimate objective of
The Earth’s climate is governed primarily by
this treaty is to achieve “stabilization of
complex interactions among the sun,
greenhouse gas concentrations in the
oceans, and atmosphere. The increased con-
atmosphere at a level that would prevent
centration of heat-trapping “greenhouse
dangerous anthropogenic interference with
gases” in the atmosphere has led to con-
the climate system.” (Article 2)
cerns that human activities could warm the Earth and fundamentally change the natural
The objective of the FCCC—stabilizing the
processes controlling climate.
concentrations of carbon dioxide and other greenhouse gases—is not the same as stabilizing emissions. Because emissions accumulate in the atmosphere, the concentration of carbon dioxide will continue to rise for several hundred years even if emissions are held at current levels or slightly reduced.
2
3
Technology is Critical
The FCCC process has not yet specified a particular target concentration. But in order to stabilize concentrations at any level rang-
Energy is central to the climate issue. Energy
ing from 450 parts per million to 750 parts
use appears to be the primary contributor to
per million, very large reductions of world-
the global increase in carbon dioxide con-
wide emissions (from emissions that might
centrations. Increasing world population,
be anticipated were present trends to con-
together with the universal desire for eco-
tinue) would be required during the course
nomic development, will lead to growing
of the present century.
demand for the products and services that the energy system provides. The future evo-
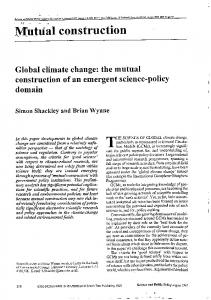
The Future With and Without Technological Change
40
IS92a (1990 technology) IS92a 550 ppmv constraint
35 30 25 20 15 10 5 0 1990
2010
2030
2050
2070
2090
Carbon Dioxide Concentrations 1100 1000 900 800
minant of the magnitude of future human influence on the climate. Managing the risks of climate change will require a transformation in the production and consumption of energy. Technology is critical to such a transformation. Improved technology can both
IS92a (1990 Technology) IS92a 550 ppmv constraint preindustrial
700 600 500
5.0
3.5 3.0 2.5 2.0
1.0
reduce the cost of achieving any concentra-
1995
4.0
to produce a unit of economic output
improved technologies can significantly
1985
4.5
1.5
unit of energy used. Successful develThe middle curve in the first chart depicts the carbon dioxide emissions associated with the Intergovernmental Panel on Climate Change (I P CC) central scenario, denoted IS92a, and the middle curve in the second chart represents the concentrations in the atmosphere that result from these emissions. This I PCC “business-asusual” scenario incorporates signifi cant technological advances. In contrast, while the top curves assumes the same population and economic growth as IS92a, they hold energy technology constant at its 1990 level. The difference between the upper and middle curves thus illustrates the technological improvement needed merely to achieve the IS92a emissions path with its corresponding impact on concentrations. The lower curves depict an emissions path and its corresponding concentration path consistent with a 550 parts per million volume (ppmv) concentration ceiling. The dotted line on the concentrations chart indicates the pre-industrial level of carbon dioxide concentrations (i.e., a level virtually unaffected by human activities).
5.5
reduce the amount of energy needed
opment and deployment of new and
50 45
by coal, oil, and gas—is the key deter-
and lower the carbon emissions per
Carbon Emissions
Energy R&D Funding is Declining
lution of that system—dominated today
.5 0
Total public funding of energy research in the OECD is falling. Although Japan’s outlays increased slightly, US spending declined and leading European nations reduced their funding dramatically.
tion target. Incremental improvements in technolog y Recent trends in public and private spending
help, but will not by themselves lead to sta-
on energy research and development sug-
bilization.
gest that the role of technology in addressing climate change may not be fully under-
A technology strategy is an essential comple-
stood. Although public investment in energy
ment to national and international policies
R&D has increased slightly in Japan, it has
aimed at limiting emissions, enhancing
declined somewhat in the United States and
adaptation, and improving scientific under-
dramatically in Europe, where reductions of
standing. A technology strategy will provide
70 percent or more since the 1980s are the
value by reducing costs under a wide range
norm. Moreover, less than 3 percent of this
of possible futures, which is essential given
investment is directed at a few technologies
the uncertainties in the science, policies,
that, although not currently available com-
technologies, and energy resources. The lack
mercially at an appreciable level, have the
of a technology strategy would greatly
potential to lower the costs of stabilization
increase the difficulties of addressing the
significantly.
issue of climate change successfully.
400 300
Energy Technology Strategy
200 100 0 1990
4
The findings and recommendations of the Global Energy Technology Strategy Program, listed below, represent an initial attempt at
2010
2030
2050
2070
2090
Fundamental changes in the energy system
delineating the elements that will be needed
are required to stabilize concentrations of
to guide the development of a technology
greenhouse gases in the atmosphere.
strategy to address climate change. 5
Stabilizing concentrations of greenhouse gases in the atmosphere requires fundamental change in the energy system.
Technology breakthroughs are essential both to stabilize greenhouse gas concentrations and to control costs.
A portfolio of technologies is necessary to manage the risks of climate change and to respond to evolving conditions.
Current investments in energy research and development are inadequate.
Energy is central to the climate change
Although incremental technology
A diversified portfolio accommodates future
Energy research and development outlays
issue. Carbon dioxide emissions from the
improvements are essential, they will not
uncertainties. Changing scientific knowledge
are declining. Both public and private
production and consumption of fossil fuels are
lead to stabilization. Even with significant
and economic conditions, combined with
sector investments in energy research and
the largest contributor to human emissions of
improvements in the performance of existing
uncertainty in the resource base, require a
development have declined significantly since
greenhouse gases. Fossil fuel resources are
commercial technologies, the concentration
diversified initial portfolio of technology invest-
the 1980s.
abundant, and, if used in conjunction with
of carbon dioxide in the atmosphere would
ments. Portfolio investment priorities will evolve
present energy technolog y, have the potential
grow to more than 2.5 times pre-industrial
over time as these uncertainties are better
Energy research and development
to increase the concentrations of greenhouse
levels by 2100.
understood.
expenditures are unfocused and poorly coordinated. Neither public nor private sector
gases in the atmosphere substantially.
Technology breakthroughs can reduce the
A broad portfolio can control costs. A portfo-
investments are adequately focused on the
If present trends continue, carbon dioxide
cost of greenhouse gas stabilization
lio encompassing a broad suite of technologies
technologies that could be critical for stabiliz-
emissions from energy will continue to grow.
dramatically. Technological advances can
can lower the costs of stabilization significantly.
ing concentrations in the long term. Among
The influences of future population growth and
reduce the annual cost of stabilizing
However, the public and private sectors cannot
the few governments with national energy
economic development on the demand for
atmospheric concentrations of greenhouse
fund every idea. Technology investment priorities
research and development programs, invest-
energy services are likely to exceed currently
gases by at least 1-2 percent of global world
must be established to reflect available funding.
ments are poorly coordinated and fail to take
projected improvements in energy intensity and
product. The savings will depend upon the
the ongoing transition to less carbon-intensive
concentration target and the level of technology
A broad portfolio can meet the differing
fuels. However, trends are not destiny—a global
improvement.
needs of key regions. Countries will need and
technology strategy could help change the present course.
advantage of possibilities for joint, comple-
employ different technologies based on their
Terrestrial sequestration, hydrogen, and
It is time to get started. The energy system is
geography, indigenous resources, and econom-
carbon capture, use, and storage
capital-intensive, and the development and
ic, social, and political systems.
technologies potentially play an important
In order to stabilize concentrations of
deployment of new technologies can take
greenhouse gases in the atmosphere, global
decades. Given the lead-time necessary to
A flexible portfolio can accommodate alterna -
carbon emissions must peak during the 21st
develop and deploy new technologies with
tive policy responses to the climate issue. A
century and then decline indefinitely. This
their associated systems and infrastructure, we
technology portfolio complements a wide range of
can occur only if lower carbon-emitting tech-
must begin the process without delay.
possible national and international policies, includ-
nologies are deployed worldwide.
mentary, or specialized research.
role in stabilizing concentrations, but are currently funded at minimal levels.
ing trading, taxes, and other policies and measures.
A broad portfolio also can reflect the diversity
of the energy system. Technologies are needed to improve the efficiency of energy use, develop noncarbon energy sources, and limit the free venting of carbon from the fossil energy that will continue to be burned. 6
7
Emissions limitations and controlling costs complement a technology strateg y.
Increase global investments in energy research and development.
Improve the implementation and performance of energ y research and development.
Reflect the international nature of the research challenge.
Emissions limits are needed to stabilize
Increase investment in energy research and
Incorporate climate change when revisiting cur-
Develop and coordinate international and
concentrations. Without such limits, individual
development to improve the performance of
rent energy research and development priorities.
national energy technology research and devel-
nations have little incentive to reduce green-
existing technologies and to develop the next
house gas emissions. It is unlikely that the
generation of technologies that are required to
Better coordinate the roles of the public and pri-
required technologies to achieve stabilization
stabilize greenhouse gas concentrations.
vate sectors in the research and development
will be developed and deployed if there is
opment strategies to take advantage of national
process to reflect their specific strengths.
scientific strengths and regional needs. Provide assistance to key developing countries
not any value placed on developing such
Develop dedicated long-term funding sources
technologies.
for energy research and development to sup-
Fund all stages of the innovation process from
ties for implementing energy research and
port the necessary technology transformation.
basic research to market deployment of the
development programs effectively and for
most promising technologies.
deploying advanced technologies.
Controlling the costs of stabilization is neces-
to build their technical and institutional capaci-
sary. The costs of stabilizing concentrations of
Direct investments to specific technologies that
greenhouse gases are uncertain and are distrib-
have significant potential to substantially reduce
Establish long-term goals and near-term mile-
uted unevenly across generations, nations, and
greenhouse gas emissions over the long term.
stones for technological performance to drive
sectors of the economy. Better definition and
progress and to maximize returns on technolo-
control of these costs is critical to achieving
Build broad-based public support by communi-
societal consensus to take action.
cating the climate and ancillary benefits of energy research and development.
gy investments. Design flexible research and development programs to allow for the shifting of resources to accommodate new knowledge and conditions, particularly when sufficient technological progress is not being achieved.
Next Steps
8
involved in the international discussions.
deployment, analyze in more detail key carbon-
Through periodic reports and the existing web-
However, they are only a beginning.
free resources and technologies, and expand the
site (http://gtsp.battelle.org), the program will
research to address non-carbon dioxide green-
continue to communicate insights gained
These findings and recommendations demon-
Over the next three years, the Global Energy
house gases and additional options for enhanc-
through collaborative research on the techno-
strate the importance of technology in address-
Technology Strategy Program will explore in
ing carbon sinks. The program also will conduct
logical and policy pathways that governments,
ing climate change and provide general princi-
more depth some of the key issues and princi-
technical analyses and communications efforts
businesses, institutions, and individuals can
ples for moving forward. These results will be
ples outlined here. In particular, the program
to help stakeholders and decision makers better
take to minimize the risks of human interfer-
actively communicated to all global climate
will examine approaches for improving interna-
understand principles for implementing an ener-
ence with the climate system.
change stakeholders, and particularly those
tional collaboration in technology research and
gy technology strategy for climate change.
9
The Challenge
tabilizing atmospheric concentrations
tained research to develop new technologies is essential to manage the risks of cli-
of carbon dioxide and other greenhouse
mate change, let us begin by considering
gases ultimately requires the reduction
the basic principles at work, starting with the greenhouse effect.
of global emissions to levels that are significantly below current emissions. Global
Most of the incoming solar radiation that
population and economic growth, and the
falls on the Earth is absorbed, allowing it to warm the surface. Some is radiated back
consequent increases in demand for the
toward space as heat. Rather than passing through the atmosphere to space, most of
services that energy provides, suggest that fundamental changes in the energy system will be required to achieve the reductions in
that heat is absorbed by gases in the atmosphere and redirected back to the surface where it further warms the Earth. Various constituents of the atmosphere—water
emissions needed to achieve stabilization.
vapor, carbon dioxide, methane, nitrous oxide, and minor trace gases—retain heat and create a natural greenhouse effect.
The Earth’s climate is governed primarily by complex interactions among the sun,
The heat-trapping property of these green-
oceans, and atmosphere. To clarify why sus-
house gases is well established, as is the role of human activities in the buildup of
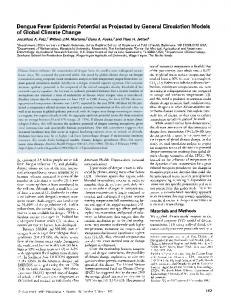
Factors Driving Emissions 1200
Changes in population, per capita income, energy intensity, and carbon dioxide intensity can be totaled up to calculate changes in emissions. Since 1950, population and per capita income increases have exceeded decreases in energy and carbon intensity, leading to an increase in carbon dioxide emissions. Each of these trends is projected to continue through the 2 1st century under the International Panel on Climate Change’s (I P CC) IS92a scenario, resulting in significantly increased emissions in 2 100.
1000 Carbon Emissions 800
GDP per Capita Population
600 400
Carbon Intensity Energy/GDP
200 0 -200
10
-400 1950
1975
2000
2025
2050
2075
2100
11
these gases. Uncertainty remains about
Convention. It entered into force under inter-
with climate change should be cost-effective
when and how significantly we might be
national law on 21 March 1994.
so as to ensure global benefits at the lowest
affected by the resulting intensified green-
possible cost.” Within this Framework, they
Distribution of Global Greenhouse Gas Emissions in 1989
house effect. However, global climate
The FCCC establishes both a short-term aim
agreed to adopt national policies and take cor-
change poses significant risks that we need
and a long-term objective. In the short term,
responding measures to mitigate (moderate or
to be prepared to manage.
the Convention directs developed countries
lessen) climate change. The mitigation meas-
to take actions aimed at returning emissions
ures involve limiting the Parties’ anthropogenic
Other
of greenhouse gases to their 1990 levels by
emissions of greenhouse gases and enhancing
15%
the year 2000. The ultimate objective, con-
carbon sinks worldwide.
Framework Convention on Climate Change
tained in Article 2 of the FCCC, is that the
Concerns about possible changes in climate
concentrations of greenhouse gases in the
induced by a rapid increase in greenhouse
atmosphere should be stabilized “at a level
gases from human activities led nations
that would prevent dangerous anthropogenic
worldwide to sign the United Nations
interference with the climate system.” The
Framework Convention on Climate Change
stabilization is to be achieved “within a time-
(FCCC). The Convention was drafted for sig-
frame sufficient to allow ecosystems to adapt
nature at the United Nations Conference on
naturally to climate change, to ensure that
Environment and Development, held in Rio
food production is not threatened, and to
de Janeiro in 1992. Since then, 186
enable economic development to proceed in
nations—including the United States, Japan,
a sustainable manner.”
most of Western Europe, the Russian
The Role of Carbon Dioxide and Energy Use
Total Fossil Fuel 56%
Agriculture Land Use 29%
Carbon dioxide emissions comprise the majority of humanity’s annual contribution to greenhouse gas concentrations. The majority of these carbon emissions result from energy use. Although all greenhouse gases are important, this document focuses on efforts to control carbon dioxide emissions. The other gases will
The majority of greenhouse gas emissions are associated with energy production, transforma tion, distribution, and end use. The remainder are produced by agriculture, land-use changes (including deforestation), and other sources including industrial processes that produce spe cialty chemicals such as chlorofluorocarbons (CF Cs), hydrofluorocarbons (H FCs), perfluorocar bons (PFCs), and sulfur hexafluoride.
be the subject of future research efforts by the
Federation, and many of the rest of the
In addition, the Parties to the Convention
nations of the world—have ratified the
agreed, “that polices and measures to deal
Global Energy Technology Strategy Program. Carbon dioxide has been accumulating in the atmosphere at an accelerating rate since the
Stabilization of GHG Concentrations—At What Level?
start of the Industrial Revolution. Increases in carbon emissions from energy use have resulted in corresponding increases in concentra-
Science has not determined the level of concentration of greenhouse gases (GHG) in the
tions. Stabilizing the concentration of carbon
atmosphere that would have to be avoided to “prevent dangerous anthropogenic interfer-
dioxide in the atmosphere requires reversing
ence with the climate system,” as mandated by the FCCC. Accordingly, we have per-
the current trend of increasing emissions.
formed the analyses presented in this report for levels ranging from 350 ppmv (parts per million volume) to 750 ppmv. Although the numerical results presented in the report’s graphics vary depending on the concentration level analyzed, the qualitative insights hold across the various targets. To simplify the presentation, we sometimes present results for only one concentration target, 550 ppmv, rather than for a range of levels. The choice of 550 ppmv was not based on any evaluation of the criterion laid out by the FCCC.
Concentration Ceilings and Cumulative Emissions The relationship between carbon emissions and concentrations is governed by the global exchange of carbon among the oceans, vegetation, and the atmosphere. One relatively
Tonnes and Joules Most people think of weight in terms of kilograms or pounds, and consider quantities of energy in terms of litres or gallons of gasoline, barrels of oil, or kilowatt-hours of electricity. Because global energy use dwarfs personal ener gy use, less widely known measures are often used. In this document, we consis tently present energy in joules, mega joules (million joules or in mathematic notation, 106 joules), or exajoules (1 018 joules). Weights are presented in tonnes (metric tons).
1 tonne = 1 metric ton = 1000 kilograms = 2204 pounds 1 exajoule = 1018 joules = 163 million barrels of oil equivalent
straightforward way to relate emissions and 12
13
Factors Driving Carbon Emissions
concentrations is to calculate the cumulative emissions that would be allowable (over the next three centuries) to achieve each concentration target. In other words, each con-
energy needed to produce a unit of economic output, and carbon intensity means the amount of carbon released
lative emissions budget. For a 450-ppmv ceiling, the cumulative budget is approxi-
ing policies to control emissions. According to
Using this equation, it is possible to
mately 1,225 billion tonnes of carbon. For a
an equation developed by Yoichi Kaya, direc-
project future emissions based on pro-
550-ppmv ceiling, the budget is about 1,800
tor of the Research Institute of Innovative
jections of the four factors. For example,
3
billion tonnes, and for a 650-ppmv ceiling, it
Technology for the Earth and a member of the
if population were to double over the
2
is approximately 2,350 billion tonnes.
Global Energy Technology Strategy Program’s
next century and the other three fac-
1
Steering Group, the global increase in carbon
tors—economic growth per capita, ener-
0
The concept of a cumulative emissions
dioxide emissions since the Industrial
gy use per dollar of income, and the role
budget yields two insights. First, cumulative
Revolution is a byproduct of four interrelated
of fossil fuels in supplying energy serv-
emissions matter much more than the level
factors: (1) population growth, (2) per capita
ices—did not change, carbon dioxide
of emissions in any single year. A second
economic development, (3) reliance on
emissions would double.
key insight relates to the magnitude of the
increased energy use to fuel this economic
challenge that we face in limiting concentra-
growth, and (4) the dominance of fossil fuels
Most scenarios of the future suggest
350
tions. Even if annual global emissions of car-
in providing this energy. Expressing this con-
that the expected increases in popula-
340
bon dioxide were to remain indefinitely at
cept as an equation yields the following:
tion and economic growth will out-
330
weigh the continued decreases in
320
energy and carbon intensities. For
310
example, a plausible scenario would
300
be a doubling of population over the
290
centuries.
Emissions Trajectories Consistent With Various Atmospheric CO2 Concentration Ceilings
Population growth rate + per capita economic growth rate + energy intensity growth rate + carbon intensity growth rate = growth rate in carbon dioxide (CO2) emissions
for each unit of energy produced.
next century combined with continued annual economic growth rate of 1.8
tors did not change, then a 12-fold increase
750 ppmv
in carbon dioxide emissions would occur
650 ppmv
during the 21st century.
550 ppmv
0
-5
6 5 4
Carbon Dioxide Concentrations 370
280 270
percent in per capita income, resulting times the current size. If the other two fac-
IS92a
Land-use Change
360
in a global economy in 2100 that is 12
20
Fossil-fuels
7
future carbon emissions is critical to develop-
atmosphere would continue to increase for
5
8
centration target has a corresponding cumu-
tonnes, the concentration of carbon in the
10
9
Understanding the key drivers of historic and
their 1990 level of approximately 7.5 billion
15
Global Carbon Emissions
Energy intensity refers to the amount of
Increases in global carbon emissions over the past 150 years, driven primarily by increased use of fossil fuels for energy, have led to consequent increases in the concentration of car bon dioxide in the atmosphere.
would be accomplished through improve-
450 ppmv 350 ppmv
Any concentration ceiling can be attained through an unlimited set of possible global emission paths. The paths pictured here are ones designed to limit the economic impact of achieving the target concentrations—thereby achieving the twin goals of the FCCC of stabi lization at the lowest economic cost. For con centrations 350 ppmv and ab ove, global emis sions rise for a period of time, peak, and then begin a long decline.
With these population and economic growth
ments in the amount of energy used to cre-
rates, the only way to stabilize concentra-
ate a dollar of economic output (energy
tions of greenhouse gases at any level that
intensity), and part through dramatically
is currently under serious discussion would
reducing carbon emissions from the energy
be to reduce the carbon emissions per dol-
sector (carbon intensity). In other words,
lar of economic output to less than one-
population and economic growth will lead
twelfth of their current value, more than a
to rising emissions unless a fundamental
92 percent reduction. Part of this reduction
technological change occurs. 15
Increasing Population Global population continues to increase, although the rate of growth is declining. In 1999 it reached 6 billion people. IPCC estimates developed in the early 1990s suggested that global population could increase to almost 18 billion by 2100. More recent estimates are somewhat more modest, but follow the same basic patterns. For example,
Uncertainties in Future Scenarios
Global Population
the most recent United Nations estimates for 2050 range from a low of 7.3 billion to a high of 10.7 billion, with 8.9 billion currently considered as most likely. By 2100 the global population could climb to 15 billion people, or it could begin a decline by midcentury that would eventually bring it back close to present levels.
the growth rate per capita were slowed to 1.8 percent annually (two-
20
thirds of the rate during the past 50
18 16 14 12
IS92f
years), it would still result in a six-fold
IS92a,b&e population
increase in per capita goods and serv-
IS92c,d
ices over the next century.
Historic
10
Declining Energy Intensity
8
In some developed countries—France,
6
Germany, and Japan, for example—popula-
4
tions are already in decline. The population
2
of the United States continues to grow, but
0 1850
immigration is an important factor con-
Commercial energy intensity typically increases for a period of time and 1900
1950
2000
2050
2100
The initial increase in energy use per
Global population has grown consistently over the past 150 years. Most scenarios predict continued, but slower, growth over the next 100 years.
tributing to that growth. Certainly, rates of growth are in decline across a broad spec-
dollar of real goods and services produced is caused by the shift from
trum of nations. But total population, driven Forecasting changes in population,
by growth in developing countries, contin-
economic growth, and energy tech-
ues to rise.
nology over the course of a century is fraught with uncertainties. The Intergovernmental Panel on Climate Change (IPCC), established by the
Expanding Economic Growth
United Nations Environment
as well as the shift from agricultural
IS92d
to manufacturing economies. In later
IS92a & b
development stages, the value of new
IS92f 50
goods and services grows faster than
IS92c Historic
the energy needed to provide them.
60
Meteorological Organization in 1988,
faster rate than population. Since the late
30
developed an extensive set of future
1940s, national economic growth has been
scenarios for use in its Second and
measured in terms of “gross national prodproduced by residents of a nation during a
The cause is a shift away from high energy-intensive products such as steel toward less energy-intensive
20
goods and services.
10 0 1950
For the United States, the peak in 1975
2000
2025
2050
2075
2100
energy intensity occurred around
IS92 because the SRES was available
year. Gross world product is calculated by
only recently. Even so, the ranges of
summing the gross national products of
the IS92 and SRES scenarios are
individual nations, adjusting for differences
similar. And, regardless, all of the
in currencies. Today’s world economy is
over the last three decades. For exam-
scenarios envision substantial
more than five times larger than it was in
ple, from 1973 to 1986, US economic
economic growth over the next centu-
1950, and per capita income has grown at
growth over the last 50 years. Developing
growth in excess of 40 percent was accompa-
ry and consequently require dramatic
2.7 percent annually during that period.
countries such as China and India continue
nied by no increase in energy use.
The global economy has historically grown much more rapidly than global population. Most scenarios project continued growth, slowing as more developing countries mature.
1920. Since then, US energy intensity has declined, sometimes dramatically
to grow rapidly, both in absolute terms and
reductions in carbon per unit of
16
IS92e 70
The world economy continues to grow at a
SRES scenarios respectively. We used
dung, and straw to commercial fuels,
80
Programme and the World
uct”—the total value of goods and services
nonmarketed energy such as wood,
Economic Growth Per Capita
40
Third Assessment reports – IS92 and
then declines as a country develops.
economic output in order to stabilize
Like population growth, economic growth is
on a per capita basis. Most projections for
Global energy intensity is declining, with the
concentrations of carbon dioxide.
slowing in developed countries, which are
the next century suggest a slowing in the
reductions in the developed countries exceed-
the nations that provided much of the
growth of the world economy. But even if
ing the increases in some developing coun17
Global Energy Intensity 18
Global energy intensity has declined for the past 50 years, with decreases in developed countries outweighing increases in develop ing countries as they make the transition to commercial fuels. Most scenarios suggest that this factor will continue to decline, per haps substantially.
16 14 12
6 4 2 0 1950
hand, if oil and gas resources ulti-
30
mately are restricted to conventional forms, then coal and its synthetic
25
derivatives may become increasingly important, and the decline in average
20
carbon intensity could reverse.
10 8
Carbon Intensity
decline still further. On the other
IS92c
tries. It is expected to continue to decline
IS92d
in the future as the energy intensities of
IS92f
more developing countries begin to
IS92e
decrease.
IS92a & b Historic 1975
2000
2025
2050
2075
2100
Declining Carbon Intensity
Future Carbon Emissions Combining these four factors can provide insights into how the future might evolve in the absence of a
10
IS92e IS92a IS92b
5
IS92c IS92d Historic
0 1850
carbon policy. The IPCC prepared
Changes in Geographic Diversity of Emissions
Fossil fuels differ in the amount of carbon that
such an analysis for use in its
is released for each unit of energy produced.
Second Assessment Report.
Coal is more carbon-intensive than oil, and
The IPCC scenario IS92a (the most
natural gas has the lowest carbon intensity of
commonly cited scenario) assumes a
all of the fossil fuels. Technologies such as
world population growing from 5.2
developed world. In 1900, Western Europe and
billion in 1990 to more than double
and hydropower generate no direct releases
that number in 2100, moderate eco-
30
North America accounted for 87 percent of the
of carbon.
nomic growth, and no strong action
25
Developing countries, on the other hand,
best known as the “business-as-
to produce energy has declined over the past
15
accounted for only 1 percent of global emis-
usual” scenario or the “reference
century. In 1860, the average was about the
sions in 1900, but their share had grown to 39
emissions path.” This IS92a scenario
10
same as wood. By 1920 it had fallen to about
percent by 1995.
shows nearly a threefold rise in total
the rate associated with coal. By 1990, the
emissions during the 21st century.
level as oil. The higher carbon intensity of the
economies that provide their people with mate-
Current emission trends suggest that
coal used in 1990 was balanced by the lower
rial goods and services, the need for energy
the emissions increases envisioned in
carbon intensity of the natural gas, nuclear,
services will increase. The developing countries’
IS92a or even in the higher emissions
and renewable energy that were increasingly
share of global emissions will pass 50 percent
scenarios are plausible. However,
coming into use.
trend is not destiny. A sustained effort
world’s growing demand for energy.
2100
IS92e IS92f IS92a IS92b IS92d IS92c
5 0
As more and more countries develop
to remain the energy source of choice for the
2050
20
The average carbon intensity of all fuels used
abundant and reasonably priced, they are likely
18
35
1995, their share had fallen to 39 percent.
and continue to grow. If fossil fuels remain
2000
40
nuclear fission, nuclear fusion, wind, solar,
average rate had declined to about the same
1950
Fossil Fuel Carbon Emissions
Emissions were once limited largely to the
to reduce carbon dioxide emissions—
1900
Carbon intensity fell over the past 150 years as society switched from wood to coal to oil and gas. The introduction of nuclear and largescale hydroelectric power has contributed significantly to the reduc tions in intensity over the past few decades.
Wood is more carbon-intensive than coal.
world’s fossil fuel carbon dioxide emissions. In
IS92f
15
The I P CC Second Assessment Report developed a set of possible sce narios for future carbon emissions in a world without carbon policy intervention. The more recent set of Standard Reference Emissions Scenarios (SRES), developed for the Third Assessment Report, cover roughly the same range of emission futures.
to improve the performance of existCarbon intensity may continue to decline in
ing technologies and to develop and deploy
report describes in more depth the nature of
the future. If natural gas turns out to be abun-
new energy technologies can halt and
this technological challenge and the charac-
dant and renewable energy technologies con-
reverse this trend, leading to lower emis-
teristics of a technology strategy for limiting
tinue to improve, the average intensity could
sions in the future. The remainder of this
emissions. 19
Energy Today and Tomorrow
he energy system today is dominated
Prior to 1900, most goods and services were produced with the use of energy from ani-
by fossil fuels, which are abundant and
mals, wood and other biomass, and early relatively inexpensive. Carbon dioxide
forms of hydropower. The Industrial
emissions resulting from the use of fossil fuels
Revolution and the growth in the world’s energy use were made possible by harness-
are responsible for most of the projected
ing ever more powerful and denser forms of energy. Wood was surpassed by coal, which
human influence on climate. Today, coal is the
was predominant from the late 1800s
primary energy resource in the two most
through the late 1960s. Oil, driven primarily
populous countries in the world, India and
by the increase in demand for transportation, has been the predominant fuel since then.
China, and is likely to fuel their future economic development. Accordingly, tomorrow’s
During the latter half of the 20th century,
energy system also will be dominated by fossil
large-scale hydroelectric, natural gas, and nuclear power were added to the energy
fuels in all likelihood. Achieving fundamental
mix. Renewable technologies such as solar and wind power have only recently come
change in the energy system is a slow process,
into use, but to date they have had a mini-
requiring coordinated changes in energy
mal impact on the overall picture.
supply, conversion, distribution, and end use.
As the production of goods and services has grown worldwide, so too has the global use of energy. In
Global Energy Production and Consumption 450 400
Wood Nuclear
350
Hydro
exajoules. Since then, energy use
300
Coal
has grown steadily to almost 400
250
exajoules in 1995.
200
1850, global energy use was about 9
Natural Gas Oil
150 100
Historically, the global energy system has been dominated by carbon-emitting fuels—first wood, then coal, and now oil.
20
50 0
21
Energy Today Today’s energy system—the supply, conversion, transport, and end-use of energy—is dominated by fossil fuels. Of the energy used in 1995 worldwide, 88 percent was supplied by fossil fuels and only a small fraction—12 percent—was provided by nonfossil energy sources such as nuclear, hydroelectric, solar, and wind power. Although virtually all of global transportation needs are fueled by fossil energy, the elec-
mate, economy, and political standing vis-àvis energy-rich neighbors. Traditionally, for
electricity in1995 was generated using nonfossil energy. Use of natural gas, another fossil fuel, is growing rapidly—both in direct uses and in electricity generation. Natural gas provided 19 percent of the world’s energy in 1995, representing a larger percentage than all of the commercial nonfossil energy sources combined. Countries around the world differ in the types of energy they use. This diversity in the energy mix is governed by differences in
Biomass
ent, relying almost exclusively on its exten-
Solar Nuclear
sive coal resources to meet its internal ener-
for transportation has increased. On the other hand, two of its neighbors, Korea and Japan, lack significant indigenous energy
1600
Coal Natural Gas
1200 1000
Oil
800
Hydro
gy requirements—although petroleum imports have begun to rise as the demand
AOG 1800 1400
example, China has been energy-independ-
600
IS92a
400 200
350
0 1990
300
1800
supplies.
150
1600
certain is that the future will prove different from any nontrivial predictions made today. On a regional basis, energy use will continue to be influenced by available energy resources, existing technologies, and the mix of energy services needed. However, regional fuel choices also will be
2050
2065
2080
2095
2065
2080
2095
1200
50
1000
0 1990
2005
2020
2035
2050
2065
2080
2095
800 600 400
Forecasting the future composition of the risky business. The only thing that is almost
2035
1400
100
energy industry 100 years from now is a
2020
CBF
200
Energy Tomorrow
2005
250
resources and import most of their energy
tricity sector uses more diverse sources of energy. Approximately one-third of global
Global Energy Use Today and Tomorrow
indigenous fuel resources, land area, cli-
Under the IS92a scenario, global energy use is projected to increase in the future. A key uncer tainty that affects the evolution of this energy system is the future price and availability of oil and gas. This figure shows projected energy use under two future resource scenarios. In one plau sible future, lower grades of oil and natural gas would become available at approximately current prices—the Abundant Oil and Gas (AOG) scenario. In another plausible future, liquid and gaseous fuels will have to be produced from coal and commercial biomass. In that case, which we call the Coal Bridge to the Future (C BF) scenario, the price of energy would be higher, resulting in lower overall demand.
200 0 1990
2005
2020
2035
2050
Resulting fuels mixes for the two energy resource scenarios are similar for 2025, but very different for 2100. The scenarios are similar in 2025 because much of today’s energy producing and using capital stock may still be operating in 2025, which limits change from the present, and because the resource constraints on oil and gas are just beginning in the C B F case. Both resource scenar ios suggest major changes in the energy system over the next 100 years even in the absence of climate policies.
influenced by public policies, such as environmental regulations, energy subsidies in
Fossil Fuel Availability
the form of low prices, and foreign invest-
future emissions: population growth, eco-
ment in energy supplies, which are harder to
nomic growth, energy intensity, and carbon
project. Even the restructuring and privatiza-
intensity. If the past is any guide, the
Energy resource surveys indicate that the
tion of electricity and natural gas markets
demand for energy services, which is a func-
world has more than enough fossil fuel
around the world may affect the energy mix
tion of population growth, economic
resources to supply the energy needs of the
significantly in the future, by changing the
growth, and energy intensity, will increase
21st century. Coal dominates the fossil fuels
fundamental dynamics of energy capital
dramatically. Given the current dominance of
that are readily available using current con-
investments.
fossil fuels, future carbon intensity will be
ventional methods of extraction.
strongly influenced by the availability of
22
To look forward a century, we consider again
fossil fuels over the next century and
Most of the world’s coal resources are locat-
the four fundamental factors influencing
their price.
ed in a small number of countries. In 1998, 23
Former Soviet Union & Eastern Europe
Western Europe & Canada 350
350
Regional Energy Use Today and Tomorrow: Growth, Structural Change and Diversity
300 250 200 150 100
Biomass
50
Solar Nuclear
0
Energy choices around the world will vary depending upon indigenous energy resources, energy and environmental policies, national security issues, and technical capacity. This graphic shows possible energy development paths for nine regions of the world for the IS92a scenario. The story overall is one of growth, fundamental fuel shifts, and significant diversity across regions.
Coal Natural Gas
300 250 200 150 100 50 0
Oil
Hydro
USA
China & Centrally Planned Asia
350
350
300
300
250
250
200
200
150
150
100
100
50
50
0
0
Latin America
Japan, Australia & New Zealand
350
350
300
300
250
250
200
200
150
150
100
100
50
50
0
0
Middle East
Africa
24
South & East Asia
350
350
350
300
300
300
250
250
250
200
200
200
150
150
150
100
100
100
50
50
50
0
0
0
25
the United States, China, the former Soviet
clathrates) represent the bulk of the remain-
ral gas occurred primarily because it is more
few decades. Achieving the fundamental rev-
Union, and India produced 3,195 million
ing energy resources. With anticipated tech-
cost-effective and cleaner than oil and coal.
olution of the global energy system required
short tons, or 63 percent, of the global total
nological improvement, even these currently
coal production of 5,043 million short tons.
unconventional sources are likely to become
Changes in energy use have been slow
will require multiple changes. For example,
The United States, China, and the former
cost-competitive with nonfossil energy
because the energy system is complex
switching from petroleum to electricity, hydro-
Soviet Union possess the majority of the
sources. Unconventional energy deposits are
(involving myriad decisionmakers) and
gen, or another fuel for transportation will
world’s coal resources. Adding fewer than a
more evenly distributed among countries
because it is capital intensive. A shift to a
require designing and producing vehicles that
dozen additional countries would account
than conventional fossil resources are. For
new fuel requires changes not only in
use these fuels—and, more importantly, put-
for more than 95 percent of the total coal
example, virtually every nation with a coast-
investment and the technology to extract the
ting in place the complex supporting infra-
resources.
line has natural gas in the form of gas
fuel, but also in the technology to transport
structure.
hydrates.
it, store it, convert it to useful forms, and
Unconventional oil (including oil found in
distribute it to end-users, as well as changes
shales, tar sands, and heavy oils) and
Even if conventional oil and gas resources
unconventional gas (including gas found in
prove to be limited, coal resources are virtu-
deep formations, tight seams, and
ally unlimited. Increases in the cost of ener-
Fundamental changes in power generation
gy will be limited ultimately by the cost of
can occur more rapidly because electric utili-
transforming coal into liquids and gases—a
ties can shift fuels without requiring any
cost that is relatively well understood. Fossil
changes on the part of end-users, who are
fuel energy therefore will be available and
still receiving the same electricity, no matter
may well be cost-competitive for the next
what the fuel source is. In the 1970s and
century and beyond.
1980s, nuclear power represented a large
Carbon Reservoirs and Fossil Fuel Resources 45,000 40,000 35,000 30,000
Atmosphere Vegetation above ground Conventional oil and gas Coal Unconventional oil and gas
25,000 20,000 15,000 10,000 5,000 0
Conventional coal resources are abundant enough to meet the world’s energy needs for the 21st century and beyond. The amount of carbon stored in conventional coal resources and in unconventional oil and gas is many times the amount currently stored in the atmosphere and in vegetation. If these resources are used in con junction with current technologies, they could increase the concentration of carbon dioxide in the atmosphere significantly.
26
to stabilize greenhouse gas concentrations
in the end-use technology.
proportion of the additions in capacity. In
Changing the Energy System
the United States, natural gas, which in 1978
Fundamental shifts in the energy system
ation due to perceived shortages, is currently
have occurred very slowly. They have been
the fuel of choice for capacity additions.
was outlawed for use in new electric gener-
driven principally by the demand for new energy services and the availability of supply.
In any case, the speed of these transitions
Oil, which has been in use since at least the
was limited not only by the availability of
1850s, did not surpass coal as the predomi-
new technologies but also by the demand
nant global fuel until the 1960s. Its growth
for new energy equipment. A new car is pur-
was very slow until transportation demand
chased when consumers decide they need
started to grow rapidly around the middle of
to replace their old cars or need an addition-
the 20th century. Natural gas, which has
al vehicle; a new generating technology is
been used in small amounts since the early
employed only when it becomes cost-effec-
1800s, did not become a significant fuel
tive to replace the old plant or regulations
source until seamless tubing became avail-
force a change.
Four Long-Term Questions The need for a major change in the energy system raises four long-term questions: (1) Will different regions of the world require different energy systems and, if so, what are they? (2) Specifically, what portfolio of new energy technologies is needed to build those systems? (3) When will those new technologies be needed? (4) Given the long time frame necessary to change the energy system, how do we make the transition away from carbon-emitting energ y technologies?
Although the fundamental technology chal-
able in the 1940s, allowing for low-cost, long-range transport. Unlike oil, where the
Completing a major transformation in the
lenge is clear, the path forward is less appar-
increased usage was driven by the demand
energy system takes time. Oil is expected to
ent. In the chapters that follow, we begin
for new energy services, the growth of natu-
remain the leading global fuel for the next
the exploration of some of these questions. 27
Technology Needs
With substantial increases in the global demand
nergy technology will play a critical
for energy services expected over the next cen-
role in future emissions, both with and with-
tury, energy technology holds the key to effective limitation of greenhouse gas emissions. As
out climate policies. The most frequently
described in the last chapter, carbon-based
cited scenario of the future assumes substan-
fuels and their associated technologies supplied
tial improvement in energy technology, which
88 percent of the world’s energy in 1995. Over the coming decades, technologies that are car-
will require R&D breakthroughs. Stabilizing
bon-free will compete in the global market-
concentrations will require even greater tech-
place with ever-improving fossil fuel technolo-
nological change. Since technological change
gies. How successfully they compete will determine future emissions.
takes time, the nations of the world will need
The Intergovernmental Panel on Climate
to start now. Technology research should
Change (IPCC) in 1992 developed six peer-
focus on the two channels through which
reviewed descriptions of possible future emis-
almost all energy flows: electricity generation
sions paths in a world with no climate policies. The one that is most often cited is the middle-
and conversion of fossil fuels.
of-the-range scenario, generally referred to as the IS92a scenario.
Technology Assumptions in the IPCC IS92a Scenario The IPCC’s IS92a scenario assumes that significant technological change will take place under a “business-as-usual scenario,” that is, a world without climate policy. The following are examples of the IPCC’s energy technology assumptions: •
75 percent of electricity in 2100 will be
scale that exceeds the total global energy
generated from nonfossil sources com-
use in 1975.
pared to roughly 33 percent in 1995. •
• 28
•
End-use efficiency in all sectors and
57 percent of energy needs in 2100 will
regions will improve at 1 percent per year.
be supplied by fossil fuels—down from 88
This assumption implies a 45 percent
percent in 1995.
improvement in energy efficiency in all
Biomass energy in 2100 will be used at a
sectors and regions by 2050. 29
In summary, the IPCC’s central scenario
possible for increasing amounts of wealth to
will double and moderate economic growth
assumes major improvements in technology
be generated per unit of energy used, while
22
will continue, resulting in a 12-fold increase
that will require significant future research
enabling carbon intensity to fall as well. Yet,
20
in the global economy during the 21 centu-
breakthroughs and fundamental shifts in the
even under the advanced technology
18
ry. Combining this economic growth with
energy system toward carbon-free fuels.
assumptions of IS92a, emissions will contin-
16
the scenario’s assumed shift toward more
Some have questioned whether these tech-
ue to grow.
14
efficient use of energy (declining energy
nology assumptions are realistic or optimistic,
intensity) and toward carbon-free energy
but the more salient question is: “Even if we
They will increase at a significantly slower
sources yields a 3-fold rise in emissions.
achieve the IPCC’s assumptions, will that get
rate than they would have without the tech-
6
us to stabilization?”
nology developments envisioned by IS92a.
4
Nevertheless, under the IS92a scenario, the
2 0 1990
st
The IS92a scenario also assumes substantial improvements in the efficiency of power
Technology is improving and can be expected
concentration of carbon dioxide will rise to
plants that use fossil fuels. At the same time,
to continue to change in a way that makes it
more than 700 ppmv by the end of the 21st
despite marked efficiency improvements in
The Future With and Without Technological Change
fossil technology, the scenario envisions a world in which carbon-free technologies such as wind, solar, biomass, nuclear, and hydropower will become sufficiently cheap relative to fossil fuels that they will supply 75 percent of global electricity by the end of the century, up from approximately a third in 1995. Overall, fossil fuels are assumed to supply 57 percent of energy needs in 2100, substantially down from the 88 percent share these fuels held in 1995.
40
The middle curve in the first chart depicts the carbon dioxide emissions associated with the Intergovernmental Panel on Climate Change (I P CC) central scenario, denoted IS92a, and the middle curve in the second chart represents the concentrations in the atmosphere that result from these emissions. This I P CC “business-asusual” scenario incorporates significant techno logical advances. In contrast, while the top curves assume the same population and eco nomic growth as IS92a, they hold energy tech nology constant at its 1 990 level. The difference between the upper and middle curves thus illus trates the technological improvement needed merely to achieve the IS92a emissions path with its corresponding impact on concentrations. The lower curves depict an emissions path and its corresponding concentration path consistent with a 550 parts per million volume (ppmv) con centration ceiling. The dotted line on the con centrations chart indicates the pre-industrial level of carbon dioxide concentrations (i.e., a level virtually unaffected by human activities).
IS92a (1990 technology) IS92a 550 ppmv constraint
35 30 25 20
10 8
IS92a 550 ppmv constraint 2005
2020
2035
2050
2065
2080
5 2010
2030
2050
2070
2090
The gap refers to the difference between future emissions based on IS92a technologies and an emissions path that would achieve a 550-ppmv concentration target. Achieving this stabilization emissions path would require even greater use of advanced technologies than is assumed in IS92a.
under the IS92a scenario and those needed
nologies become widely accepted and eco-
for stabilization. Substantial development of
nomically competitive. New technologies
energy technologies is necessary to achieve
often vie for supremacy. For several decades,
the IS92a goals, and even greater develop-
the internal combustion engine was only
ment and deployment is needed to achieve
one of many options that competed to
stabilization.
become the power plant of the automobile.
Changing Energy Technologies—Development and Deployment
ered by electricity.
Energy capital stock is often long-lived. Deployment of new technology can be slowed by the rate at which existing equip-
Carbon Dioxide Concentrations
Shifting the dominant fuels that run the
ment is retired. Much of the technology and
energy system from wood to coal, oil, and
infrastructure that supplies our energy servic-
natural gas took decades, even centuries.
es is long-lived. It is not unusual for a power
(See “Changing the Energy System” in
plant to be in service for more than 50 years,
700
Chapter 3.) The shifts were slow because of
and the transmission and distribution infra-
600
the time needed to research, develop, and
structure may be even longer-lived. Existing
500
deploy individual technologies, and because
technologies will likely remain in place even
of the intricacies of the energy system.
if their operating costs are higher, because
1100 1000 900 800
IS92a (1990 Technology) IS92a 550 ppmv constraint preindustrial
400 300
switching to newer technologies requires
200 100 0 1990
2095
A significant number of early cars were pow-
15
0 1990
and will continue rising.
The "Gap"
12
gies that are anticipated to come into use
50 45
century—nearly triple the preindustrial level—
Thus, a gap emerges between the technolo-
Carbon Emissions
10
30
The Technology Gap
The IS92a scenario assumes that population
2010
2030
2050
2070
2090
R&D takes time. Innovation and demonstra-
capital expenditures. Even in rapidly develop-
tion can take decades before the new tech-
ing countries, new technologies may be slow 31
Transportation in France
to gain acceptance due to a limited capacity to install and maintain advanced, relatively
100%
high-priced technologies.
replacing an entire energy infrastructure.
60%
Changing an energy technology may require a complex changeover in the supporting
40%
infrastructure. The automobile, for example, was not an overnight success. A long series
20%
geted technology strategy. Unless one of the channels becomes dominant in the future, a
TGV Air Cars Buses 2-Wheelers Railways Horses Waterways
Despite an increasing diversity of fuel sources
technology needs of both types of energy flow.
and energy uses, the world’s commercial energy still makes its way through two channels:
And the technological needs of the two chan-
electric power generation for stationary uses,
nels may be quite different. Approaches for
and refining and processing for mobile uses.
taking carbon out of electricity production and distribution can be implemented without
Stationary energy technologies such as power
affecting end-use technologies. In other words,
plants, industrial facilities, and office buildings
the same light bulb can be used whether the
friendly. Fueling stations had to be designed
often are large in scale. These stationary facili-
electricity is generated by a coal-fired power
and constructed. Roadside restaurants and
ties can use boilers, large-scale turbines, and
plant that has no carbon scrubbing technology
large electrical motors. They can use a variety
or by a coal-fired power plant that does have
of fuels, including oil, coal, natural gas,
carbon scrubbing. Conversely, approaches for
hydropower, and nuclear fuel.
taking the carbon out of transportation are
of investments in supporting technologies was needed. Roads had to be made auto-
other services had to be built. In cases where broad changes in infrastruc-
Walking 0%
In France, it took 50 years for the automobile’s share of passenger transport to rise from 1 percent to 50 percent. The speed of change was limited by technology, societal preferences, and the time required to develop a supporting infrastructure of roads and gasoline stations.
likely to require not only changes to refining
ture are not required, the effect of improvements in technology can be much more
Mobile energy technologies, on the other
and conversion techniques, but also funda-
rapid. For example, fuel switches in power
these efforts, energy intensity in the United
hand, are dominated by the internal combus-
mental changes in automobiles, service sta-
States fell 42 percent between 1970 and
tion engine and have become restricted to oil
tions, and the rest of the transport
1999, continuing a pattern of decline
as the power source. The technologies needed
infrastructure.
observed since the 1920s.
to support these end-uses include oil wells,
generation can occur more rapidly than economy-wide switches in fuels because electric utilities can make the shift without requiring any changes on the part of endusers, who are still receiving the same elec-
Technical capacity development is neces -
tricity, no matter what the fuel source is.
sary to achieve global deployment. New
ocean and land transport, refineries, and inter-
The structure of the energy system thus gives
nal combustion engines.
us two areas to focus on, but it also gives us few clues about which technologies will be
technology is useful only to those who are
The fact that almost all energy undergoes
needed to fill the gap. The next section
End-use technology efficiencies can improve
capable of using it productively and maintain-
either conversion to electricity or refining and
addresses this crucial question.
quite rapidly as well. For example, the aver-
ing it. A key limiting factor in the global
age fuel economy of new US automobiles
deployment of technology is the lack of insti-
doubled between 1975 and 1985; the aver-
tutions and strategies for spreading these
age electricity use of new refrigerators will
capabilities.
have dropped by more than two-thirds by
32
processing is important for developing a tar-
climate technology strategy has to address the
80%
Changing a single technology may require
Focusing the Search for New Technologies
2001, compared with the mid-1970s.
In summary, developing new technologies,
However, the rate of improvement in overall
bringing them successfully to market, and
energy efficiency is still limited by stock
improving them over time are processes that
turnover. Government efficiency standards,
can consume years to decades. Since it will
direct financial incentives, and R&D (both
take time to achieve the fundamental changes
public and private) were all needed to
to the energy system that are required to sta-
achieve a substantial slowing in the growth
bilize concentrations of greenhouses, we must
of US energy use. Partially as a result of
start to develop the needed technologies now.
Oil Natural Gas Gas Hydrates Coal Biomass Fission Fusion Geothermal Hydro Solar Wind
Global Energy Flows Through Two Channels Refining, Processing & Synfuels
Final Energy To: Transportation
Electricity Production
Residential/ Commercial Industrial
Primary commercial energy flows through two channels to meet an ever-increasing array of end-use demands.
33
Technology Portfolio
evelopment of new technologies and improvement in existing technologies can control the costs of stabilization. A broad portfolio of investments is needed to manage
A technology investment portfolio must accommodate several key uncertainties: uncertainties in climate science, uncertainties about future policies, technological uncertainty, and fundamental uncertainties about the energy resource base. In addition, a portfolio
future uncertainties about climate science,
must be broad enough to include the range
economic development, the price and
of technologies needed to address all major
availability of energy resources, and public policies that are implemented to address the climate issue. The portfolio must be broad to accommodate the diversity in regional technology needs and to address all major
sources of carbon dioxide emissions and to reflect diverse regional technology preferences. The important future uncertainties are formidable. For example, as the 21st century evolves, we will gain a better understanding of the science of climate change, and the risks
energy flows. R&D priorities should be
that it presents. We will learn what policies
revised periodically to reflect new knowledge.
nations will choose to implement in order to limit greenhouse gas emissions. We will find out whether oil and natural gas will remain abundant and inexpensive for the next century
Climate change is a complex issue that
or through only part of it. We will discover
involves many countries, a number of deci-
whether current concerns about nuclear
sion-makers, and a myriad of possible
power technology can be addressed. We will
responses. A strategy for addressing climate
learn whether carbon capture and storage will
change will have several elements, of which
be acceptable from both economic and envi-
technology is just one. From a technology
ronmental perspectives.
perspective, managing the risks of climate
34
change requires making investments in
In the face of all these uncertainties, it is clear
research projects that are most likely to
that society cannot adopt a plan today and
improve our understanding of the roles that
follow it over the next 100 years. Actions can
specific technologies might play in reducing
and will be modified as the decades pass. A
the costs of stabilizing concentrations and in
global energy technology strategy will need to
a broad-based portfolio of the technologies
be adaptable. Society will need to act, then
that are most likely to achieve that objective.
learn, and then act again. 35
Technology Improvements Dramatically Reduce the Costs of Stabilization
Value of Solar Photovoltaic Technology Improvement
could be reduced by about $1.5 trillion. Clearly, failure to invest in the improvement of existing technologies that can reduce 5,000
Countries around the world are implementing a
4,000
number of individual strategies for reducing near-term greenhouse gas emissions, such as
3,000
promoting energy efficiency to reduce energy 2,000
consumption, expanding the use of currently available renewable energy technologies and developing flexible policy instruments (e.g., emissions trading) that will allow technological innovation to occur where it is most cost effective. Although efforts employing currently available technologies can slow the growth of emissions, considerable technology advancement is needed to reduce the cost of making these near-term emission reductions and the much larger reductions required to stabilize concentrations. In the previous chapter, we presented two technology variants of the IS92a scenario: one with technology frozen at 1990 levels and the other
Value of IS92a Energy Technology Improvement
1,000 450 550 650 CO2 750 Concentration Level (ppmv)
3 1
4
6
0
Cost Reduction (Cents per kWh)
The value of reducing the cost per kWh of solar photovoltaics from a reference value of 9 cents per kWh can be calculated for a range of stabilization targets, holding all other technologies at reference prices and efficiencies. The value of technology improvements in solar increases as the stabilization target tightens. This value pattern across targets would not necessarily hold for all technologies. Some technologies might have high value when only moderate reductions are required, but lesser value if more stringent reductions were required.
0.0
450
550 CO2 Concentration Level (ppmv)
650
750
The value of technology advances can be calculated by comparing the costs of stabilization with the IS92a technologies to the cost of stabilization with no technological advances. The value, expressed here in terms of present value of cost reductions divided by the present value of gross world product, is substantial for all concentration targets analyzed.
36
4,000
costs of stabilization substantially.
3,000 2,000
Similarly, successful investments in technologies that are not yet in widespread commer-
1,000
450
cial use, such as those to sequester carbon
550
by storing it in soils or to capture and store
650 CO2 Concentration Level (ppmv)
carbon from fuels or power plants, can save literally trillions of dollars in the cost of addressing climate change. Whenever a key technology is taken out of the portfolio, the cost of stabilization increases significantly. For example, the value of adding soil carbon sequestration to the complete suite of carbon capture and sequestration technologies available to stabilize at 450 ppmv is about $1.1 trillion. Removing all of the carbon cap-
concentration levels analyzed.
0 750
Soil Carbon Sequestration Only Central Power Plant Sequestration Only Central Power Plant & Hydrogen Production Capture & Sequestration All Types of Carbon Capture and Sequestration
The value of having carbon sequestration tech nologies available to help achieve stabilization can also be calculated. Calculations were made both for individual classes of technology and for combinations of these technologies. In combina tion, the individual technologies compete for market share so that the value of the combination is less than the sum of the values calculated for individual technologies. Integrated analysis like this is critical for assessing technology value.
The evolving understanding of climate sci-
nario. The value of this technological improve-
A Technology Investment Portfolio
ence may either increase or reduce the pressure for emission reductions from the energy sector. For example, improved understanding
Achieving the necessary technological
of the roles of various greenhouse gases
advances requires investments in a number
other than carbon dioxide in affecting cli-
Improvements in the price and performance
of technologies at different stages of devel-
mate or additional information on the possi-
of currently commercial technologies can save
opment. An investment portfolio needs to
bilities for carbon sequestration could signifi-
literally trillions of dollars in the cost of
include a broad array of technologies to be
cantly affect research priorities.
addressing climate change. For example, if
able to deal effectively with critical future
solar power could be developed that cost 3
uncertainties and to cope with the range of
A diversified portfolio also accommodates
cents per kilowatt-hour (a 6 cent per kWh
technologies in the energy system and the
uncertainties about future energy
reduction from the reference value of 9 cents
diversity of regional technology preferences.
resources. At present, we cannot forecast
1.0 0.5
hydropower, would increase the potential
nologies assumed under the IPCC’s IS92a sce-
IS92a is almost 1.5% of gross world product.
1.5
5,000
than triples the cost of stabilization for all
1990 technology to those assumed under
2.0
power, wind, biomass, nuclear, and
incorporating the dramatically improved tech-
concentration target, the value of moving from
2.5
emissions, such as end-use efficiency, solar
ture and sequestration technologies more
ment can also be estimated. For a 550 ppmv
Value of Carbon Capture and Sequestration Technologies
whether oil and natural gas resources will be
and a price which is competitive with today’s electricity sources), the global cost of stabiliz-
A diversified portfolio accommodates
confined to conventional sources because of
ing atmospheric carbon dioxide at 550 ppmv
evolving knowledge about climate science.
technology limitations or whether technolog37
ical advances will enable unconventional fos-
are deployed to limit carbon dioxide emis-
the additional emissions that would have
The diversity in indigenous energy resources,
sil resources to become accessible at prices
sions. Carbon capture and sequestration
occurred during the production of that sec-
energy services required and demands for
comparable to current costs.
from hydrogen production would play a
ondary energy source (e.g., using less gasoline
them, and a number of non-economic
much smaller role in the CBF case, but bio-
derived from coal).
issues affect the technologies that might be
In one plausible future, lower grades of oil
mass production would play a greater one.
and natural gas would become available at
In summary, different possible energy resource
lization. A technology investment portfolio
approximately current prices—the Abundant
The graphic shows a relatively small direct
futures argue for investing in a broad range of
must have the flexibility to address these dif-
Oil and Gas (AOG) scenario. In another plau-
effect of energy conservation in the CBF
technologies.
ferences in geography, energy resources,
sible future, liquid and gaseous fuels will
case, but the indirect effect would be much
have to be produced from coal and commer-
larger in the form of reduced demand for
A broad portfolio can control costs.
cial biomass. In that case, which we call the
energy services. Because end-use energy
Investments in a wide range of technologies
Coal Bridge to the Future (CBF) scenario, the
would be more expensive under the CBF
are needed to accommodate uncertainty in
A flexible portfolio can accommodate
liquid and gaseous fuel prices would be high-
scenario than under AOG, people would be
the outcome of research and development.
alternative policy responses to the climate
er. The only difference between these plausi-
motivated to implement a wide range of
We will encounter dead ends as some tech-
issue. A technology strategy is consistent with
ble futures is whether coal, oil, or natural gas
conservation measures. For example, since
nology paths turn out to be too costly or unre-
a wide range of possible national and region-
will be the most inexpensive fuel choices.
much of the end-use energy under the CBF
alizable, and almost certainly breakthroughs
al climate policies, including standards, taxes
model would be either electricity or synthet-
will be achieved that cannot possibly be antic-
and trading. A flexible investment portfolio
This uncertainty, however, drives important
ic liquid and gas derived from coal, conserv-
ipated. The key challenge in exploring techno-
can change as policies evolve. For example,
differences in the mix of technologies that
ing emissions at the point of use also avoids
logical routes to a stabilization goal is to fund
the stringency of carbon emissions limitation
enough research to determine whether the
policies will affect the value of carbon and
approach is practical, yet be willing to termi-
accordingly, the fundamental economics and
nate the research if neccessary. The technolo-
potential competitiveness of technologies.
gy strategy should provide practical guidance
This may lead to substantial changes in R&D
on how to initiate and terminate focused
investment priorities over time. The goals of
research efforts. Although having additional
the investment portfolio should also evolve to
technologies available always makes sense
reflect the impacts of broader changes in poli-
from an analytical standpoint, there must be a
cies that could affect the climate issue indi-
winnowing process to recognize real-world
rectly (e.g., controls on other air pollutants or
budget constraints.
on urban growth).
A portfolio can meet the differing needs of
A broad portfolio also can reflect the
key regions. Technology needs vary from one
diversity of the energy system. The diversity
country and region to another. For example,
of the energy system suggests that innovation
India has considerable potential to produce
is needed in a wide array of technologies.
modern commercial biomass, but China does
Improvements are needed in the overall effi-
not. China has significantly greater space heat-
ciency of energy use as well as in efforts to
ing needs than India. Neither country, both of
limit the free venting of carbon from the ener-
which have rapidly growing economies and
gy that is used. Efforts to remove the carbon
energy demands, faces exactly the same chal-
should focus on the two channels through
lenges as the United States, Europe or Japan,
which commercial energy flows – electricity
whose economies are more mature.
generation and fuel refining and processing.
Technologies that Could Fill the Gap Under Different Energy Resource Futures
Abundant Oil and Gas (AOG) 25,000 20,000 15,000 10,000
Shown in Million Tonnes of Carbon
5,000 0
Coal Bridge to the Future (CBF) 25,000 20,000 15,000 10,000 5,000 0
Conservation Soil Carbon Sequestration Synfuel-Carbon Capture and Sequestration Carbon Capture and Sequestration from Hydrogen Production Central Power-Carbon Capture and Sequestration Solar and Hydro Nuclear Biomass 550 ppmv Emissions
38
used in a country or region to achieve stabi-
These figures illustrate the effect of energy resource uncertainty on the portfolio of technologies that could be used to reduce emissions from the I P CC’s mid-range projection of the future to a 550 ppmv stabilization path. In the AOG future, conventional oil and gas remain available at approxi mately current prices. In C B F, energy prices increase leading to additional enduse efficiency improvements and to increased use of coal for the production of syn thetic fuels. Technologies are chosen in the analysis based upon their relative prices and availabilities. These figures identify only the technologies chosen to reduce emissions from the IS92a path to a stabilization path. As noted earlier, sub stantial technology improve ments are required to move from a 1990 technology path to the IS92a path.
technical capacity, culture, institutions, and economic systems.
39
Technologies that Could Fill the Regional "Gaps"
Removing carbon from transportation will
associated with technology deployment and
require fundamental changes in personal
can provide an indication of the adequacy of
vehicles, possibly so that they operate on
funding. In addition, this type of assessment
carbon-free fuels such as hydrogen. Shifting
can assist in the important objective of halt-
2000
to hydrogen as a fuel would require the
ing inquiry into technologies that have failed
1500
development of methods to produce large
to realize their initial promise.
Shown in Millions of Tonnes Carbon 5000 4000 3000 2000
China
1000 0
2500
Conservation Natural Gas & Oil Substitution Soil Carbon Sequestration Synfuel-Carbon Capture and Sequestration Carbon Capture and Sequestration from Hydrogen Production Central Power-Carbon Capture and Sequestration
1000
India
Solar and Hydro
500 0
Nuclear Biomass 550 ppmv Emissions 500
2500
400
USA
300
500 0
A series of global and regional analyses conStrategy Program have assessed literally
1200 1000
The priorities for technology investment will
ited, it would make sense to invest in all of
1400
800 200
Japan
ment of a fueling infrastructure.
tem also would require new fuel transport
Reassessment of Technology Investment Priorities
1600
1500 1000
and storage technologies and the develop-
Technologies That Fill the Gap
bon to the atmosphere. A new transport sys-
ducted by the Global Energy Technology
3000
2000
amounts of hydrogen without venting car-
100
Western Europe
0
600 400 200 0
st
hundreds of technologies that may help fill the technology gap. If resources were unlim-
change as the 21 century evolves.
those technologies. Given that funding is
Technology investments must be reviewed
limited, however, a detailed analysis of spe-
on a regular basis to incorporate new infor-
cific R&D paths is needed to determine
mation. Some of the information, such as
those of greatest importance.
fuel costs and availability and the concentra-
These figures illustrate one possible portfolio of technologies for moving from the I P CC’s midrange projection of the future to an emissions path leading to stabilization of concentrations at 550 ppmv. Five regions are presented. These regions represent the majority of today’s emissions of carbon dioxide and are projected to represent the majority of emissions for the foreseeable future. The estimates are provided by the Global Energy Technology Strategy Program’s regional collaborators. The top line in each region
denotes regional emissions under the IS92a scenario. The gray regions denote the emissions paths that minimize the cost of achieving a concentration target of 550ppmv. Emission reductions are made where most economic, with no regard to the critical issue of who pays for these reductions. These figures highlight the technologies needed to reduce emissions from the IS92a path to a stabilization path. As noted earlier, substantial technology improvements are required to move from a 1990 technology path to the IS92a path.
tion target chosen to meet the Framework
As demonstrated above, it is critical to con-
Convention’s ultimate goal are uncertainties
tinue to fund the improvement of currently
that will guide investment priorities, but are
commercial technologies that can help
not directly controlled by the technology
reduce carbon emissions. The rapid develop-
research effort. Technological uncertainty, on
ment and deployment of these technologies
the other hand, will be resolved only
are required in order to achieve the IS92a,
through a process of research, application,
“business as usual,” scenario and to prepare
assessment, and improvement, probably
for the next step of achieving stabilization.
requiring further research. Of the technologies that are not currently
40
One key goal of these periodic assessments
commercial, the GTSP analyses identify three
will be to evaluate how well we are doing in
technology paths that currently merit sub-
Improvements in the efficiency of energy
The next focus is to limit the free venting of
terms of the overall development and
stantially increased R&D investment to deter-
use are critical. As we have learned over the
carbon from the energy that is needed.
deployment of the technologies needed to
mine more clearly their future potential:
last three decades, economic development
Investments to develop technologies for
achieve stabilization. Specific technolog y
•
Carbon sequestration technologies
is driven by growth in energy services not by
reducing emissions from electric generation
milestones need to be developed based
•
Low carbon-emitting methods to produce
growth in energy use. Providing energy serv-
need to focus on non-fossil systems to gen-
upon integrated analysis of the energy sys-
hydrogen in combination with improved
ices more efficiently is a key element of a
erate power as well as carbon capture and
tem in order to guide this assessment. A
hydrogen storage and fuel cells
technology portfolio and helps achieve other
sequestration technologies that could allow
periodic assessment of this type can help
societal objectives.
the continued use of fossil fuels.
refocus the R&D effort, can identify issues
•
Carbon capture, transport and storage technologies 41
Carbon sequestration technologies. The
non-carbon energy sources such as fission,
overall purpose of these technologies is to
fusion, or solar electricity. To complement on-
retain or store carbon in plants, soils, and
going R&D in fuel cells, basic research into the
oceans and to develop energy sources that
most efficient ways to produce, distribute and
balance the uptake and release of carbon,
store hydrogen is needed.
for example, by producing energy from
Challenges for Today’s Commercial Energy Technologies Individuals, companies, and countries con-
with new and existing facilities and long-
sider a range of factors when making energy
distance transmission since many remain-
technology choices. Economics is very
ing hydro resources are far from population
important, but environment, safety, energy
centers.
plants. Some of these technologies have
Carbon capture, use, and storage. Current sci-
additional benefits such as restoring degrad-
entific research suggests that sustained basic
ed lands. Others enlarge the suite of options
R&D today could result in effective technologies
for producing energy regionally, such as
to capture and store carbon on a scale that
also affect investment decisions. Four key
Nuclear . Nuclear energy also supplied 6
electricity and liquid fuels from biomass.
would significantly help mitigate climate
categories of existing commercial technolo-
percent of global energy in 1995. Nuclear
change. Carbon capture, use, and storage tech-
gies face unique challenges over the coming
energy, however, faces several critical chal -
To develop current carbon sequestration
nologies would allow the continued use of fos-
decades that research can help to address:
lenges that research might help address:
technologies will require an increase in
sil fuels but would prevent carbon from being
our understanding of the carbon cycle
released to the atmosphere. Technologies to
End-use efficiency . End-use efficiency has
of radioactive wastes, and nuclear weapon
and the mechanisms by which carbon is
remove carbon dioxide from combustion flue
played and will continue to play a critical
proliferation, along with basic issues about
sequestered. Research and development is
gases are already operational at small scale, but
role in limiting carbon dioxide emissions.
its capital costs in an era of electric industry
needed to design processes to convert bio-
are expensive.
Key issues facing energy efficiency technolo-
restructuring.
concerns about safety, the final disposition
gies include technological improvement and
mass to electricity and liquid fuels efficiently and at low cost.
security, national security, and other factors
The primary question is what to do with the captured carbon dioxide. Some of it has com-
Hydrogen-based Transportation. Fuel cells
mercial value. Since the early 1970s, carbon
might power vehicles with greater efficiency
dioxide has been used in mature oil fields to
and lower emissions than conventional
enhance recovery of oil. The gas is injected into
engines. Vehicular fuel cells currently are
old reservoirs (sometimes alternating with water
being commercialized, but the onboard fuel
to increase the pressure and the flow of oil).
used is projected to be either methanol or a
creating products that consumers will
Renewables. Renewables contributed only
embrace.
a small amount of the global commercial energy supply in 1995. The challenges for
Hydroelectric generation.
Hydroelectric
renewables include cost, intermittent avail-
generation supplied about 6 percent of
ability (for solar and wind), emissions (for
global energy in 1995. There is considerable
biomass resources) and regional availability.
hydroelectric capacity around the world that
Technology improvements are needed to
has not been developed. Key challenges for
reduce costs, and advances in storage and
Other commercial uses include enhancing the
hydroelectric generation include concerns
long-distance transmission can help
liquid hydrocarbon. As long as vehicular fuel
production of coal bed methane and increasing
about the environmental impacts associated
address the availability issues.
cells are fed by carbon-based fuels, they will
the production of urea, methanol, and soda ash.
not reduce carbon dioxide emissions sufficiently to achieve stabilization. If the carbon
A large percentage of the captured carbon diox-
associated with hydrogen production were
ide could be stored in geological formations
ed relative to their potential contribution to
within the context of the overall carbon
captured and sequestered, fuel cells would
such as deep saline aquifers, depleted natural
atmospheric stabilization. They all deserve
management technology system to re-opti-
be much more effective in stemming the
gas and oil reservoirs, and coal seams. Carbon
R&D priority today, but these priorities
mize the portfolio. The need for new tech-
carbon dioxide emissions from transporta-
capture and storage are new technologies, and
should be revisited on a regular basis.
nology is clear, and guiding principles for
tion —illustrating the interdependent nature
many questions remain to be addressed
of the technologies within the R&D portfolio.
through geologic, energ y, and environmental
In summary, the key elements of a technolo-
to emerge. The question that also must be
research.
gy investment strategy involve developing a
answered is how are we doing in develop-
broad-based portfolio and revisiting it on a
ing the technologies needed to manage the risk of climate change.
Alternatively, hydrogen fed fuel cells could
42
determining research priorities are starting
be an important non-emitting source of
Based upon our analyses, these three technolo-
regular basis to determine progress. R&D pri-
energy if the hydrogen were produced from
gy paths are ones that are currently under-fund-
orities should be reviewed on a regular basis 43
Research and Development
ramatic improvements in conventional energy technologies will be required
Large-scale, integrated technologies, such as those required for atmospheric stabilization, do not simply appear in the marketplace.
just to keep atmospheric carbon dioxide
Because of their scale, it will take several
concentrations from exceeding three times
decades to achieve significant commercial
pre-industrial levels. Fundamentally new technologies will be required to stabilize concentrations of greenhouse gases at lower levels at a reasonable cost. The needed improvements in conventional technologies
application. Integration will require focused efforts during all stages of the innovation process to achieve the necessary technological breakthroughs. Continuous commitments of resources by government, industry, and universities over decades will be needed to reduce the cost of new technologies and ensure environmental acceptability.
have not yet been realized, and the development of fundamentally new technologies is not being supported at any significant level.
During the past two centuries, investments in research and development have greatly improved the performance of conventional energy production and end-use technologies. But support for energy R&D has been
The research and development challenge
episodic and driven largely by changes in
presented by climate change is novel. The
energy markets and by political dynamics.
scope extends beyond traditional energy
For example, periods of low energy prices
R&D into agricultural and environmental sci-
coupled with market and policy uncertainty
ence and technology. A great deal of inte-
are characterized by low and declining ener-
gration will be required throughout the
gy R&D efforts by both the public and pri-
innovation process, coordinating knowledge
vate sectors. Conversely, during periods of
gained from basic research and fundamental
sustained high energy prices, energy R&D
science and applying it to the development
efforts tend to increase in quantity, if not
of commercial applications and technology
efficiency. In order to produce the funda-
deployment.
mentally new technologies needed to stabilize greenhouse gas concentrations, a much more concerted and consistent R&D effort will be required.
44
45
The Innovation Process Technology innovation is a continuous process
Stages from Innovation to Use Basic Research
with several definable but overlapping stages. Technology development aimed at a specific goal requires investment and coordination at all stages. It is critical to engage both the public and private sectors in the effort in a way
Focused R&D Technology Demonstration
that recognizes the unique strengths and weaknesses of each. This chapter describes the stages of the innovation process required to address the climate goal and highlights the overlapping and interlocking roles of the public and private sectors.
Basic research. At the front end of innovation,
Technology Deployment
es in fundamental materials science can
ducing a new technology to the marketplace,
suggest new approaches for developing
experience leads to improvements and
commercial fuel cells or photovoltaics or car-
adaptation, sometimes requiring develop-
bon scrubbers. Conversely, failure to develop
ments in the supporting infrastructure.
cost-effective processes for manufacture can
Diffusion of a new technology reveals new
reduce a fundamental breakthrough to an
applications and requirements based on
interesting scientific note or stimulate a
economic and technical performance and
completely different innovation. The various
productivity standards. The new applications
stages of the innovation process inform,
suggest new goals to guide further technolo-
guide and stimulate each other.
gy development. In the context of climate change, this itera-
Technology Diffusion Technology innovation consists of a web of defin able but overlapping stages. Breakthroughs or barriers encountered in any of the stages should inform activities in the other stages.
Innovation – An Iterative Process
tive aspect of the innovation process underscores the importance of reviewing the climate technology strategy on a regular basis.
Successes and failures in one stage of the
fundamental science is critical to building the
innovation process often stimulate refocused
knowledge necessary for new technology dis-
efforts in other stages. For example, success-
coveries. The benefits of investments in basic
would benefit from advances in the biologi-
research are difficult to quantify. National gov-
cal, computational, materials, and molecular
ernments view investment in fundamental sci-
sciences, to name just a few.
ence as necessary to maintain their national security and economic and environmental
Applied research and development.
well-being. For this reason, governments are
Applied research is designed to turn the
often the principal supporters of basic
knowledge derived from basic science into
research.
useful products and applications such as biomass cropping systems, photovoltaic
46
Commercialization. In the process of intro-
For the most part, governments will have to
cells, hydrogen storage, fuel cells, battery
take the lead in funding basic research needed
technology, carbon capture and storage tech-
to address climate change because of the dif-
nologies, and highly efficient, low-emission
fuse private benefits of that kind of expendi-
vehicles. Each of these practical applications
ture and the long delays between discovery
involves the integration of a number of dif-
and application. Although a broad basic
ferent disciplines and frequently generates
research program is consistent with the need
new questions and scientific puzzles requir-
to support innovation, some fields are particu-
ing yet more basic discoveries. Once applied
larly in need of emphasis, either because of
research indicates that a practical application
cost or technical feasibility. Clearly, carbon
has a chance of succeeding in the market-
management areas such as advanced fuels
place, market-focused technology develop-
processing, carbon or hydrogen separation,
ment is required to justify substantial invest-
biosequestration, and geological storage
ments in the new technology.
Illustrative Technology Research Areas
This review process is sometimes described as act, then learn, then act again.
Public and Private Roles in Innovation Agreement is widespread that government’s role is to fund the pre-competitive research that produces general societal benefits and supports public
Advances in many areas of research may be needed to achieve stabilization. This figure suggests a few for each stage of the innovation process.
policy goals. Industry has the
Market Oriented Research
incentive as well as the production, service,
Energy Supply Energy Conservation Carbon Capture & Transporation • Fuel Transformation/H2 Production • Process Control & Distribution • Gasification Combined Cycle Gas Turbines
Applied Research • PNGV Car • Fuel Cells • Carbon Separation • H2 Storage • Biomass Cropping • Carbon Storage • Battery Technology • Wind Turbine Technology
• Nanotechnology • Molecular Sciences • Materials Sciences
Basic Research • Advanced Carbon Separation Materials
• Biological Sciences • Combustion Sciences • Computational Sciences
47
and marketing skills needed to take a new
findings from an extensive Pacific Northwest
rates for R&D leaders such as the pharma-
product or technology from the laboratory
National Laboratory study of R&D funding
ceutical, computer and communications
to the marketplace. Consequently, industry
are not encouraging.
industries.
product moves closer to commercialization
Every year, the public and private sectors
Resources for energy R & D are declining.
and technology issues begin to involve the
devote billions of dollars to energy R&D, rep-
Resource commitments are an imperfect
manufacture of specific products for com-
resenting a significant investment. Still, those
yardstick for measuring the benefits of ener-
petitive markets.
billions represent only a small fraction of the
gy R&D. Nevertheless, it may be significant
global economy and of the world’s total
that almost 96 percent of the industrialized
Private industry tries to complement and
investments in R&D. We have been able to
world’s public energy R&D is conducted in
leverage the public energy research portfolio.
document less than $15 billion annually
only nine developed nations.
And the public R&D agencies are increasingly
invested in the development of improved
looking to industry for market guidance.
energy technologies by the world’s govern-
Moreover, data from 1985 to 1995 suggest
Despite successes such as the search for
ments and private firms. Although the US
that both public and private investments in
clean coal technologies and the efforts made
commitment is one of the world’s largest, it
energy R&D are clearly declining. Between
by the Partnership for a New Generation of
represents less than 0.05 percent of US
1985 and 1995, public sector investment by
Vehicles in the US, coordination between
gross domestic product and less than 2 per-
the nine Organisation for Economic Co-oper-
public and private sectors can be and will
cent of all R&D conducted in the US. Private
ation and Development (OECD) countries
have to be significantly improved to address
energy R&D investments in the US, United
that undertake such research decreased by
the climate technology development issues.
Kingdom and Netherlands represent less
23 percent in real terms. More recent data
than 1 percent of total sales for utilities as
points to a continuation of these reductions.
takes on greater R&D responsibility as the
Achieving the public sector goal of stabilizing the atmosphere at a reasonable cost requires a dramatic improvement in existing commercial technologies, plus development and deployment on a global scale of new technologies that do not yet have a commercial market. Clearly defining the roles of the public and private sectors in addressing this complex issue appears to be impossible, but the general principles provide guidance. Atmospheric stabilization is a public goal, and both the programs needed to spur technology innovation and the necessary basic research are the responsibility of the public
technology and integrate it with existing con-
48
for US industry and 8-10 percent investment
will have to integrate research in many differ-
The United States and Japan together finance approximately 75 percent of
ent fields of science and technology and
Energy R&D Funding is Declining
throughout the three stages of the innovation process: basic research, applied research, and
5.5
commercialization. Together they must create
5.0
a goal-oriented technology development pro-
4.5
gram that links basic research to the needs of
4.0
applied research, and supports practical devel-
3.5
opment and deployment.
Global Investments in Energy Research and Development
sector. Deployment remains a primary responsibility of the private sector.
compared to a 3 percent R&D to sales ratio
ventional energy technologies. These sectors
will be required to develop the required new
locate, compile and interpret. However, the
vate sector investments in energy R&D
1995
in the US declined 67 percent in real terms. These reductions equate to nearly $3.5 billion less spent per year in 1998 ate new advanced environmentally pre-
2.0
ferred electric generation technologies
1.5
have been particularly hard hit by these
1.0
reductions.
0
research and development are difficult to
1985
than in 1985. Programs designed to cre-
ing the new technologies needed to manage nation between the public and private sectors
1985-1998. During the same period, pri-
2.5
.5
the risk of climate change? Data on energy
US government fell by 23 percent from
3.0
How then are we doing in terms of develop-
Significant consultation, planning, and coordi-
global energy R&D. Investment by the
The reasons for these declines range Total public funding of energy research in the OECD is falling. Although Japan’s outlays increased slightly, US spending declined and leading European nations reduced their funding dramatically.
from governmental budgetary pressures to low energy prices, greater competition in energy markets, and market 49
Energy R&D Portfolios of Selected OECD Countries in 1995
uncertainty brought about by efforts to create more competitive energy markets. Some argue that reduced funding is a poor measurement of progress, since the R&D process
these investment figures suggest
their national requirements and global
and methane hydrates also figure to be
needs by cooperating internationally in fund-
important technologies in filling the global
ing and conducting R&D. Cooperation and
technology gap. Yet these technologies
coordination are essential to make best use
receive less than 2.5 percent of the global
Fossil
of society’s limited resources for addressing
investment going into energy research and
Fusion
the climate issue.
development.
Energy R&D is not climate-focused. Finally,
The recent trends in energy R&D spending
in almost every major area of energy R&D,
stand in stark contrast with the technology
research programs focus on short- and
needs to manage the risk of climate change.
medium-term applications rather than on
If this funding trend continues, the likelihood
the fundamental knowledge that will be
of realizing the technologies embodied in the
required to develop advanced technologies.
IS92a scenario goes down. Accordingly, the
For example, in some of the analyses pre-
likelihood of stabilizing concentrations
sented earlier, 60 percent of the reductions
declines even farther. The following section
required to fill the global emissions “gap”
describes actions that will be required to sta-
just a few decades from now come from
bilize concentrations of greenhouse gases in
increased use of biomass and carbon
the atmosphere.
Other Energy 2.5
Energy Conservation
2.0
of the magnitude of the challenge posed by climate change, however,
sequestration. Fuel cells, hydrogen systems,
3.0
may simply have become more efficient in recent years. In the context
ments are missing opportunities to meet
Nuclear Fission 1.5
Renewable
1.0
reason for concern. .5
The Japanese government’s R&D spending actually grew between
0
1985 and 1998 by 1 percent. Looking behind the numbers, more-
United States
Japan
Canada
Europe
over, reveals that Japan’s nuclear fission and fusion programs comprised approximately 75 percent of its public R&D portfolio. Japanese private sector energy R&D investments in electric
The composition of documented energy investments varies widely between public and private sectors within countries and also varies widely across countries. To sim plify the figure, an aggregate portfolio is presented for the European Union and its member countries (Germany, the United Kingdom, the Netherlands and Italy).
Global Energy R&D Investments in 1995
power generation technologies have recently begun to decline modestly as Japan moves
gies, reducing the potential to leverage limit-
to create a more competitive energy market.
ed resources. As governments throughout the industrialized world deregulate their gas
The trends were even more pronounced in
and electric utility sectors, they are creating
European nations. In Germany, Great Britain,
an incentive system that encourages private
and Italy, public sector investments in ener-
energy R&D to focus increasingly on short-
gy R&D declined anywhere from 75-90 per-
term, proprietary projects. At the same time,
cent between 1985 and 1995. Where data
the government energy R&D sector is trying
are available for these country’s private sec-
to create programs (often with the hope of
tor energy R&D investments, there is evi-
private sector cost sharing) to deal with
dence that programs designed to create
broad and diffuse public benefit issues. In
new, lower carbon emitting generation tech-
this environment, the challenge is to deter-
nologies are suffering in this funding envi-
mine the appropriate roles for public and
ronment.
private entities in creating the needed, new technologies.
Energy R & D is uncoordinated. At the
50
national level, another trend that is cause for
Similarly, at the international level, coordina-
concern is the investment of public and pri-
tion between nations is minimal. Climate
vate resources in different energy technolo-
change is a global problem. Yet govern-
Total Only 2.5 percent of the global energy R&D investment is targeted at a suite of new technologies that could play a significant role in sta bilization. This is not to say that continued investment in other crit ical emission-reducing technolo gies is not important, but rather to emphasize the need to understand more clearly the true potential of these new technologies.
Selected Technologies
14
14
12
12
10
10
8
8
6
6
4
4
2
2
0
0 Other Energy Energy Conservation Fossil Fusion Nuclear Fission Renewable
Carbon Capture and Sequestration Fuel Cells & Hydrogen Systems Soil Carbon Sequestration Biomass Methane Hydrates
51
Conclusion
continued growth in energy demand, future
research and development will succeed. There
fuel and energy technology choices will be a
will be failures. However, a broad portfolio, fre-
key determinant of the magnitude of future
quently revisited to minimize losses in unpro-
human influence on the climate.
ductive areas of inquiry, provides insurance against multiple potential outcomes in science
The ultimate goal of the Framework Convention
and policy and can address diverse regional
on Climate Change—the stabilization of concen-
technology needs.
trations of greenhouse gases in the atmoshe Global Energy Technology Strateg y
phere—requires that global carbon emissions
The technological challenge in stabilizing green-
peak and ultimately decline to zero. Moving
house gas concentrations is clear. Society can
from an energy system dominated by technolo-
address this challenge. However, if recent
advances are critical to achieving the ultimate
gies that freely vent carbon dioxide to the
trends in global energy research and develop-
objective of the Framework Convention on
atmosphere to one that significantly limits car-
ment funding are not reversed, meeting the
bon dioxide emissions requires a fundamental
challenge will be exceptionally difficult. Global
change in technology choices. Meeting that
investments in energy research and develop-
challenge, while controlling cost, requires major
ment are declining. Japan’s commitment
innovations that increase the efficiency of ener-
increased modestly since the 1980s; the US
gy use, remove obstacles to the wider use of
effort has declined over the same time period,
current carbon-free energy technologies, and
and the public investments in energy research
lead to the development and deployment of
and development by the European Union have
new technologies that are not currently
declined precipitously.
Program concludes: (1) energy technology
Climate Change, the stabilization of concentrations of greenhouse gases in the atmosphere, (2) current energy R&D investments are inadequate to meet this technological challenge, and (3) a global energy technology strategy will
ses conducted over the past three years, and puts forward recommendations for policymakers to consider in devising a technological response to the climate issue.
The Challenge
help achieve the needed technology advances, complements other global or regional climate
The future evolution of the energy system is
In addition, it is not clear that climate change is
central to the climate issue. Emissions of car-
This technological innovation must accommo-
playing an important role in determining R&D
policies, and is robust in the face of future
bon dioxide from the energy sector comprise
date important uncertainties. Uncertainties exist
investment priorities. For example, minimal
uncertainties. As an initial step forward, we
the largest human contribution to greenhouse
in many key areas: the concentration level ulti-
investments are being made in new technolo-
gases in the atmosphere. If historic trends con-
mately required to achieve the objective of the
gies that may play an important role in stabiliz-
tinue, future population and economic growth
FCCC and other aspects of climate science,
ing concentrations in the long term. It will be
will outpace improvements in energy efficiency,
global and regional technology needs, the
difficult, if not impossible, to develop technolo-
resulting in continuing growth in the demand
future price and availability of fuels, and the
gies capable of addressing the climate issue
for energy.
structure of regional and international policies
unless society makes a commitment to
adopted to address climate change.
research and development commensurate with
identify key elements to guide the development of a technology strategy.
52
deployed in the market at an appreciable level.
The Global Energy Technology Strategy Program
Currently, fossil fuels provide approximately 88
combines technical analyses from Battelle and
percent of the world’s energy and are dominant
A diverse technology investment portfolio can
research collaborators around the world with
throughout the global economy. Fossil fuel use
address these, and potentially other, uncertain-
What follows are elements of a strategic vision
the expertise of a diverse group of senior repre-
dominates every major sector. Fossil fuels pro-
ties. A broad array of technology development
that are important to improving the perform-
sentatives from the public and private sectors
vide 97 percent of the energy for the trans-
pathways spurred by research and development
ance of existing technologies and developing
and from nongovernmental organizations. This
portation system and approximately 65 percent
investments can provide society with the flexi-
the new generation of technologies that will be
chapter characterizes the fundamental chal-
of the world’s electricity, although nuclear and
bility to respond to changing conditions while
needed to stabilize concentrations of green-
lenge that the climate issue poses for the ener-
hydroelectric generation are responsible for
accommodating evolving circumstances. This
house gases in the atmosphere.
gy sector, summarizes the findings from analy-
nearly a third of the electric power supply. With
does not imply that every investment in energy
the objective of the FCCC.
53
Key Findings Stabilizing concentrations of greenhouse gases in the atmosphere requires fundamen
-
•
tal change in the energy system.
needs of key regions. Countries will need
stabilizing concentrations, but are currently
of carbon dioxide in the atmosphere would
and employ different technologies based
funded at minimal levels.
grow to more than 2.5 times pre-industrial
on their geography, indigenous resources,
levels by 2100.
and economic, social, and political
Technology breakthroughs can reduce the
systems.
cost of greenhouse gas stabilization
Emissions limitations and controlling costs
issue. Carbon dioxide emissions from the
reduce the annual cost of stabilizing
issue. A technology portfolio complements
complement a technology strateg y.
production and consumption of fossil fuels
atmospheric concentrations of greenhouse
a wide range of possible national and
are the largest contributor to human
gases by at least 1-2 percent of global world
international policies, including trading, taxes,
concentrations. Without such limits,
emissions of greenhouse gases. Fossil fuel
product. The savings will depend upon the
and other policies and measures.
individual nations have little incentive to
resources are abundant, and, if used in
concentration target and the level of
A broad portfolio also can reflect the
reduce greenhouse gas emissions. It is
conjunction with present energy technology,
technology improvement.
diversity of the energy system. Technologies
unlikely that the required technologies to
It is time to get started. The energy system is
are needed to improve the efficiency of
achieve stabilization will be developed and
concentrations of greenhouse gases in the
capital-intensive, and the development and
energy use, develop non-carbon energy
deployed if there is not any value placed on
atmosphere substantially.
deployment of new technologies can take
sources, and limit the free venting of carbon
developing such technologies.
If present trends continue, carbon dioxide
decades. Given the lead-time necessary to
from the fossil energy that will continue to
emissions from energy will continue to grow.
develop and deploy new technologies with
be burned.
The influences of future population growth
their associated systems and infrastructure,
and economic development on the demand
we must begin the process without delay.
•
for energy services are likely to exceed currently projected improvements in energy
A portfolio of technologies is necessary to
intensity and the ongoing transition to less
manage the risks of climate change and to
carbon-intensive fuels. However, trends are
respond to evolving conditions.
not destiny—a global technology strategy could help change the present course.
In order to stabilize concentrations of
and economic conditions, combined with
• Emissions limits are needed to stabilize
•
Controlling the costs of stabilization is necessary. The costs of stabilizing concentrations of greenhouse gases are uncertain and
Current investments in energy research and
are distributed unevenly across generations,
development are inadequate.
nations, and sectors of the economy. Better definition and control of these costs is
• Energy research and development outlays
critical to achieving societal consensus to
are declining. Both public and private
take action.
sector investments in energy research and development have declined significantly
uncertainties. Changing scientific knowledge
since the 1980s. •
Energy research and development
Increase global investments in energ y research and development.
uncertainty in the resource base, requires a
expenditures are unfocused and poorly
diversified initial portfolio of technology
coordinated. Neither public nor private sector
development to improve the performance of
investments. Portfolio investment priorities
investments are adequately focused on the
existing technologies and to develop the
will evolve over time as these uncertainties
technologies that could be critical for
next generation of technologies that are
evolve or are resolved.
stabilizing concentrations in the long term.
required to stabilize greenhouse gas
A broad portfolio can control costs. A
Among the few governments with national
concentrations. A fundamental restructuring
portfolio encompassing a broad suite of
energy research and development programs,
of the energy system will be extremely
technologies can lower the costs of
investments are poorly coordinated and fail
difficult without significant investments in
stabilization significantly. However, the
to take advantage of possibilities for joint,
energy research and development.
Although incremental technology improve -
public and private sectors cannot fund every
complementary, or specialized research.
ments are essential, they will not lead to
idea. Technology investment priorities must
stabilization. Even with significant improve-
carbon emissions must peak during the 21st century and then decline indefinitely. This can occur only if lower carbon-emitting technologies are deployed worldwide. • Technology breakthroughs are essential both to stabilize greenhouse gas concentrations and to control costs.
ments in the performance of existing 54
•
• A diversified portfolio accommodates future
greenhouse gases in the atmosphere, global
•
A flexible portfolio can accommodate alternative policy responses to the climate
have the potential to increase the
•
•
Recommendations
dramatically . Technological advances can
• Energy is central to the climate change
•
commercial technologies, the concentration
•
• Increase investment in energy research and
•
Develop dedicated long-term funding
Terrestrial sequestration, hydrogen, and
sources for energy research and develop -
be established to reflect available funding.
carbon capture, use, and storage technolo -
ment to support the necessary technology
A broad portfolio can meet the differing
gies potentially play an important role in
transformation. Climate change is a 21st
•
55
century problem. Long-term challenges often
fundamental science is essential to build
invest in energy research and development
tions, by examining in more detail the spe-
are given inadequate attention in annual
knowledge for technological breakthroughs,
should be adjusted and coordinated to
cial issues facing the transportation sector,
processes that allocate resources. Dedicated
while industry plays a greater role as
support more promising technologies
and by conducting additional analyses to
funding sources for energy research and
technology moves closer to market.
consistent with national interests and
improve understanding of the value of spe-
Fund all stages of the innovation process
objectives.
cific technologies.
development would ensure that adequate
•
resources are available to develop and
from basic research to market deployment
implement a technology strateg y.
of the most promising technologies.
countries to build their technical and
Extend the Technology Strateg y
Direct investments to specific technologies
Fundamental breakthroughs are likely to be
institutional capacities for implementing
The first phase of the Global Energy
that have significant potential to substantial -
derived from successes in basic research
energy research and development programs
Technology Strategy Program focused on
ly reduce greenhouse gas emissions over
in fields such as biology, combustion,
effectively and for deploying advanced
carbon dioxide emissions from the energy
the long term. A fraction of research and
computing, and materials science. Funding
technologies. Key developing countries
sector. In the next phase, the Program will
development efforts are being applied
of basic research will be required to provide
require the capability to conduct energy
broaden its scope to examine the roles of
towards a suite of new technologies that
this foundation. Resources will also be
research and development and successfully
other greenhouse gases and additional cate-
could play a key role in reducing greenhouse
required as these technologies move closer
deploy advanced technologies. Without
gories of carbon sinks in the climate issue.
gas emissions. Additional resources should
to demonstration and to market.
eventual deployment of advanced energy
We will examine both projected trends and
Establish long-term goals and near-term
technologies in the developing world,
possible technological responses.
support should not come at the expense of
milestones for technological performance to
stabilization of greenhouse gases is not
improving currently available technologies
drive progress and to maximize returns on
achievable.
that have the potential to reduce emissions.
technology investments. Resources often
Build broad-based public support by
become locked into supporting certain
communicating the climate and ancillary
technologies regardless of performance.
benefits of energy research and
Given the challenges in addressing climate
development.
change, policy-makers must establish
be devoted to these new technologies. This
•
•
•
processes that ensure this does not occur. Improve the implementation and perform ance of energy research and development. •
Incorporate climate change when revisiting current energy research and development
priorities. Current energy R&D portfolios should be revisited to ensure that they incorporate climate change as a key priority. •
Better coordinate the roles of the public and private sectors in the research and development process to reflect their specific strengths. Both sectors have key roles to
56
•
Design flexible research and development programs to allow for the shifting of
resources to accommodate new knowledge and conditions, particularly when sufficient
technological progress is not being achieved. The future is uncertain. A technology strategy must adapt to changed circumstances. Reflect the international nature of the research challenge.
•
Provide assistance to key developing
Next Steps
Investigate Implementation Issues Key recommendations from the first phase of the program emphasize the need for sustained funding of research and development
These findings and recommendations demon-
and for improved coordination of research
strate the importance of technology in address-
efforts. In the next phase of the Program, we
ing climate change and provide general princi-
will engage our team of international collab-
ples for moving forward. These results will be
orators to explore some of these issues in
actively communicated to all global climate
more depth. We will also begin to consider
change stakeholders, and particularly those
the myriad of issues associated with the
involved in the international discussions.
deployment of new technologies in develop-
However, they are only a beginning. With the
ing countries.
assistance of our steering group, funders, and international collaborators we have identified
Communicat e
general future directions, which will be refined
Through briefings, periodic reports and the
as we move forward.
existing website (http://gtsp.battelle.org), the program will continue to communicate
Refine the Technology Strateg y
insights gained through collaborative
play in all stages of energy research and
• Develop and coordinate international and
The Program’s first three years provided a range
research on the technological and policy
development but their emphases should
national energy technology research and
of important insights and raised important new
pathways that governments, businesses,
reflect their primary capabilities. For
development strategies to take advantage of
questions. In the next three years, we plan to
institutions, and individuals can take to mini-
example, agreement is widespread that
national scientific strengths and regional
refine and enhance these analyses by expand-
mize the risks of human interference with
government support of basic research and
needs. Investment portfolios of nations that
ing and deepening our international collabora-
the climate system. 57
The analyses in this document utilized MiniCAM, an integrated assessment model developed at Battelle in collaboration with scientists in the geographic regions included in the model. The model, its use in developing the technology strategy, and the future scenarios, “Abundant Oil and Gas (AOG)” and “Coal Bridge to the Future (CBF),” are described in the following publications: Edmonds, J. and M. Wise. 1998. Exploring a technology strategy for stabilizing atmospheric CO2. Economics Energy Environment. Fondazione Eni Enrico Mattei, Venice. Edmonds, J., M. Wise, H. Pitcher, R. Richels, T. Wigley and C. MacCracken. 1997. An integrated assessment of climate change and the accelerated introduction of advanced energy technologies: an application of MiniCAM 1.0. Mitigation and Adaptation Strategies for Global Change 1, 311-339. Edmonds, J., M. Wise, R. Sands, R. Brown and H. Kheshgi. 1996. Agriculture, land-use, and commercial biomass energy: a preliminary integrated analysis of the potential role of biomass energy for reducing future greenhouse related emissions. PNNL11155. Pacific Northwest National Laboratory, Washington, DC.
Figure References Chapter 1 The Future With and Without Technological Change. Sources: Pepper et al. (IS92a); Battelle (IS92a(1990 technology)); WRE 1996 (550 PPMV constraint). Energy R&D Funding is Declining. Source: Dooley 1998.
Chapter 2 Factors Driving Emissions. Sources: Data for population, gdp per capita, energy intensity and carbon intensity from sources listed later in this chapter. Distribution of Global Greenhouse Gas Emissions in 1989. Source: Wuebbles and Edmonds 1991. Emissions Trajectories Consistent with Various Atmospheric CO2 Concentration Ceilings. Source: WRE 1996. Global Carbon Emissions. Source: CDIAC website. Carbon Dioxide Concentrations. Source: CDIAC website. Global Population. Source: IIASA website (history); Pepper et al. 1992 (projections). Economic Growth Per Capita. Source: Worldwatch Institute (1999); Pepper et al. 1992 (projections). Global Energy Intensity. Source: IIASA website (history); Pepper et al. 1992 (projections). Carbon Intensity. Source: Grubler and Nakicenovic 1996 (history); Pepper et al. 1992 (projections). Fossil Fuel Carbon Emissions. Source: Pepper et al. 1992 (projections).
Chapter 3 Global Energy Production and Consumption. Source: IIASA web site.
58
Global Energy Use Today and Tomorrow. Source: Pepper et al. 1992; Battelle analysis. Regional Energy Use Today and Tomorrow. Source: Pepper et al. 1992. Carbon Reservoirs and Fossil Fuel Resources. Source: Watson et al. 1996; Edmonds and Reilly 1985.
Chapter 4 The Future With and Without Technological Change. Source: Pepper et al. 1992 (business-as-usual); WRE 1996 (550 case); Battelle analysis (1990 technologies). The Technology Gap. Source: Battelle analysis. Transportation in France. Source: IIASA website.
Chapter 5 Value of IS92a Energy Technology Improvement. Source: Battelle analysis. Value of Solar Photovoltaic Technology Improvement. Source: Kim et al. 2000. Value of Carbon Capture and Sequestration Technologies. Source: Edmonds, et al. 1999. Technologies that Could Fill the Gap Under Different Energy Resource Futures. Source: Battelle analysis. Technologies that Could Fill the Regional Gaps. Source: Battelle analysis (US, Japan, Europe); Battelle analysis in coordination with the China Energy Research Institute (China), Indian Institute for Management analysis (India).
Chapter 6 Energy R&D Funding is Declining. Source: Dooley 1998. Energy R&D Portfolios of Selected OECD Countries in 1995. Source: Dooley 2000. Global Energy R&D Investments in 1995. Source: Dooley 2000.
Figure Sources CDIAC [Carbon Dioxide Information Analysis Center]. http://cdiac.esd.ornl.gov/ Dooley, J.J. and P.J. Runci. 2000. “Developing Nations, Energy R&D, and the Provision of a Planetary Public Good: A Long-Term Strategy for Addressing Climate Change.” The Journal of Environment and Development. Vol. 9, No. 3, September 2000. pp. 216-240. Dooley, J.J. 1998 (June). “Unintended Consequences: Energy R&D in Deregulated Market.” Energy Policy. pp. 547-555. Edmonds, J., Dooley, J., and S.H. Kim. 1999. “Long-term energy technology: needs and opportunities for stabilizing atmospheric CO2 concentrations,” in Climate change policy: practical strategies to promote econom ic growth and environmental qualit y. American Council for Capital Formation, Center for Policy Research, Washington, DC. Edmonds, J. and J. Reilly. 1985. Global energy: assessing the
future. Oxford University Press, New York. Grubler, A. and N. Nakicenovic. 1996. Decarbonizing the global energy system. Technological Forecasting & Social Change 53(1):97-110. IIASA [International Institute for Applied Systems Analysis]. http://www.iiasa.ac.at/ Kim, S., C. MacCracken, and J. Edmonds. 2000. “Solar energy technologies and stabilizing atmospheric CO2 concentrations,” Progress in Photovoltaics Special Issue. Pepper, W.J., J. Leggett, R. Swart, J. Wasson, J. Edmonds and I. Mintzer. 1992. Emissions scenarios for the I PCC: an update – assumptions, methodology, and results. Geneva: Intergovernmental Panel on Climate Change. Watson, R.T., M.C. Zinyowera and R.H. Moss (eds). 1996. Climate change 1 995: impacts, adaptations, and mitiga tion of climate change: scientific-technical analyses. Cambridge University Press, Cambridge. Worldwatch Institute 1999. Vital Signs. WRE [Wigley, T.M.L., R. Richels and J. Edmonds]. 1996. Economic and environmental choices in the stabilization of atmospheric CO2 concentrations. Nature 379(6562):240-243. Wuebbles, D.J. and J. Edmonds. 1991. Primer on greenhouse gases. Lewis Publishers, Chelsea, MI.
For Further Reading Benedick, R. 2000. “Contrasting approaches: the ozone layer, climate change, and resolving the Kyoto dilemma.” In Global biogeochemical cycles in the climate system, E-D Schulze, et.al. (eds). Academic Press, San Diego. Benedick, R. 1998. Ozone Diplomacy – New Directions in Safeguarding the Planet. Enlarged edition. Harvard University Press, Cambridge, MA and London. Benedick, R. 1998(November). “Auf dem falschen Weg zum Klimaschutz?” Universitas - Zeitschschrift für Interdisziplinäre Wissenschaft 629. Benedick, R. 1998. “How to salvage the Kyoto Protocol.” Resources for the Future, weathervane . www.rff.org. Benson, S.M., W. Chandler, J. Edmonds, J. Houghton, M. Levin, L. Bates, H. Chum, J. Dooley, D. Grether, J. Logan, G. Wiltsee and L. Wright. 1999. Assessment of basic research needs for greenhouse gas control technologies. In Greenhouse gas control technologies, P. Riemer, B. Eliasson and A. Wokaun (eds). Elsevier Science Ltd. Dooley, J., J. Edmonds and M.A. Wise 1999. The role of carbon capture and sequestration in a long-term technology strategy of atmospheric stabilization. In Greenhouse gas con trol technologies, P. Riemer, B. Eliasson and A. Wokaun (eds). Elsevier Science Ltd. Edmonds, J. 1999. “Beyond Kyoto: toward a technology greenhouse strategy,” Consequences 5(1):17-28. Edmonds, J. 1999. “Future agreements.” In Economic impact of mitigation measures, Pan, J., N. van Leeuwen, H. Timmer and R. Swart. (eds). CBP, The Hague, The Netherlands. Edmonds, J. 1998. “We need some new ideas.” Climatic Change 38: 129-132. Edmonds, J., Dooley, J., and S.H. Kim. 1999. “Long-term energy
technology: needs and opportunities for stabilizing atmospheric CO2 concentrations,” in Climate change policy: practical strategies to promote economic growth and environmental qualit y. American Council for Capital Formation, Center for Policy Research, Washington, DC. Edmonds, J., S. Kim, C. MacCracken, R. Sands, and M. Wise. 1998. Return to 1990: the cost of mitigating United States carbon emissions in the post-2000 period. PNNL-11819, Pacific Northwest National Laboratory, Washington, DC. Edmonds, J., J.M. Roop and M.J. Scott. 2000. Technology and the economics of climate change policy. Pew Center on Global Climate Change, Washington, DC. Edmonds, J., Y. Shi and K. Storck 1999. Mid- and long-term strategies for technology deployment to address cli mate change in China. PNWD-3005. Pacific Northwest National Laboratory, Washington, DC. Edmonds, J., and M. Wise. 1999. “Exploring a technology strategy for stabilizing atmospheric CO2.” In International environmental agreements on climate change. Kluwer Academic Publishers. Edmonds, J., and M. Wise. 1999. “Resource endowment and mitigation costs.” In Climate change policy in Germany and the United States. German-American Academic Council Foundation. Edmonds, J., and M. Wise. 1998. “Building backstop technologies and policies to implement the Framework Convention on Climate Change.” Energy & Environment Special Issue—Climate Change Policy in Western Europe and the USA 9(4) 383-97. Izaurralde, R.C., N.J. Rosenberg, and R. Lal. 2000. Mitigation of climatic change by soil carbon sequestration: issues of science, monitoring and degraded lands. Adv. Agron. 70:1-75. Kim, S., C. MacCracken, and J. Edmonds. 2000. “Solar energy technologies and stabilizing atmospheric CO2 concentrations,” Progress in Photovoltaics Special Issue. Kinzey, B., M. Wise and J. Dooley. 1998. Fuel cells: a compet itive market tool for carbon reductions. PNNL-SA29809. Washington, DC. Logan, J., J. Edmonds and J. Kejun. 1999. China economic and environmental modeling workshop: proceedings. PNWD-SA-4619. Pacific Northwest National Laboratory, Washington, DC. Rosenberg, N.J., R.C. Izaurralde and E.L. Malone. 1999. Carbon sequestration in soils: science, monitoring, and beyond. Proceedings of the St. Michaels Workshop, December 1998. Battelle Press, Columbus, OH. Sands, R.D., T.Y. Jung and S. Jo. In press. Second Generation Model for Korea. In Energy and environment models for Korea, H. Lee and T.Y. Jung (eds). Schock, R.N., W. Fulkerson, M.L. Brown, R.L. San Martin, D.L. Greene, and J. Edmonds. 1999. How much is energy R&D worth as insurance? UCRL-JC-131205. Lawrence Livermore National Laboratory. Shukla, P.R. 1999. Technology strategy for India: modeling and analysis of energy and carbon mitigation. Indian Institute of Management, Ahmedabad, India.
59
For More Information The Global Energy Technology Strategy Program’s website provides access to the technical papers that form the basis of the analyses presented in this report. References for the Global Energy Technology Strategy Addressing Climate Change may be found on the website: http://gtsp.battelle.org.
Project Coordinators Dr. James A. Edmonds
Dr. John F. Clarke
Battelle
Battelle
901 D Street, SW, Suite 900
901 D Street, SW, Suite 900
Washington, DC 20024
Washington, DC 20024
202-646-5243 (tel)
202-646-5280 (tel)
202-646-5233 (fax)
202-646-5233 (fax)
[email protected]
[email protected]
Acknowledgment This document represents the collective effort of many individuals. In addition to the members of the Steering Group and the principal authors listed inside the front cover, we would extend special thanks to Dale Heydlauff and Gilbert Jersey for their assistance in developing the Program recommendations and in reviewing document drafts. This document was designed and produced by Melody Warford and Paul Grabhorn. Norah Davis created the initial draft document and edited the later versions. The result of their efforts is self-evident. We thank them for their excellent work and for their after-hours efforts to get this document finished on time. Jae and John
Photo Credits: Page 2: Earth images, NASA; city, Melody Warford; all other images, Department of Energy Page 8: Earth images, NASA; all other images, Department of Energy Page 10: Earth image, NASA; highway, Melody Warford Page 20: Pump jack, Melody Warford; wind mills, Paul Grabhorn; all other images, Department of Energy Page 22: Scientist, Department of Energy Page 24: Global background, NASA Page 28: Engine, Digital Stock; all other images, Department of Energy Page 34, 44, 48 and 52: All images, Department of Energy Cover: Earth image, NASA; all other images Department of Energy All photo illustrations and chart illustrations created by Melody Warford Document Design by Grabhorn Studio, Inc.
LEGAL NOTICE This report was prepared by Battelle Memorial Institute (Battelle) as an account of sponsored research activities. Neither Client nor Battelle nor any person acting on behalf of either: MAKES ANY WARRNTY OR REP RESENTATION, EXPRESS OR I MPLIED, with respect to the accuracy, completeness, or usefulness of the information contained in this report, or that the use of any information, apparatus, process, or composition disclosed in this report may not infringe privately owned rights; or assumes any liabilities with respect to the use of, or for damages resulting from the use of, any information, apparatus, process, or composition disclosed in this report. Reference herein to any specific commercial product, process, or service by trade name, trademark, manufacturer, or otherwise, does not necessarily constitute or imply its endorsement, recommendation, or favoring by Battelle. The views and opinions of authors expressed herein do not necessarily state or reflect those of Battelle.
60