veracity in big data applications. We describe a novel solution to the problem of making short term predictions (up to a few hours ahead) in absence of real-time ...
Addressing Data Veracity in Big Data Applications †
Saima Aman† , Charalampos Chelmis‡ , Viktor Prasanna‡
Department of Computer Science ‡ Department of Electrical Engineering University of Southern California, Los Angeles, CA Email: {saman, chelmis, prasanna}@usc.edu
Abstract—Big data applications such as in smart electric grids, transportation, and remote environment monitoring involve geographically dispersed sensors that periodically send back information to central nodes. In many cases, data from sensors is not available at central nodes at a frequency that is required for real-time modeling and decision-making. This may be due to physical limitations of the transmission networks, or due to consumers limiting frequent transmission of data from sensors located at their premises for security and privacy concerns. Such scenarios lead to partial data problem and raise the issue of data veracity in big data applications. We describe a novel solution to the problem of making short term predictions (up to a few hours ahead) in absence of real-time data from sensors in Smart Grid. A key implication of our work is that by using real-time data from only a small subset of influential sensors, we are able to make predictions for all sensors. We thus reduce the communication complexity involved in transmitting sensory data in Smart Grids. We use real-world electricity consumption data from smart meters to empirically demonstrate the usefulness of our method. Our dataset consists of data collected at 15-min intervals from 170 smart meters in the USC Microgrid for 7 years, totaling 41,697,600 data points. Keywords—data veracity, prediction model, smart grid
I.
I NTRODUCTION
Low cost wireless sensors are increasingly being deployed in large numbers for tracking, monitoring, and control in emerging big data applications such as in smart electric grids, transportation, and remote medical and environment monitoring. Examples of such sensors include sensors for monitoring climate features such as temperature and green-house gas measurements [8]; smart meters for measuring energy consumption [15], [9]; and loop detectors installed under pavements for recording traffic [13]. Sensor based big data applications often encounter problems with respect to availability and timeliness of data [5], where only partial data from sensors is available in real-time, and complete high resolution data is available only after certain periods. This may be due to physical limitations of existing transmission networks, such as latency, bandwidth and high energy consumption [4], or due to consumers opting out of or limiting frequent transmission of information from sensors located at their premises for security and privacy concerns [10]. For example, fine-grained electricity consumption data collected through smart meters can be used to infer activities of the consumers and also indicate the presence or absence of dwellers in the consumer premises [11]. Forecasting models in such applications often face challenges due to their assumption of data availability in real time being invalidated. While volume, velocity, and variety characterize the qualitative aspect of big data, veracity, refers to its quantitative aspect. Without addressing veracity, big
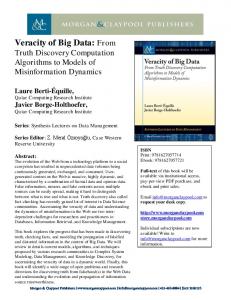
Fig. 1. In a smart grid network, data from a subset of meters (shown starred) is transmitted to the utility in real-time, whereas for the rest of the meters, it is collected locally and transmitted in batches periodically.
data solutions risk degradation in performance and inaccurate interpretation of generated insights. We describe our novel approach to address the problem of data veracity raised in the context of Smart Electricity Grids where high volume electricity consumption data is collected by smart meters at consumer premises and securely transmitted back to the electric utility over wireless or broadband networks to be used for forecasting [2]. Due to physical limitations of existing transmission networks, data from all smart meters is not readily available in real-time [3],[9]. Instead, data from a subset of meters is transmitted in real-time, whereas data from the rest of the meters is collected locally and transmitted in batches periodically (Fig. 1). Prior work in this area has focused on (i) reducing communication requirements by developing sampling or compression strategies, or methods to estimate missing real-time data [14], [6], and (ii) estimating missing real-time data by techniques such as regression-based interpolation [7]. We use a different approach where instead of trying to estimate the missing realtime data, we try to make predictions using partial real time data by learning dependencies among time series originating from different sensors. II.
P ROBLEM F ORMULATION
Consider a large set of sensors 𝒮 = {𝑠1 , ..., 𝑠𝑛 } deployed in a big data application producing output {𝑥𝑖𝑗 }, 𝑗 = 1, ..., 𝑡, 𝑖 = 1, ..., 𝑛, only some of which are available to prediction models in real-time. Short-term prediction is to estimate {𝑥𝑖𝑗 }, 𝑗 = 𝑡 + 1, ..., 𝑡 + ℎ, 𝑖 = 1, ..., 𝑛 for a horizon ℎ, which is a few hours ahead. We formulate the problem of short term
prediction with partial data as follows: Given a set of sensors 𝒮 with time series outputs {𝑥𝑖𝑗 }, 𝑗 = 1, ..., 𝑡, 𝑖 = 1, ..., 𝑛, make short-term predictions {𝑥𝑖𝑗 }, 𝑗 = 𝑡 + 1, ..., 𝑡 + ℎ, 𝑖 = 1, ..., 𝑛 for each sensor 𝑠𝑖 ∈ 𝒮, when readings {𝑥𝑜𝑘 }, 𝑘 = 𝑡 − 𝑟 + 1, ..., 𝑡 for 𝑜 ∈ 𝒪 are missing for a subset 𝒪 of sensors, 𝒪 ⊂ 𝒮. III.
V ERACITY AWARE S HORT- TERM P REDICTION
We propose a two-stage solution for building a short term electricity consumption prediction model that needs to collect real-time data from only a small subset of smart meters selected on the basis of causal influence. First, we learn temporal correlations among historic time series data collected from smart meters. Then, we build our predictive model leveraging such discovered temporal dependencies. Influence Discovery: We cast the problem of short term prediction with partial data as a regression problem. In regression, given data (x𝑖 , 𝑦𝑖 ), 𝑖 = 1, 2, ..., 𝑛, the response 𝑦𝑖 for the 𝑖𝑡ℎ observation is estimated in terms of 𝑝 predictor variables, x𝑖 = (𝑥𝑖1 , ..., 𝑥𝑖𝑝 ) by minimizing the residual squared error. For prediction with partial data, the predictors for 𝑠𝑖 are sequences {𝒫𝑘 }𝑘∕=𝑖 of past values from other sensors, excluding the sensor’s own past values, which are not available in realtime. We used lasso to identify sensors with strong influence on the given sensor 𝑠𝑖 and leave out others. Lasso is known to improve variance and reduce overall prediction errors by shrinking or reducing to zero some coefficients [16]. Given 𝑛 sensor outputs in form of time series x1 , x2 , ..., x𝑛 , with readings at timestamps t = 1, ...𝑇 , for each series x𝑖 , lasso gives a sparse solution for coefficients w by minimizing the sum of squared error and a constant times the L1-norm of the coefficients: � �2 � � 𝑇 𝑛 ∑ � 𝑖 ∑ � 𝑗� 𝑇 � w = arg min w𝑖,𝑗 𝒫𝑡 � + 𝜆∥w∥1 (1) �𝑥 𝑡 − � 𝑗=1 𝑡=𝑙+1 � 2
𝒫𝑡𝑗
where is the sequence of past 𝑙 readings, i.e., 𝒫𝑡𝑗 = 𝑗 𝑗 [𝑥𝑡−𝑙 , ..., 𝑥𝑡−1 ], w𝑖,𝑗 is the j-th vector of coefficients w𝑖 representing the dependency of series i on series j, and 𝜆 is a parameter which determines the sparseness of w𝑖 and can be determined using cross-validation method. Influence Model (IM): We work on day long windows of data to ensure stationarity within each window, implying that the dependence on the preceding values does not change with time. We discover influence and train our model on a previous similar day. We consider two cases of similarity: previous week, which is the same day of the week in preceding week and previous day, which is the day preceding the given day. Our model is formally described below: 1) Split the readings for each smart meter into a set of daily series {𝒟𝑗𝑖 }𝑖=1,...,𝑛,𝑗=1,...,𝑞 . 2) Define dependency matrix ℳ𝑗 for each day using the weight vectors w𝑖 in equation 1 as its rows. Set the diagonal of the dependency matrix to zero, i.e., ℳ[𝑖, 𝑖] = 0, for each 𝑖. 3) Define a regression tree for each smart meter that uses predictors from all meters with non-zero coefficients in the dependency matrix learned from a similar day, i.e., predictors are taken from {𝒟𝑘 }, ∀𝑘 : ℳ𝑠𝑖𝑚 [𝑖, 𝑘] ∕= 0.
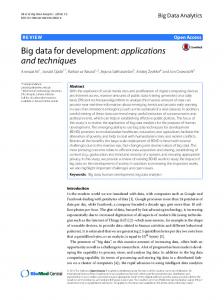
Fig. 2. Prediction performance of influence model (IM) with respect to ART.
A key benefit of this model is that we are able to make predictions for a sensor in absence of its own past values by using past values of its influential sensors. IV.
E XPERIMENTAL E VALUATION
We evaluate the feasibility and accuracy of our proposed method using electricity consumption data collected by smart meters installed in the USC campus microgrid [15] in Los Angeles, and weather data taken from NOAA’s USC campus station. We use the Auto-Regressive Tree (ART) as the baseline model, which has been shown to offer high predictive accuracy on a large range of datasets [12]. We implement a specialized 𝐴𝑅𝑇 (𝑝, ℎ) model that uses recent p values of a variable as features in a regression tree for making h interval ahead prediction. ART was a natural choice for baseline comparison, as our proposed model is also based on regression tree. However, while ART uses a variable’s own recent observations, our model only uses other variables’ observations to make predictions. Mean Absolute Percentage Error ∑𝑛 We use 𝑥𝑖 ∣ (MAPE = 𝑛1 𝑖=1 ∣𝑥𝑖𝑥−ˆ ), a scale-independent [1] measure 𝑖 as the evaluation metric. Fig. 3 shows ∑ the change in dependency and influence 𝑛 (defined as ℐ 𝑘 = 𝑗=1 ℳ[𝑗, 𝑘]) for different smart meters’ time series. We observe that influence varies with time (Fig. 3(a)), hence, we re-calculate influence for each day. We also observe that influence for weekdays is higher than for weekdays (Figure 3(b)), which could be attributed to larger movement of people between buildings on weekdays. Finally, we note that (Fig. 3(c)), dependency decreases with increasing distance between the sensors due to decreasing movement among buildings which are farther apart. We use the influence model (IM) for making predictions for different prediction horizons up to 8 hours ahead (Fig. 2). The baseline ART model performs well up to 6 intervals (1.5 hour) due to very-short-term prediction horizon, where electricity consumption is not expected to drastically change from its previous 4 values. Beyond that, for ART, recent values used as predictors at the time of prediction become increasingly ineffective for longer horizons, when IM’s use of more recent real-time values of other sensors become more useful predictors, and it consistently outperforms the baseline. Compared to ART, IM is able to reduce MAPE by up to 10% (Fig. 2). Thus, more recent real-time values of other
(a) Fig. 3.
(b)
(c)
Variance of Influence/dependency with (a) time, (b) size, and (c) distance: higher values observed for weekdays than for weekends.
sensors actually become more useful predictors than a sensor’s own relatively older values. This is an important result and main advantage of the influence model. Thus, when real-time recent values are not available for a sensor, it uses recent realtime values of other sensors that were identified by learning dependencies among sensors on a similar day in past. V.
C ONCLUSION
We address the issue of veracity in big data applications that arises when real time data from all sensors is not available at central nodes due to network limitations, or when limited by consumers for security and privacy reasons. Standard models for short term predictions are either unable to predict or perform poorly when trying to predict with partial data. We introduce a novel influence based model to make predictions in absence of real-time data from majority of sensors using real-time data from only a few influential sensors. We show that our influence model outperforms the baseline approach by up to 10% for 2 to 8 hours ahead prediction despite lack of sensors’ own real-time data. This model provides a simple and interpretable solution that is generalizable to big data applications in several domains. ACKNOWLEDGMENT This material is based upon work supported by the United States Department of Energy under Award Number DEOE0000192, and the Los Angeles Department of Water and Power (LA DWP). The views and opinions of authors expressed herein do not necessarily state or reflect those of the United States Government or any agency thereof, the LA DWP, nor any of their employees. R EFERENCES [1] S. Aman, Y. Simmhan, and V. Prasanna. Holistic measures for evaluating prediction models in smart grids. IEEE Transactions in Knowledge and Data Engineering (To appear), 2014. [2] N. Balac, T. Sipes, N. Wolter, K. Nunes, R. S. Sinkovits, and H. Karimabadi. Large scale predictive analytics for real-time energy management. In IEEE International Conference on Big Data, 2013.
[3] F. Bouhafs, M. Mackay, and M. Merabti. Links to the future: communication requirements and challenges in the smart grid. IEEE Power and Energy Magazine, 10(1), 2012. [4] A. Ciancio and A. Ortega. A distributed wavelet compression algorithm for wireless multihop sensor networks using lifting. In IEEE International Conference on Acoustics, Speech, and Signal Processing (ICASSP’05), 2005. [5] Y. Demchenko, P. Grosso, C. de Laat, and P. Membrey. Addressing big data issues in scientific data infrastructure. In International Conference on Collaboration Technologies and Systems (CTS). IEEE, 2013. [6] A. Deshpande, C. Guestrin, S. R. Madden, J. M. Hellerstein, and W. Hong. Model-driven data acquisition in sensor networks. In International conference on Very large data bases (VLDB 2004), 2004. [7] D. M. Kreindler and C. J. Lumsden. The eects of the irregular sample and missing data in time series analysis. Nonlinear dynamics, psychology, and life sciences, 10(2), 2006. [8] A. C. Lozano, H. Li, A. Niculescu-Mizil, Y. Liu, C. Perlich, J. Hosking, and N. Abe. Spatial-temporal causal modeling for climate change attribution. In ACM SIGKDD International Conference on Knowledge Discovery and Data Mining (KDD’09). ACM, 2009. [9] A. Marascu, P. Pompey, E. Bouillet, O. Verscheure, M. Wurst, M. Grund, and P. Cudre-Mauroux. Mistral: An architecture for lowlatency analytics on massive time series. In IEEE International Conference on Big Data, 2013. [10] P. McDaniel and S. McLaughlin. Security and privacy challenges in the smart grid. IEEE Security and Privacy, 7, 2009. [11] E. McKenna, I. Richardson, and M. Thomson. Smart meter data: Balancing consumer privacy concerns with legitimate applications. Energy Policy, 41(C), 2012. [12] C. Meek, D. M. Chickering, and D. Heckerman. Autoregressive tree models for time-series analysis. In 2nd International SIAM Conference on Data Mining (SDM). SIAM, 2002. [13] B. Pan, U. Demiryurek, and C. Shahabi. Utilizing real-world transportation data for accurate traffic prediction. In IEEE International Conference on Data Mining (ICDM’12), 2012. [14] M. A. Razzaque, C. Bleakley, and S. Dobson. Compression in wireless sensor networks: A survey and comparative evaluation. ACM Transactions on Sensor Networks, 10(1), 2013. [15] Y. Simmhan, S. Aman, A. Kumbhare, R. Liu, S. Stevens, Q. Zhou, and V. Prasanna. Cloud-based software platform for data-driven smart grid management. IEEE Computing in Science and Engineering, 2013. [16] R. Tibshirani. Regression shrinkage and selection via the lasso. Journal of the Royal Statistical Society, Series B, 58(1), 1996.