with graduate students, and interviewed 9 professional pro- grammers who were
..... hook that instruments all JavaScript that gets added to the Node.js pro-.
Addressing Misconceptions About Code with Always-On Programming Visualizations Tom Lieber MIT CSAIL Cambridge, MA USA
[email protected]
Joel Brandt Adobe Research San Francisco, CA USA
[email protected]
Robert C. Miller MIT CSAIL Cambridge, MA USA
[email protected]
ABSTRACT
We present Theseus, an IDE extension that visualizes runtime behavior within a JavaScript code editor. By displaying real-time information about how code actually behaves during execution, Theseus proactively addresses misconceptions by drawing attention to similarities and differences between the programmer’s idea of what code does and what it actually does. To understand how programmers would respond to this kind of an always-on visualization, we ran a lab study with graduate students, and interviewed 9 professional programmers who were asked to use Theseus in their day-to-day work. We found that users quickly adopted strategies that are unique to always-on, real-time visualizations, and used the additional information to guide their navigation through their code. Author Keywords
Programming; debugging; code understanding ACM Classification Keywords
D.2.5. Software Engineering: Debugging Aids INTRODUCTION
Programmers are often wrong about what code actually does [5]. This causes them to generate incorrect hypotheses while reading, writing, and debugging code, to waste time and energy investigating false leads, and to introduce new bugs while modifying code [9, 16]. We hypothesize that programmers often have these misconceptions because code behavior is invisible most of the time. Few debugging interfaces are designed to be left on and visible during all phases of programming. Instead, the programmer must request information explicitly, for example by opening an inspector, setting a breakpoint, or inserting a print statement. This means that a faulty mental model is corrected only by applying it during debugging. We believe that programmers would benefit substantially from tools that proactively work toward correcting misconceptions.
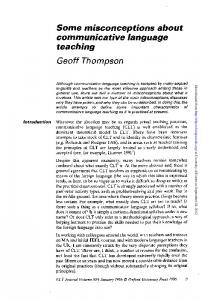
Figure 1. Theseus shows call counts for every function, and an asynchronous call tree allows the user to see how functions interact. In the log above, users can see which call to fetch corresponds to the failure without adding any debugging-specific code or instrumentation.
code coloring and marginal notes, allowing the programmer to perceive that information unobtrusively as they read the code. A function body that has not been executed at all is shown with a gray background, and functions that have been called repeatedly are labeled with the call count. The colors and call counts update in real time so that the user can watch them respond to the actions they take in their program. Clicking on one of those call counts adds an entry to a log showing the arguments and return values of every call, retrieved from a program trace. Theseus organizes the log entries into a call tree that accounts for asynchronous invocations (such as event handlers), allowing programmers to quickly answer many time-consuming reachability questions [9].
Our solution is a code editor extension called Theseus (Figure 1). Theseus visualizes the program’s run-time state using
In order to test whether these tools would help correct misconceptions more quickly, we ran two studies and deployed Theseus as an extension to the Brackets IDE1 . Participants in the first lab study performed programming tasks with and Submitted to CHI 2014
1
1
http://brackets.io
traceGL allows the user to see a zoomable visualization of the entire program trace, updated in real time [1]. After selecting a location in the trace, the user can can navigate the code, which is annotated colors to indicate what was executed, and examine the values of expressions by hovering over them with their mouse. Theseus’s always-on visualizations are similar, but focused on summarizing all past behavior instead of inspecting individual slices of time.
without Theseus active. Theseus users identified the locations where chains of callbacks broke down more quickly (often within seconds of opening a file) than users with just a breakpoint debugger, and exhibited behaviors such as arranging their desktop so that they could see their code while interacting with their application. In the second study, professional software developers used Theseus in their day-to-day programming activities. We then interviewed them to see how Theseus fit into their programming workflow.
Reacher [10] answers reachability questions by presenting a compact graph representation of the interactions between several functions. Reacher uses static analysis to generate the graph, whereas Theseus displays examples which have actually occurred. Thus, Reacher can answer questions about what can happen, and Theseus can answer questions about what the user has just seen happen. Theseus and Reacher provide complementary views of the same kind of information.
The contributions of this paper are: • An always-on, zero-click interface for displaying program execution information in the context of the programmer’s source code. This interface helps the programmer keep their idea of how their code executes consistent with what is actually implemented.
Whyline [8] is a debugging interface that users can ask questions like, “Why is this widget blue?” Whyline answers this question by generating a program slice of all the events that determined the line’s color. The goal of Theseus is to make the programmer more aware of how their program is executing, even when there is no program output about which to ask questions.
• An event-oriented summary of program execution that enables one-click filtering of execution data and navigation of source code. • An efficient approach for collecting, storing, and querying execution trace data that does not require modification of the runtime, and that works with multiple concurrent execution environments (e.g. both a client and server JavaScript virtual machine).
The idea of adding edges to the call graph to aid debugging goes back to ZStep [11], an omniscient step debugger. A ZStep user could step to the point when a given expression was evaluated, to the next time the GUI changed, or to when a particular screen element was drawn. IntelliTrace [13] is similar in that it allows users to index into a program trace by selecting an event, such as a button click or an exception. In addition, some effort has been made to generate JavaScript stack traces that cross event boundaries [15], and more generally across client-server boundaries [12].
• Results from two studies which suggest that Theseus helps keep the programmer’s idea of what their code does from diverging from what it actually does during development. In this paper we will introduce related work, describe the interface and implementation, then discuss the results of our two studies. RELATED WORK
Timelapse offers self-contained, fully-replayable traces of entire web pages within WebKit browsers [2]. Theseus records program traces using source rewriting, which does not require modification of the virtual machine, but cannot perfectly recreate past machine states.
Theseus’s interface was informed by research into the types of questions programmers ask while programming [9, 16], information foraging theory [3], as well as our observations of the tasks JavaScript programmers seem to find difficult or tedious. Some of the most relevant research, and its relationship to Theseus, is described in this section.
THESEUS’S INTERFACE DESIGN
The design goal for Theseus is to put the results of program execution at the fingertips of the programmer. The programmer is intended to leave Theseus running during all stages of development—from empty file to finished product.
In his essay “Learnable Programming”, Bret Victor outlines several of the features he believes a learnable programming environment and language should have, with control flow visualizations among them [17]. He presents an always-on interface that displays domain-specific representations of intermediate values alongside the code. DejaVu is a similar project whose domain is real-time video processing [7]. DejaVu associates the values of variables with the frame of video being processed so that users can inspect them by scrubbing to problematic points of the video. Widgets displaying those values are placed on a canvas among drawings and intermediate versions of the images being processed. Blockbased programming environments like Scratch and Scheme Bricks highlight code as it executes, which can help users draw correspondences between the code and program behavior, though not after the code has finished [14, 6].
In this section, we demonstrate a few of the ways that Theseus’s always-on visualizations allow the user to quickly perform sanity checks of their code’s behavior, and how those same visualizations serve as warnings when the code starts to act differently than intended. Note how Theseus’s visualizations allow the user to do all this without leaving the editor, adding any instrumentation, or even manipulating a debugging interface. Scenario: A Network Activity Indicator
In this scenario, Samantha is creating an animated widget to appear during network operations on an HTML page. 2
A sanity check
Samantha starts by sketching the functions she’ll need: a function that creates an instance of the widget, called Activity, and a function to test the widget’s operation as soon as the page loads. After writing only the definitions of the widget constructor, and registering an empty callback function for when the page finishes loading, Samantha opens the page in a browser. The code coloring in her text editor immediately shows her that the code was parsed successfully (no syntax errors) and that the page load callback was registered and called correctly.
After 3 seconds, the activity indicator was removed from the page and the timer’s call count stopped at 10.
When editing static HTML and JavaScript files, her IDE will automatically reload the browser after every save, so sanity checks like these are quick to make.
Summary
Throughout the implementation of this widget, Samantha was able to verify that the behavior of the code worked before she had added any code that would modify the page. The only time Samantha had to look at the web page was to verify its appearance. Having evidence of the program’s execution in the code editor saved Samantha from needing to switch applications until there was actually something on the page to see. In this scenario, Samantha never had to interact with the debugger directly. No clicks or keystrokes were made solely for the sake of debugging.
After writing some code to add the activity indicator to the DOM (Document Object Model), she saves the file and again gets immediate feedback that both functions were called and neither threw an exception.
Retroactive Logging
Understanding timing
In this scenario, Samantha is working on a Node.js program to count the total number of lines in all the files in a directory.
Some time later, Samantha wants to update the DOM periodically to create the animated effect. Even before adding any code to the function to update the page, she can judge whether the timer is appropriately configured by how quickly the call counts change in the sidebar.
She starts with a sanity check. She verifies that she is using fs.readdir—the function for listing directory entries— correctly by calling it with an empty callback. When she runs the program, she sees that the callback is called, and by clicking on the call count, the log is populated with the values of the arguments to the function. Convention dictates that the first argument is an object encapsulating any error (so it being null is a good sign), and expanding the array allows her to see that the files she expects to find are there.
The call count which currently reads ‘54’ increments by 1 every 300 milliseconds.
Verify that the timer clears appropriately
Samantha adds a conditional statement that should cancel the timer when the activity indicator’s DOM element is removed from the page. She verifies that it works correctly just by watching the call counts. 3
Samantha continues coding, running the program periodically to verify that the call counts make sense and that no exceptions are being thrown. She eventually notices a disparity: the add function, which gathers results, is being called fewer times (133) than the function that iterates over directory entries (140).
They correspond to the empty directories in the tmp directory of a Rails project. When she adds a check for empty directories, the add function’s call count jumps to 140. With a click she can see that the result looks reasonable:
She is faced with a difficult reachability question: find calls to the filename iterator callback that do not result in a call to the add function—either directly, or asynchronously. THESEUS IMPLEMENTATION
Breakpoints don’t work here because she cannot step into the fs.stat callback, and there would be 140 instances to step through besides. Naively adding log statements like console.log("in iterator") and console.log("in add") wouldn’t work because it would be very difficult to find corresponding entries. Her solution is to use Theseus’s log.
Edit
app.js
Module Loading Hook
node-theseu
s WebSock et
Brackets + Theseus
Node.js HTTP Requests
She clicks the call count next to the file entry iterator callback and the call count next to the add function. A log appears that looks like this:
Chrome Remote Debugging API Instrumenting HTTP Proxy
Chrome
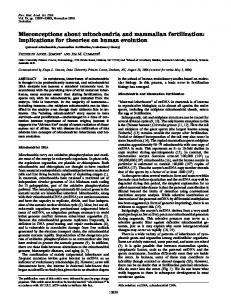
Figure 2. System overview. node-theseus installs a module loading hook that instruments all JavaScript that gets added to the Node.js process. node-theseus then connects to Theseus via a WebSocket connection. When the user requests web pages, the requests are routed through a proxy server that instruments all JavaScript on the page. Theseus opens a WebSocket connection to the page to collect instrumentation data from there as well.
Theseus consists of an extension for the Brackets editor, two modules that the extension uses to communicate with Chrome and Node.js, the JavaScript library called ‘Fondue’ that adds instrumentation hooks to JavaScript source code, and the trace-collecting module that gets injected into the programs being debugged. See Figure 2 for a graphical overview. The components are described briefly in this section.
Finding calls to the iterator callback that don’t eventually call the add function can now be easily done by skimming the log, using the glyphs’ shapes or colors, using the names of the functions, or using the shapes of the log entries themselves (add takes fewer arguments, so its lines are shorter).
Fondue, the JavaScript instrumentation library
Fondue accepts JavaScript source code and returns JavaScript source code that behaves the same but also records all control flow information to a global trace object. Functions are changed to report the arguments received when entered, and the value returned when they exit.
The desired log entries happen to be clustered here:
Function expressions are rewritten so that the invocation at the top of the stack is recorded upon creation. That invocation is regarded as the function’s asynchronous parent. When log entries exist for two invocations that would not otherwise 4
be connected in a call tree (because neither directly or indirectly called the other), if one is the asynchronous parent of the other, then they will be joined as parent and child with an ‘async’ flag added to the child’s log entry. Since objects in JavaScript are mutable, if the trace stored only a reference to function arguments or return values, their values might change by the time they were requested by the debugger. To protect against this, Fondue makes a shallow clone of all objects that it stores. Memory and accuracy can be balanced by adjusting the depth of the copy operation, which is currently set to 1 for objects and 2 for arrays (so that objects within arrays will be cloned).
Subject
Age
Gender
S1 S2 S3 S4 S5 S6 S7
24 23 20 29 24 21 39
M M M M M M M
Prog. Ability
q q q q q q q
q q q q q q q
tq q tq q tq q qqt qqt qqt qqt
JS Ability
q q q q q q q
q q q q q q q
qqt q tq tq q q tq q tq tq q tq q
Uses JS
Daily Daily Few days/wk. Few days/wk. Few days/mo. Few days/mo. Not recently
Table 1. Programming Ability and JavaScript Ability are on a 5-point scale, with 1 labeled “Novice” and 5 labeled “Expert”.
Querying the program trace
When Fondue rewrites JavaScript to add the instrumentation hooks, it also prepends the definition of a global object to receive the trace data. That global object contains methods for accessing information such as the locations of function definitions in all loaded files, the number of times that functions have been called, and the log entries corresponding to a certain query. Theseus collects data by polling these functions at about 10 Hz over one of the connections described next.
tasks: two 20-minute tasks and three 5-minute tasks. To facilitate within-subjects comparison, each participant was assigned to the Theseus or control condition for each task independently (but always with 2 tasks in one condition and 3 in the other). Subjects completed all of their control tasks first (using Chrome Developer Tools), then all of the Theseus tasks (during which Chrome Developer Tools were disallowed).
Debugging server-side Node.js code
The five tasks were as follows:
The user runs their code with the command node-theseus app.js instead of node app.js. node-theseus installs itself as a pre-processor of all JavaScript code that is loaded into that Node.js process. From then on, all code is instrumented with Fondue before being executed. node-theseus then opens a WebSocket server to listen for a debugging connection from Theseus.
A. Canvas Painter (20 minutes). Subjects were given the source code for a browser-based drawing site with approximately 2,000 lines of JavaScript spread across 8 files. They were asked to fix the operation of the drawing tool. B. du (20 minutes). Subjects were given the skeleton for a Node.js command-line tool for calculating the total size of all files in a directory and asked to complete it. C. Laggy AJAX UI (5 minutes). Subjects were given a web page with 25 lines of JavaScript for a web page that downloaded JSON from the server and displayed it in a popup. Subjects were asked to determine why it took so long for the popup to appear. The solution was a delay hard-coded into the server. D. Faulty Auto-Complete (5 minutes). Subjects were given the code for both the server (80 lines of Node.js) and client (63-line HTML file with embedded JavaScript) of a web page that showed auto-complete search results from an address book. Subjects were asked why the results never displayed. The problem was a logic error on the client while processing the results. E. Real-Time Chat (5 minutes). Subjects were given the code for the server (33 lines of Node.js) and client (31 lines of JavaScript on a web page) of a real-time chat site. Subjects were asked why messages from one window did not appear in the other. The problem was that the message name on the client and server was mis-matched.
Debugging client-side code in Chrome
The Theseus extension starts a web server that serves files from the user’s project directory, processing any JavaScript it finds with the Fondue library. When the user opens a web page from that server, Theseus connects to that Chrome window using the Chrome Remote Debugging Protocol [4]. EVALUATION 1: LAB STUDY
We conducted a lab study to answer several questions about how JavaScript programmers would use Theseus on a variety of JavaScript problems. Specifically, the study was designed to shed light on the five research questions below. The first three questions concern the ways in which we think Theseus would make programmers more efficient: RQ1. How would programmers find correspondences between code and program behavior with Theseus? RQ2. How would programmers use Theseus to find where chains of callbacks break down? RQ3. Would programmers use Theseus’s log to sort through tangled control flow problems?
Task E was selected for RQ2 because it involved broken callback chains. Task B exemplified tangled asynchronous control flow. All of the tasks except B required the user to discover correspondences between code and behavior on the page. Because the code was broken in some way in tasks A, D, and E, users were forced to validate many assumptions they made about the code.
Methodology
We recruited 7 participants, described in Table 1, to a 90minute lab study. Subjects were required to have JavaScript programming experience. They were given 5 programming 5
Subj.
A
B
S2 S7 S5 S1 S6 S3 S4
q q q q q X X
q q q q q ? X
C
X X X X X X X
D
X q X X q q X
E
X X X q q X X
Ease of Use
q q q q q q q
q q q q q q q
q tq tq q q tq q tq qqt q tq q tq
Would Use
tq qq qq qq qq qq qq
qqq tq q tq q q tq qqt qqt qqt
Would Recom.
So in the canvas thing, I didn’t know where the issue was, and there’s not much of a global scope with Theseus. ... When I didn’t know where to start, there was no way to find a global call stack and identify candidate starting points. ... [In short, Theseus is] more useful on a narrow scope, less useful on a global scope.”
tq q q q qqqqt qqqqt q q q tq q q q tq qqqqt qqqqt
Participants were interested in the time at which the call counts changed if they were interacting with their application, but also the total number. A changing call count could alert the programmer to surprising or revealing information, such as when S3 watched the call counts during Task A. At one point, S3 thought aloud, “I get 2 mouse up actions [every time I click]. Huh.” Then while watching the call counts and clicking a second time, they exclaimed, “Aha!” as the nature of the problem became more clear. S5 noted that they had become fixated on a handful of functions while trying to narrow down the location of some strange behavior because “it seems weird to me that I get 2 mouse ups every time I click, while I only get 1 mouse down. ... I’d expect the call counts to be the same for both of them, but they’re not.” S4 and S6 also used the fact that a function was called 17 times as verification that it was being called once for each file in the directory during Task B, since they had checked that there were 17 files.
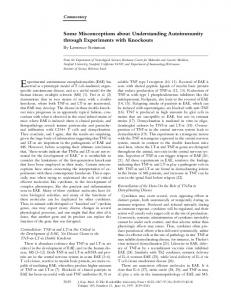
Table 2. Summary of study results. The cells in the columns labeled A–E contain X if the subject successfully completed that task. The cells are shaded blue if the task was done with Theseus. The correctness of S3’s solution for task B was unclear, so that cell contains a question mark. Ease of Use, Would Use, and Would Recommend are on a 5-point scale, with 1 lowest and 5 highest.
At the conclusion of the study, we verbally asked five questions regarding their opinion of Theseus. The results will be presented in the next section. Results
The results of the study are summarized in Table 2. Because of the small number of participants, we were unable to establish any statistically significant relationships between participants’ success rates and the tools they used. A chisquared test found no relationship between using Theseus and the participant’s ability to complete the tasks successfully (χ2 (1, N = 34) = .119, p = 0.73).
The call counts also turned out to be useful for verifying that a code change had had the desired effect. In S4’s case, the fact that their change caused a function to be called a different number of times was encouraging. The call count seemed a reliable enough indicator for checking that the new behavior was correct that they performed no further tests.
RQ1: How might programmers find correspondences between code and program behavior with Theseus?
RQ2: How might programmers use Theseus to find where
Participants frequently sought code correspondences using Theseus by keeping the call counts and code coloring on the screen as they interacted with the program they were working on. They were pleased with how much information they could absorb this way, an experience S1 described like this: “[Theseus] feels really interactive. [As opposed to breakpoints], it’s more of a ‘watch and see what happens’ thing, which I like.” This behavior was not observed during Tasks B or E, likely because Task B involved writing a non-interactive commandline tool and the problem in Task E resided in the logic of a single function. However, during Task A, S1 and S3 used this strategy many times (6 times and 3 times, respectively) during the task. Four of the six participants used this strategy during Tasks C and D. The only participants who did not use this strategy on Tasks C and D were S2 and S4, likely because they spent their first 20 minutes with Theseus working on Task B, the non-interactive command-line tool.
chains of callbacks break down?
Finding where chains of callbacks break down is an important subtask of finding code correspondences. In JavaScript, functions typically cannot block while waiting for the result of an I/O operation, which forces the programmer to split computations into multiple callback functions, with no guarantee that control will flow successfully from one function to the other. We noted several points during the study when participants using Theseus were able to quickly, sometimes immediately, locate the cause of a broken call chain, using the code coloring and call counts. In one instance, S4 opened a source file and was immediately drawn to a network event handler that had never been called, becoming suspicious because it looked like a handler that should have fired several times if the page had been working correctly. This was in contrast to S3’s experience using a breakpoint debugger, in which they set breakpoints and reloaded the page three times before they finally determined how much of the code had actually executed.
There was some disagreement about whether the call counts were useful for finding correspondences when the user had no idea where to begin. S5 said, “how the call counts changed live when I interacted with the application ... was especially useful for Canvas Painter because it was a lot of source code and I didn’t really know where to start.” As a result, S5’s rating of whether they would use Theseus outside the study depended on the size of the project: rated 4 out of 5 if the code base is large, but only 1 out of 5 if the code base is small. S1 had the opposite opinion, stating, “I felt like it was the least useful when I wasn’t sure where the problem was.
RQ3: Would programmers use Theseus’s structured log to sort through tangled control-flow problems?
S4 named the log as Theseus’s most useful feature, saying that Theseus is most useful “if you have recursion problems,” referring to Task B in which his solution involved recursive asynchronous operations. S3 dubbed the pills “automatic silent breakpoints.” S1 compared the log to typical log output, 6
saying, “[Theseus] is a lot more focused ... with console.logs it’s global. ... [With Theseus] you can pick the scope you want to look at on the fly.” S4 summarized his opinion of the log like this: “It gives you what you would do if you were really careful and did console.log every function. Yeah, so I didn’t have to console.log. This saves at least one or two iterations if the first thing you log is really the thing you need. If you need to go through and look more, then this can save a lot more iterations. ... This should be in Chrome. ... This should be in every JavaScript debugger. This is very useful.”
Subject
Theseus Use Pre-Interview (self-reported)
S20 S21 S22 S23 S24 S25 S26 S27 S28
4 hours 3 hours 1 hour 0.25 hours 2–4 hours