Sci Forschen Open HUB for Scientific Researc h
Journal of Forensic Research and Analysis Open Access
Volume 1 - Issue 1 | DOI: http://dx.doi.org/10.16966/jfra.104
RESEARCH ARTICLE
Adopting the Bottom-up Approach and Cluster Analysis on North American and European Male Serial Killers: A Follow-up Study Sandie Taylor1*, Marie Cahillane2 and Lance Workman1 1 2
School of Psychology and Therapeutic Studies, University of South Wales, UK Centre for Electronic Warfare, Information and Cyber, Cranfield University, UK
*Corresponding author: Sandra Taylor, School of Psychology and Therapeutic Studies, University of South Wales, Pontypridd, Wales, CF37 1DL, UK, E-mail:
[email protected] Received: 28 Jul, 2017 | Accepted: 16 Nov, 2017 | Published: 23 Nov, 2017 Citation: Taylor S, Cahillane M, Workman L (2017) Adopting the Bottom-up Approach and Cluster Analysis on North American and European Male Serial Killers: A Follow-up Study. J Forensic Res Ana 1(1): dx.doi.org/10.16966/jfra.104 Copyright: © 2017 Taylor S, et al. This is an open-access article distributed under the terms of the Creative Commons Attribution License, which permits unrestricted use, distribution, and reproduction in any medium, provided the original author and source are credited.
Abstract This study explores the application of the FBI’s organiseddisorganised classification to North-American and European male serial killers. Adopting the same method as Taylor, Lambeth, Green, Bone and Cahillane’s 2012 study, 52 crime scene criteria were used to categorise the murders committed by 25 male European and 25 male North-American serial killers. Applying content analysis, murders committed were dichotomously coded for the presence or absence of crime scene criteria using numerous secondary sources. Two separate agglomerative hierarchical cluster analyses using Ward’s method as the clustering algorithm formed two clusters for the North-American and two for the European serial killers. There were differences in the crime scene criteria for clusters between North-American and European serial murders. The ‘bottom-up’ approach resulted in clusters from the crime scene criteria demonstrating that there are problems associated with classifying traits as simply organised and disorganised. All clusters comprised of a degree of core organised traits -consistent with Canter, Alison, Alison and Wentink’s (2004) assumption that all serial killings require a degree of organisation. Further examination of frequency of occurrence measures suggests there are subtle but inherent differences between the MO of North American and European serial killers.
Keywords: Offender profiling; Serial killers; Cluster analysis
Introduction Ressler et al. [1] whilst working for the Federal Bureau of Investigation (FBI) introduced the dichotomous classification of serial killers into organised non-social and disorganised J Forensic Res Ana
| JFRA
asocial. This was based on early research using narratives from 36 North American incarcerated serial rapists and murderers. The appeal of the organised-disorganised classification derives from its simplicity and ease of application. For instance the FBI offender profiling strategy is based on the inclusion of a series of different crime scene characteristics (those relating to the victim and the personal characteristics of the offender) used to construct a profile of the murderer. An example of crime scene characteristics pertaining to the offender might include an abundance of physical evidence left behind at the scene, such as footprints, fingerprints on a weapon and strands of hair. Crime scene characteristics of the victim that have personal significance to the offender might include the victim’s gender, age and physical appearance (e.g. hairstyle). Hairstyle, for example, was a key factor in victims targeted by serial killer Ted Bundy (in particular young women with a specific hair parting similar to his ex-girlfriend). Other types of victim crime scene characteristics might include the number of stab wounds, the placing of the body post death and whether there were signs of sexual assault. According to the FBI, particular crime scene criteria appear to co-exist under the organised and disorganised classifications which they compiled as a comprehensive checklist of crime scene variables. The FBI claimed that crime scenes from organised serial murders reveal planning and control during the criminal event where little physical evidence is present and details of the victim suggests stranger targeting (i.e. when the victim is unknown to the perpetrator). In the case of disorganised serial murders the criminal act is a spontaneous event, the victim is known but there is no personal relationship and the crime scene is chaotic, being littered with physical evidence. Taylor et al. [2] investigated the reliability of the FBI approach, using agglomerate hierarchical cluster analysis to form clusters from 50 crime scene and victim traits (i.e. crime scene criteria) representing the FBI’s organised-disorganised categories. A bottom up strategy was adopted whereby a content analysis based on these crime scene criteria was used to code the presence or absence of crime scene criteria across 1
Sci Forschen Open HUB for Scientific Researc h
Journal of Forensic Research and Analysis Open Access Journal
the spate of killings conducted by 40 serial killers (20 males and 20 females). The codes (i.e. 0=absence or 1=presence) were inputted for cluster analysis and in the case of male serial killers four clusters were identified; three were primarily descriptive of the disorganised category with a number of ‘rogue’ organised crime scene criteria present and one that was entirely organised. In the case of female serial killers three clusters were identified; two were primarily disorganised with a number of ‘rogue’ organised crime scene criteria and one that was equally divided between organised and disorganised categories. When the frequency of occurrence of each crime scene criteria was considered for male serial killers, it was apparent that the ‘rogue’ crime scene criteria spanned from 5-35% and for females this figure was 5-95%.
counterparts in the US who tend to target strangers [7]. A study by Pakhomou [8] found that most serial killers were organised and that there were equal numbers of disorganised and mixed (have elements of both organised and disorganised) serial killers. Gerand and Johnsson [9] reported that there are more serial killers in Africa than the US and Europe-most of them considered being non-psychotic and ‘organised’ but possibly less mobile than their American counterparts. It is worth noting here that in both Africa and Europe, geographical mobility is likely to be compromised as a consequence of border checks as individuals traverse one country to the next. In North America serial killers are not hindered by such border controls as individuals are free to cross from one State to another without scrutiny-hence they have less limited geographical mobility.
It would be fair to say that the organised-disorganised categories of the FBI are less reliably applicable to female than to male serial killers; nevertheless there is ‘rogue’ crime scene criteria present in the clusters formed for male serial killers which confuses the boundary between these categories. The bottom up approach helps to resolve some of the reliability issues of FBI offender profiling as any co-occurrence of crime scene criteria form statistically from the data. This approach is data driven and not theory driven which helps reduce biases in trait classifications. This same approach was adopted in the following study using North American and European male serial killers only (given that there were more issues of reliability concerning female serial killers these were excluded from the current analysis).
This geographical feature is an important one as it makes it difficult for law enforcement to locate and capture serial killers who are mobile, allowing them to extend their ‘killing career’. It is plausible therefore that there are more ‘organised’ serial killers in North America than there are in Europe given that geographical mobility is a prime trait of the organised serial killer profile. Interestingly, however, on the FBI government statistical website interstate travel by most serial killers is considered a myth. They categorise serial killers who do travel across States as homeless transients, travellers or those whose employment involves interstate or transnational travel. The FBI concluded that serial killers who have a travelling lifestyle can easily operate within a multitude of comfort zones. This is worth bearing in mind when considering the cluster formations and the combination of traits therein.
Despite concerns of reliability and accuracy of the FBI approach, the organised-disorganised dichotomy is still commonly applied to serial killers. This classification system has seemingly gripped the attention of those investigating serial killers, especially in North America, however, serial killers are found globally. According to Vronsky’s study the highest numbers of serial killers operate in North America; estimated at 76% of all serial killers. European countries comprise 21% and of this, England has 28%, Germany 27% and France 13%. City areas are often targeted by European and North American serial killers, but those in the US are less sedentary and tend to be more geographically mobile [3]. This makes sense given that it is easier to cross state boundaries than country borders. An interesting question is whether there are differences in modus operandi (MO) between serial killers in North American and other countries. Gentleman [4] noted one major difference -serial killers from countries other than the US were more likely to dismember victims and to indulge in cannibalism. Furthermore, demographical findings suggest that serial killers from countries other than North America tend not to target specific victims and are more likely to kill either sex [5]. Harbort, et al. [6] found that of the 61 serial killers considered in Germany, a fifth killed victims of either sex and almost 23% killed both children and adults. Interestingly, non-American serial killers are more likely to kill people they know than their
Nevertheless differences have been found between North American and South African serial killers by Hodgskiss [10,11]. Differences such as act focused approaches to murder and depersonalisation of victims were more inherent in South African serial killers. Hodgskiss further claimed that Hickey’s analysis of sexual fantasy comprising an important motivation in serial murder was minimalised in South African serial killing. Furthermore particular types of crime activity such as arson and sexually oriented fetishes were uncommon in South African serial murders. South African serial killers tend to have more in common with non-American offenders such as South and Central America, the rest of Africa, the Middle-East and Asia [12,11]. This suggests cross cultural differences might be partially causal in these differences found [13,11] but could also reflect discrete geographical boundaries (certainly when considering South and Central America, the rest of Africa, the Middle-East and Asia) which are not apparent in North America. Europe, in terms of geographical borders, has more in common with South and Central America, the rest of Africa, the Middle-East and Asia than with North America. Europe’s cultural differences, however, will be vast when compared with these countries but correspond more closely perhaps with North American ideals (considering population migrations from Europe to the US in the past couple of centuries).
Citation: Taylor S, Cahillane M, Workman L (2017) Adopting the Bottom-up Approach and Cluster Analysis on North American and European Male Serial Killers: A Follow-up Study. J Forensic Res Ana 1(1): dx.doi.org/10.16966/jfra.104
2
Sci Forschen
Journal of Forensic Research and Analysis Open Access Journal
Open HUB for Scientific Researc h
Hickey [13] and Pakhomou [8] found that North American serial killers often have personality and mood disorders and present with paranoid and schizophrenic traits. Hickey [13] also found that rejection, cruelty, abuse and dysfunctional family backgrounds were prevalent in many North American serial killers. Feelings of inadequacy, loneliness and helplessness reported by North American serial killers were also expressed among their South African counterparts Labuschagne, et al. [14-16]. Furthermore particular types of crime activity such as arson and sexually oriented fetishes were common in North American serial murders. It will be interesting to compare some of these traits with a sample of European serial killers. Numerous studies, however, have considered cross-cultural differences and similarities of crime scene behaviours for single homicide offenders using a thematic approach. This approach is different to FBI offender profiling as it is concerned with categorising crime scene behaviours and actions that co-occur and comprise dominant themes across different murders using Multidimensional Scaling such as Small Space Analysis (SSA). Using SSA Canter and colleagues have found that three dominant themes summarising a multitude of crime scene behaviours and actions arise: victim as object, person or vehicle. In the case of ‘victim as a vehicle’ the offender uses the victim as a means of expressing desires, aggression and anger. For the ‘victim as a person’ the interaction between offender and victim is very much instrumental and one of manipulation in order to achieve goals. A series of studies have focused on the expressive-instrumental (i.e. victim as vehicle or person) angle such as Salfati, et al. [17-20] conducted a multidimensional analysis of crime scene behaviours of 210 Greek single offenders of single victim murders. Basing their interpretations on a thematic approach of instrumental and expressive behaviours committed during the crime, they concluded that there are many similarities demonstrated in Greek murderers to murderers in other countries (any differences possibly arising out of cultural variations). This finding was supported when the same standardised approach was applied to serial killers from Finland Santtila, et al. [21], Belgium Thijssen J, et al. [22] and Canada Salfati, et al. [19]. Interestingly, and of relevance here, the thematic approach had been applied to serial killers with a particular emphasis on distances travelled. Field, et al. [23] replicated Salfati and Bateman’s study in 2005 of North American serial killers using the thematic approach of the dichotomous classification of expressive-instrumental. In addition to adopting the expressive-instrumental themes, Field, et al. [23], considered the distances travelled by a sample of 18 serial killers from their home-base to the disposal site of the victim. In total 23 crimescene behaviours were included in the Smallest Space Analysis (SSA) producing evidence for the expressive-instrumental classification. Differences in travel were strongly influenced by an expressive or instrumental classification: instrumental serial killers travelled considerably further distances than those who were expressive.
Patterns of behavioural consistency and change during the commission of multiple killings were also investigated using Multidimensional Scaling by Sorochinski and Salfati [24]. They reported a thematic differentiation in the cognitive strategies used by serial killers such as offender-victim interaction, planning and wounding. They suggested that there are changes in patterns of behaviour across separate killings which are indicative of factors like learning the trade, situational variables (i.e. time restricted or interrupted) and intrinsic elements such as modifications to fantasies and loss of control. The three exampled themes of offender-victim interaction, planning and wounding considered in Sorochinski and Salfati’s study are traits that the FBI offender profiling strategy incorporates in their organised-disorganised classification. Despite the robust empirical evidence for the thematic approach, there is little research undertaken to examine the crime scene criteria of North American and European serial killers as a means of empirically testing the organiseddisorganised dichotomy. Through the adoption of a ‘bottom up’ approach it is assumed that the evidence from numerous crime scene criteria for both North American and European serial killers will form into mutually exclusive clusters of organised and disorganised sub-categories based on trait co-occurrence. Furthermore, that this differentiation will encapsulate the expressive-instrumental divide as far as FBI profiling enables.
Aims and Hypotheses The first aim of the current study is to consider the crime scene criteria and the likely clusters they form to determine their best fit in terms of the theory: ascertaining whether the same categorisations to those of Ressler, et al. [1] can be derived through adopting a ‘bottom up’ strategy of analysis. The second aim is to investigate whether there are differences in the pattern of organised-disorganised classifications from the clusters of crime scene criteria for European and North American male serial killers.
Hypothesis 1 Crime scene criteria will co-occur as clusters supporting the organised-disorganised dichotomy of the FBI for both North American and European serial killers.
Hypothesis 2 The prevalence of organised or disorganised traits present in cluster formations will show differences between North American and European serial killers.
Hypothesis 3 There will be a difference between North American and European serial killers in the frequency of organiseddisorganised clusters of crime scene criteria.
Hypothesis 4 All clusters, regardless of a predominantly disorganised trait presence, will contain core organised traits. These core organised traits will differ across North American and European clusters.
Citation: Taylor S, Cahillane M, Workman L (2017) Adopting the Bottom-up Approach and Cluster Analysis on North American and European Male Serial Killers: A Follow-up Study. J Forensic Res Ana 1(1): dx.doi.org/10.16966/jfra.104
3
Sci Forschen
Journal of Forensic Research and Analysis Open Access Journal
Open HUB for Scientific Researc h
Method Cases Secondary data sources of case material (books, journals, newspaper clips, documentary footage, trial transcripts, case history narratives and relevant websites) were used to obtain information for 50 male serial killers. Information about each serial killer was carefully analysed and corroborated through different sources. Any contradictory, conflicting or biased reporting was excluded from further analysis. The 20th and 21st centuries represented the cohort of serial killers considered in this study - where the majority of serial killers operated between 1970 and 2000. Twenty-five North American and 25 European male serial killers were considered. Serial killers were selected using the criteria of: being well known and documented by many different sources of media presentation. Examples of North American serial killers include Ted Bundy, Jeffrey Dahmer, John Gacey, David Berkowitz, Albert DeSalvo, George Metesky, Richard Ramirez, Henry Lee Lucus, Edmund Kempler and Jerry Brudos. In the case of European serial killers examples considered include Harold Shipman, Ian Brady, John Duffy, Jack Unterweger, Fritz Honka, Dennis Nilsen, Fred West, Steve Wright, Donato Bilancia and Andrei Chikatilo. Other criteria used for the selection of serial killers considered in this study stipulated that in excess of two victims were murdered (using Egger’s [25] definition of a serial killer), of any age but male only and were apprehended, sentenced and imprisoned on the basis of robust evidence corroborating their guilt. Canter and Wentink [26] suggested that the first murder might produce an unreliable representation of the killer’s MO and for this reason should be excluded from analysis which is why in this study first murders were ignored. The reason for adopting this exclusion criterion is to ensure that the MO is consistent providing a greater chance of organised-disorganised separation across the different serial killers’ murders.
Materials
criterion in the dendrograms (i.e. a graphic representation from the statistical cluster analysis). These numbers enable readers to locate the full naming of the crime scene criteria which in the dendrograms are abbreviated. Terms such as process and act focused were used to indicate a long-term or short-term killing respectively which indicates the nature of what had been done to the victim and the MO of the serial killer. Crime scene criteria were based on those included in Taylor et al. [2]. These crime scene criteria, in turn, included those used by Canter, et al. [27]. Additional crime scene criteria were based on those from the FBI Crime Classification Manual. To be consistent with previous published studies in this area, informed publications by experts in the field such as Canter, et al. [28] and Taylor, et al. [2] were used to provide the descriptions of crime scene criteria selected in Table 1.
Design and Procedure Using content analysis for coding extracted information from documented secondary data sources consistent with the 52 specified crime scene criteria was considered to be most appropriate. Crime scene criteria were presented in table format and used as a basis for dichotomous coding: 1=presence of crime scene criterion and 0=absence of crime scene criterion for all the different murders (except the first) committed by each serial killer. Two content analyses were compiled, one for North American and one for European serial killers. The following provides an example of the coding format used (see table below). A bottom-up approach to coding was followed where information for each murder (except the first) for each serial killer was predicated on the 52 pre-defined crime scene criteria and not the organised-disorganised classifications. Hence the analyses were data driven and not theory driven. The data therefore were not allocated to the categories ‘organised’ and ‘disorganised’, but instead to the crime scene criteria. This allowed for the construction of overall interpretations. crime scene criteria
A table documenting the crime scene criteria was devised: crime scene criteria were defined by the MO crime scene and victim characteristics (Table 1). The crime scene criteria each have a number (in brackets) denoting the identification of the
restraints victim known controlled scene weapon planned act focused
0 (absent) or 1 (present) 1 0 1 1 0
Table 1: Lists the 52 crime scene criteria considered for hierarchical cluster analysis. Restraints used (1) Spontaneous event (2) Victim known (3) Intoxication (4) Controlled scene (5) Stranger targeted (6) Sudden violence (7) Chaotic scene (8) Aggressive acts (9) Necrophilia (10) Weapon left at scene (11) Weapon planned (12) Body not moved (13)
Weapon improvised (14) Physical evidence present (15) Gagging (16) Targeted group/person (17) Victim a relative (18) Quick kill (19) Shooting (20) Rape (21) Removal of body parts (22) Strangulation (23) Vulnerable victim i.e. ill, elderly (24) Torture (25) Mutilation (26)
Unclothed body (27) Penetration with foreign object (28) Body exposed (29) Multiple stabbing (30) Trophy taken (31) Ritual aspect (32) Injuries to sexual areas (33) Sexualised body position (34) Murdered indoors (35) Signs of beating (36) Arson (37) Killer mobile/transit (38) Body transported (39)
Disconnection from the crime scene (40) Dehuminisation of body (41) Covering of face i.e. blindfold (42) Bondage used (43) Staging (44) Body disposal (45) Process focused (46) Act processed (47) Destruction of body (48) Removal of sex organs (49) Poisoned (50) Murdered outdoors (51) Killer stable (52)
Citation: Taylor S, Cahillane M, Workman L (2017) Adopting the Bottom-up Approach and Cluster Analysis on North American and European Male Serial Killers: A Follow-up Study. J Forensic Res Ana 1(1): dx.doi.org/10.16966/jfra.104
4
Sci Forschen
Journal of Forensic Research and Analysis Open Access Journal
Open HUB for Scientific Researc h
Statistical Analyses Using the Statistical Package for the Social Sciences (SPSS; SPSS Inc., Chicago, IL, USA), the codes obtained from the content analyses were inputted as a series of ‘0’ and ‘1’ representing a serial killer’s profile. The codes for the North American serial killers were inputted separately from the European serial killers. Each anonymous serial killer profile had codes for all 52 crime scene criteria. As the aim was to link the crime scene criteria together into larger defined clusters (i.e. in accordance with organised and disorganised FBI classifications), the statistical procedure known as agglomerative hierarchical cluster analysis was adopted. Agglomerative hierarchical clustering aims to join variables together into successively larger clusters, using a measure of distance (or similarity). The clusters are constructed by an agglomeration process. All crime scene criteria begin as individual clusters which eventually combine to form new clusters when a relationship between them is forged. This process of merging crime scene criteria that are closer in relatedness continues until all crime scene criteria merge to form a single cluster. In other words, clusters become ‘nested’ within larger clusters that are generated by a process known as the ‘forward clustering’ technique Bartholomew, et al. [28]. As part of this statistical process a measure known as the Squared Euclidean Distance is calculated and an algorithm for clustering variables uses ‘Ward’s method’. The Squared Euclidean Distance is used to calculate distances between variables (i.e. how related crime scene criteria are). The Ward’s method looks for dissimilarities between variables to structure the clusters and assesses cluster membership by calculating the total sum of squared deviations from the mean of a cluster. In other words, this method allows investigators to determine which crime scene criteria fit into different clusters that ultimately reflect either organised or disorganised categories. The criterion for cluster combination is that the joining of clusters should generate the smallest possible increase in the error sum of squares. The agglomeration procedure uses the distance statistic (fusion coefficient) to join clusters (refer to Table A, in Appendix 1). A solution is afforded for each possible number of clusters and the degree of change in the distance coefficients that can be used to ascertain the optimal number of clusters (Everitt, et al. [29]). Agglomerative hierarchical cluster analysis has been successful in determining the co-occurrence of crime scene criteria in a robust and reliable manner.
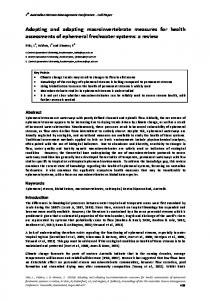
Results The agglomerative process in the hierarchical cluster analysis identified distinct clusters for both the North American and European based male serial killers. Cluster formation was stopped when the increase in the distance (fusion) coefficients was large. The Ward’s method revealed a two cluster solution for North American serial killers. This demonstrates a change in the distance coefficient which is relatively large at 43.735, between the two cluster and one cluster solutions. The dendrogram was analysed to help explain the two cluster solution by way of
identifying the variables that made up each cluster for the male North American serial killers (Figure 1). For the European male serial killers Ward’s method also suggests that a two cluster solution is optimal and is confirmed by Figure 2. As evident in Table A (see Appendix 1), the distance coefficient is at 216.106 for the two cluster solution and jumps to 258.519 when these two clusters are combined into a single cluster solution - giving a change in the distance coefficient of 42.413 (Figures 1 and 2).
Clusters formed for North American serial killers Table 2, Cluster1 (C1) comprises of 29 traits; 23 considered to be disorganised crime scene criteria and six more commonly associated with an organised profile. Given the prevalence of disorganised traits, the six organised traits can be considered as rogue traits. These rogue traits cannot be ignored because of their frequency of occurrence within the sample of murders across the North American (NA) serial killers (SKs) considered. For example aggressive acts (44%), killer mobile/transient (33%), shooting (32%) and gagging (20%) are high frequencies of occurrence that typifies the MO of organised SKs. At the same time, however, disorganised traits of sudden violence and spontaneous event have a 56% frequency of occurrence followed by act focus (40%) and 36% for chaotic scene, body not moved and murdered outdoors. Despite there being a higher preponderance of disorganised traits it is important to consider the frequency of occurrence of the organised traits. As these are high (certainly for four of the rogue traits), this alludes to Rescaled Distance Cluster Combine C A S E Label Num Removals Posioned Victimre Facecove Penetrat Removalb Mutilati Intoxica Injuries Sexualis Staging Dehumani Ritual Disconne Wimprovi Arson WLeft Gagging Sudden Chaotic Bodynotm Actfocus Spontane Aggressi Killermo Quickkil Shooting Bodyexpo Murdered Multiple Destruct Victim Signsbea Stranger KillerSt WPlanned Processe Rape Murder_1 Torture Bodytran Bodydisp Necrophi Trophy Controll Restrain Bondage Unclothe Physical Strangul Targetgr Vulnerab
50 51 18 43 28 22 26 4 33 34 45 42 32 41 14 37 11 16 7 8 13 48 2 9 38 19 20 29 39 30 49 3 36 6 52 12 47 21 35 25 40 46 10 31 5 1 44 27 15 23 17 24
0 5 10 15 20 25 +---------+---------+---------+---------+---------+ -+ -+ -+ -+-+ -+ | -+ | -+-+ -+ | -+ | -+-+---+ Cluster 1 -+ | | ---+ | ---+ +---------------------+ ---+ | | -+ | | -+-+ | | -+ +---+ | ---+ +-------------------+ | ---+-+ | ---+ +-+ | | ---+-+ | | | ---+ | +---------+ | | -----+ | | | | -----+-+ +-----------+ | | -----+ | -+-------+ | | -+ +-------+ | -----+-+ | | -----+ +-+ | ---+-+ | | | ---+ +-+ ---+-+ | ---+ | -----+---+ | -----+ | | ---+-+ +-------------+ | | | | ---+ | -----+---+ | | -----+ | | ---+ +-------------------------+ ---+-----+ | ---+ +---+ | -+---+ | | | -+ +---+ | | -----+ +---------+ Cluster -+-+ | -+ +-------+ | ---+ +-+ ---+-----+ | ---+ +-+ -----+---+ -----+
2
Figure 1: Dendrogram using Ward’s method for agglomerative hierarchical cluster analysis of the presence or absence of crime scene criteria in male North American serial murders.
Citation: Taylor S, Cahillane M, Workman L (2017) Adopting the Bottom-up Approach and Cluster Analysis on North American and European Male Serial Killers: A Follow-up Study. J Forensic Res Ana 1(1): dx.doi.org/10.16966/jfra.104
5
Sci Forschen
Journal of Forensic Research and Analysis Open Access Journal
Open HUB for Scientific Researc h
Rescaled Distance Cluster Combine C A S E Label Num Ritual Facecove Posioned Sexualis WLeft Victimre Necrophi Staging Quickkil Arson Shooting Penetrat Signsbea Victim Intoxica Killermo Disconne Trophy Gagging Bodytran Wimprovi Bodydisp Controll Murdered Strangul Targetgr Vulnerab Restrain Bondage Torture Unclothe Processe Stranger KillerSt WPlanned Physical Rape Sudden Chaotic Aggressi Spontane Actfocus Bodyexpo Murder_1 Dehumani Destruct Injuries Removals Removalb Mutilati Multiple Bodynotm
32 43 51 34 11 18 10 45 19 37 20 28 36 3 4 38 41 31 16 40 14 46 5 35 23 17 24 1 44 25 27 47 6 52 12 15 21 7 8 9 2 48 29 39 42 49 33 50 22 26 30 13
0 5 10 15 20 25 +---------+---------+---------+---------+---------+ -+ -+ -+ -+ -+-+ -+ | ---+---+ ---+ +-+ -+-+ | | -+ +---+ | -+ | +-+ -+-+ | | -+ | | -+---+ | | -+ +---+ | ---+ | +---------------+ ---+-+ | | ---+ | | -+-+ | | -+ +---+ | | ---+ +---+ +---------------------+ -------+ | | ---+-+ | | ---+ +-------+ | | -----+ | | | ---+-------+ +-------------+ | ---+ | | | -+ +-+ | -+-----+ | | -+ +---+ | -----+-+ | -----+ | ---+---+ | ---+ +---------+ | -------+ | | -----+---+ | | -----+ | +-------------------------------+ -+ +---+ | -+-----+ | | | -+ +-+ | | ---+---+ +---+ Cluster 2 ---+ | ---+-----+ | ---+ | | ---+---+ +---+ ---+ | | -+-+ +-+ -+ +---+ ---+ | -+---+ | -+ +-+ -----+
Cluster 1
Figure 2: Dendrogram using Ward’s method for agglomerative hierarchical cluster analysis of the presence or absence of crime scene criteria in male European serial murders.
C1 being a mixed SK classification. Another way of considering this is to adopt Canter’s conclusion from his SSA radex diagrams that all serial murder has a core organised element. Applying this to the results here would suggest that for the murders of the NA SKs analysed there is a cohort who show specific organised traits but adopt an essentially disorganised MO. C2 contains 19 traits; 14 considered to be organised and five disorganised. Not only is there a higher preponderance of organised to disorganised traits but the frequency of occurrence is high for all these traits. For example weapon planned (80%), stranger targeted (76%), rape (72%), process focused (64%), targeted group or person (56%) and murdered indoors (52%). Despite this, however, the disorganised trait contribution cannot be ignored as the frequency of occurrence is also high (certainly for four of the traits). For example for the killer stable trait this is 60%, unclothed body (56%), physical evidence (40%) and vulnerable victim (28%). Again by considering Canter’s conclusion of all SKs having organised core traits, C2 is predominantly organised but has disorganised aspects to the MO.
Clusters formed for European serial killers In Table 3 there are two clusters which have a very different profile. C1 crime scene criteria crossed both organised and disorganised classifications almost equally. There are 30 traits; 16 organised and 14 disorganised suggesting a mixed
Table 2: Crime scene criteria within clusters ordered according to organised and disorganised classifications for North American male serial killers with % frequency of occurrence. Cluster
1
2
Organised
Disorganised
penetration with foreign object (8%), removal of body parts (4%), mutilation (8%), injuries to sexual areas (8%), staging (12%), dehumanization of body (16%), ritual aspect (12%), disconnection from crime scene (12%), intoxication (12%), sexualised body position (12%), gagging weapon improvised (16%), arson (8%), weapon left (12%), sudden (20%), aggressive acts (44%), killer mobile/transit (36%), violence (56%), chaotic scene (36%), body not moved (36%), act focused shooting (32%) (40%), spontaneous event (56%), quick kill (24%), body exposed (28%), murdered outdoors (36%), multiple stabbing (16%), destruction of body (24%), victim known (16%), signs of beating (28%) stranger targeted (76%), weapon planned (80%), process focused (64%), rape (72%), murdered indoors (52%), torture killer stable (60%), necrophilia (16%), unclothed body (56%), physical (24%), body transported (24%), body disposal (36%), trophy evidence (40%), vulnerable victim (28%) (20%), controlled scene (32%), restraints (48%), bondage (44%), strangulation (44%), targeted group or person (56%)
Table 3: Crime scene criteria within clusters ordered according to organised and disorganised classifications for European male serial killers with % frequency of occurrence. Cluster
Organised
1
sexualised body position (4%), intoxication (20%), killer mobile/transit (16%), gagging (12%), body transported (8%), body disposal (44%) shooting (8%), controlled scene (40%), murdered indoors (48%), strangulation (36%), targeted group or person (64%), restraints (20%), bondage (16%), torture (24%), process focused (40%), trophy (24%)
2
Disorganised
poisoned (4%), weapon left (4%), victim a relative (4%), necrophilia (12%), staging (16%), quick kill (20%), penetration with foreign object (4%), signs of beating (16%), victim known (20%), disconnected from crime (16%), weapon improvised (20%), vulnerable victim (48%), unclothed body (11%), arson (8%) killer stable (80%), physical evidence (36%), sudden violence (48%), chaotic scene (40%), spontaneous event (28%), act focused (52%), body exposed (40%), murdered outdoors (44%), stranger targeted (72%), weapon planned (72%), rape (48%), dehumanisation of body (36%), destruction of body (28%), aggressive acts (44%) injuries to sexual areas (8%), removal of sex organs (12%), removal of body parts (28%), mutilation (24%), multiple stabbing (36%), body not moved (32%)
Citation: Taylor S, Cahillane M, Workman L (2017) Adopting the Bottom-up Approach and Cluster Analysis on North American and European Male Serial Killers: A Follow-up Study. J Forensic Res Ana 1(1): dx.doi.org/10.16966/jfra.104
6
Sci Forschen
Journal of Forensic Research and Analysis Open Access Journal
Open HUB for Scientific Researc h
offender. Although the preponderance distribution of traits across both classifications is almost the same, the frequency of occurrence of at least six organised traits exceeds that of the disorganised traits with the exception of vulnerable victim at 48%. For example for these six organised traits the frequency of occurrence for targeted group or person is 64%, murdered indoors (48%) body disposed (44%), processed focused and controlled crime scene (40%) and strangulation (36%). The next two highest frequencies of occurrence disorganised traits are victim known and weapon improvised at 20%. When these frequencies of occurrence are considered C1 is in line with a set core of organised traits with elements of a disorganised MO. C2 comprises of 20 traits, 16 disorganised and four organised. The preponderance of disorganised traits suggests C2 represents a disorganised profile. When the frequency of occurrence is considered the organised trait contribution is high. For example for stranger targeted and weapon planned this is 72%, rape (48%) and aggressive acts (44%). The frequency of occurrence for disorganised traits include killer stable (80%), act focused (52%), sudden violence (48%), murdered outdoors (44%), chaotic scene and body exposed (40%) and multiple stabbing and dehumanisation of body at 36%. This profile has an underlying organised element but strongly features disorganised elements to the MO. Hypothesis 1: ‘Crime scene criteria will co-occur as clusters supporting the organised-disorganised dichotomy of the FBI for both North American and European serial killers’ the clusters formed are inconclusive. There appears to be a core set of organised traits in all four clusters. C1 for the European (E) SK is the closest to resembling the mixed SK but even here the frequency of occurrence data suggests a robust core set of organised traits. The conclusion we can make here is that all serial killing has core organised traits. Hypothesis 2: ‘The prevalence of organised or disorganised traits present in cluster formations will show differences between North American and European serial killers’. A crude heuristic to establish this is by a simple count of the number of organised and disorganised traits present in each cluster for NA and E SKs (Table 4). Although this provides us with a cursive headcount of the organised and disorganised traits present in each cluster for NA and E SKs, it only allows a simple conclusion that there are differences in prevalence of traits within NA and E cluster formations and between NA and E clusters. This fails to provide information as to the nature of these differences. In terms of Hypothesis 2 there are prevalence differences of organised and disorganised traits for NA and E serial killing. Hypothesis 3: ‘There will be a difference between North American and European serial killers in the frequency of organised-disorganised clusters of crime scene criteria’. As mentioned previously two clusters were found for NA and two for E SKs and in all cases the cluster classification
contained both organised and disorganised traits which alludes to a mixed typology (in particular C1 of E SKs). When all clusters for the disorganised and organised traits are collapsed (Tables 5 and 6) there appear to be differences in the frequency of occurrence for serial killing across the NA and E samples used. Although in Table 6 the frequency of occurrence for the organised traits collapsed across clusters for the NA and E SKs appear closer, there are some differences. Considering the major differences in frequency of occurrence for disorganised traits across NA and E SKs it becomes apparent that serial killing might demonstrate differences in MO. The removal of body parts shows a 24% frequency of occurrence Table 4: Preponderance of organised and disorganised traits in all clusters North America organised C1 disorganised organised C2 disorganised
Prevalence 6 23 14 5
Europe
Prevalence
organised C1 disorganised organised C2 disorganised
16 14 4 16
Table 5: Disorganised traits collapsed across cluster and location North America 8% 4% 8% 8% 12% 16% 12% 12% 16% 8% 12% 56% 36% 36% 40% 56% 24% 28% 36% 16% 24% 16% 28% 60% 16% 56% 40% 28% 0% 0% 0%
Disorganised Traits penetration with foreign object removal of body parts mutilation injuries to sexual areas staging dehumanisation of body ritual aspect disconnection from crime scene weapon improvised arson weapon left sudden violence chaotic scene body not moved act focused spontaneous event quick kill body exposed murdered outdoors multiple stabbing destruction of body victim known signs of beating killer stable necrophilia unclothed body physical evidence vulnerable victim poisoned victim a relative removal of sex organs
Europe
Frequency of Occurrence Differential (> 16%)
4% 28% 24% 8% 16% 36% 0%
24% 16%
20%
16% 20% 8% 4% 48% 40% 32% 52% 28% 20% 40% 44% 36% 28% 20% 16% 80% 12% 11% 36% 48% 4% 4% 12%
28%
18%
20% 45% 20%
Citation: Taylor S, Cahillane M, Workman L (2017) Adopting the Bottom-up Approach and Cluster Analysis on North American and European Male Serial Killers: A Follow-up Study. J Forensic Res Ana 1(1): dx.doi.org/10.16966/jfra.104
7
Sci Forschen
Journal of Forensic Research and Analysis Open Access Journal
Open HUB for Scientific Researc h
Table 6: Organised traits collapsed across cluster and location North America 12% 12% 20% 44% 36% 32% 76% 80% 64% 72% 52% 24% 24% 36% 20% 32% 48% 44% 44% 56%
Organised Traits intoxication sexualised body position gagging aggressive acts killer mobile/transit shooting stranger targeted weapon planned process focused rape murdered indoors torture body transported body disposal trophy controlled scene restraints bondage strangulation targeted group or person
Frequency of Europe Occurrence Differential (> 16%) 20% 4% 12% 44% 16% 20% 8% 24% 72% 72% 40% 24% 48% 24% 48% 24% 8% 16% 44% 24% 40% 20% 28% 16% 28% 36% 64%
differential where E SKs do this more often. For mutilation this is a 16% rise for E serial killing, 18% for dehumanisation of body and multiple stabbing, 20% for killer stable and vulnerable victim. There is no presence of a ritual aspect for E SKs. In the case of NA SKs unclothed body has a frequency of occurrence differential of 45%, and 28% for spontaneous event. There is no presence of removal of sex organs, being poisoned or victim a relative in NA SKs. The frequency of occurrence differential for the organised traits of NA serial killing is 28% for restraints and bondage, 24% for shooting and process focused, 20% for killer mobile/transit and 16% for body transported. For these traits the NA SKs are different in their MO by quite a margin from the E SKs. It can be speculated that the killer mobile/transit trait might be influenced by the ease of travel from one State to another in the US. Also US laws regarding the possession and use of firearms is far more relaxed than in Europe. It can also be speculated that the lack of geographical boundaries in the US might make it easier for SKs to transport bodies from one State to another, than would otherwise be possible in Europe (i.e. from one country to the next given border checks). The removal of body parts, removal of sex organs, mutilation and dehumanisation of body occurs more frequently among E SKs-a point noted by Gentleman (2007). Hypothesis 4: ‘All clusters regardless of a predominantly disorganised trait presence will contain core organised traits. These core organised traits will differ across North American and European clusters’. Support for this hypothesis has largely been addressed. Both prevalence and frequency of occurrence measures have indicated a strong core organised trait presence in all four clusters whether European or North American.
Discussion The agglomerate method resulted in two distinct clusters for North American and for European serial killers. Despite traits separating into the organised-disorganised classifications there were ‘rogue’ crime scene criteria present to varying degrees in each cluster. The mixed offender classification first suggested by Douglas and Munn [30] appeared to account for all clusters formed across the North American and European serial killer murders sampled. Interestingly, however, the possibility of more than one type of disorganised serial killer might account for some of the findings here. This idea had been addressed by Canter, et al. [27] in their ‘re-interpretation of serial murder.’ Canter, et al. [27] claim, ‘These are often regarded as quintessentially disorganised, but the results show that it would be inappropriate to regard them as the same form of disorganisation’ (p.311). They further state, “some distinctions in the way offenders may be disorganized have been suggested by the present analysis” (p.313). This assumption was further supported by the findings of Taylor, et al. [2]. Another important point raised by Canter et al. speculates that the crime scene classified as being organised does not necessarily oppose a disorganised one but instead, “it may represent a dominant style of serial sexual homicide or a possible bias that is characteristic of most serial murders (Canter, et al. [27] p.313). Again this assumption was supported in Taylor. et al, [2] cluster analysis of the murders committed by male serial killers in their sample. The results found here tend to support the idea of different types of disorganised serial killings across the four clusters, all with varying degrees of organised trait elements co-occurring. This is supported by the dendrograms which show four distinct clusters (two for the North American serial killers and two for the European serial killers) each containing elements of organised crime scene criteria. This suggests that most serial killers have organised traits which intuitively makes sense, since organisation, however limited it might appear, ensures the successful execution of the murder. This therefore accounts well for organised crime scene criteria present among disorganised criteria in this study for both European and North American serial murder.
Hypothesis 1 Support for the first hypothesis is limited. There were, what can be considered as rogue traits (either organised or disorganised), present in all clusters with the exception of C1 in the European serial killer sample where the number of organised and disorganised traits co-occurred about the same. This cluster supports the classification of the mixed offender introduced by Douglas and Munn [30]. The conclusion is that there appears to be a core set of organised traits in all four clusters.
Hypothesis 2 Predicted a difference in the prevalence of organised and disorganised traits in the cluster formations across North
Citation: Taylor S, Cahillane M, Workman L (2017) Adopting the Bottom-up Approach and Cluster Analysis on North American and European Male Serial Killers: A Follow-up Study. J Forensic Res Ana 1(1): dx.doi.org/10.16966/jfra.104
8
Sci Forschen
Journal of Forensic Research and Analysis Open Access Journal
Open HUB for Scientific Researc h
American and European serial killers. A crude heuristic of counting the number of organised and disorganised traits present across the clusters and place location suggests a difference in the MO used by North American and European serial killers. This does not inform us of much else which is why frequency of occurrence is a more robust measure of the nature of difference occurring.
Hypothesis 3 Predicted a difference between North American and European serial killers in the frequency of occurrence of organised-disorganised traits in the clusters formed. For example using percentage frequency of occurrence of traits present in the North American clusters, organised traits for C1 is relatively high (spanning 12%-44%). For C2 organised traits span between 20%-80% frequency occurrence. In the case of the European cohort of serial murder C1 had equal presence of organised-disorganised crime scene criteria ranging in frequency of occurrence between 4%-64%. For C2 the frequency of occurrence for organised traits spanned between 44%-72%. This was further explored by considering the frequency of occurrence differential by collapsing the clusters containing disorganised traits and comparing the percentage frequency of occurrence across the North American and European samples. The cut-off point of difference considered had to be 16% or higher. By using this frequency of occurrence differential there were differences between North American and European serial killers in the extent to which specific traits appear in the MO. For North American serial killers, for instance, the disorganised traits of being a spontaneous event (28% differential) and leaving the victim unclothed (45% differential) occurred far more often than it did among the European cohort. Multiple stabbing (18% differential), killer stable (20% differential) and vulnerable victim (20% differential) featured more frequently among European serial killers. Also traits such as poisoned, victim a relative and removal of sex organs were not present among North American serial killers unlike their European counterparts where the differentials were 4%, 4% and 12% respectively. In the case of the frequency of occurrence differential for the organised traits, there were differences again. Killer mobile/transit (20% differential), shooting (24% differential), process focused (24% differential), rape (24% differential), body transported (16% differential), restraints (28% differential) and bondage (28% differential) featured strongly among the North American serial killers’ MO. For the other organised traits the differences were not as vast and in some cases the direction of difference was higher for the European cohort. These findings demonstrate that, when the extent of trait presence is examined, there are differences in the nature of MO used by North American and European serial killers - hence supporting hypothesis 3.
Hypothesis 4 Our fourth hypothesis stated that there would be core organised traits present across all clusters regardless of location. It also stated that these core organised traits will differ across
North American and European clusters. The presence of core organised traits was borne out by the data. Although the clusters differed in the frequency of occurrence of traits and also the prevalence of organised traits, the clusters across North American and European cohorts were similar. Clusters 1 (North American and European serial killers) contained the same organised traits with the exception of aggressive acts which appeared in C2 of the European cohort. Clusters 2 (North American and European serial killers) also featured the same organised traits with the exception of the European C2 containing aggressive acts. There is support for both aspects of hypothesis 4. It should be noted that this study was limited to North American and European male serial killers; future studies which include a wider variety of geographical areas and ethnicities might reveal a different outcome. To conclude the bottom-up approach to data analysis might provide a more objective means to ascertain the co-occurrence of crime scene criteria through statistically formulated clusters: in other words data drives theory. Therefore if there is any empirical support for the FBI classification, the traits present in clusters should corroborate those specified by the FBI rather than the theory dictating which crime scene criteria should co-occur. The findings in the current study highlight the combination of organised-disorganised crime scene criteria in both the North American and European serial killer sample used. This suggests Douglas, et al. [30] ‘mixed offender’ category has some validity. Given the difference in prevalence of organised and disorganised traits present (with the exception of C1 for European serial killers containing almost equal numbers), Canter et al.’s and Taylor et al.’s explanation of there being core organised traits present in all crimes is more fitting to the data. Furthermore, considering differences between serial killings based on disorganised traits might be more informative. Frequency of occurrence measures provides more insight to the subtle but inherent differences between North American and European serial killers’ MO. This study has uncovered cross-cultural differences in the MO of serial killing which could reflect geographical differences between North American and the European continent. Despite this, the current study is limited to Western societies. Future studies of this nature might consider a wider range of external factors including gender and ethnicity [5].
Acknowledgement We would like to thank Georgia Green for her contribution to this study.
References 1.
Ressler RK, Burgess AW, Douglas JE (1988) Sexual Homicide: Patterns and Motives. Lexington, MA: Lexington Books.
2.
Taylor S, Lambeth D, Green G, Bone R, Cahillane MA (2012) Cluster Analysis Examination of Serial Killer Profiling Categories: A Bottom-Up Approach. J Invest Psychol and Offender Profiling 9: 30-51.
Citation: Taylor S, Cahillane M, Workman L (2017) Adopting the Bottom-up Approach and Cluster Analysis on North American and European Male Serial Killers: A Follow-up Study. J Forensic Res Ana 1(1): dx.doi.org/10.16966/jfra.104
9
Sci Forschen Open HUB for Scientific Researc h
3.
Vronsky P (2004) Serial Killers: The Method and Madness of Monsters. New York: Berley Books.
4.
Gentleman A (2007) Police Ignore Serial Killings in Delhi Slum, Exposing Unequal Justice for India’s Poor’. The New York Times, USA.
5.
Ainsworth PB (2001) Offender Profiling and Crime Analysis.
6.
Harbort S, Mokros A (2001) Serial Murderers in Germany from 1945 to 1995: A Descriptive Study. Homicide Studies 5: 311-334.
7.
Morrison H, Godberg H (2004) My Life Among the Serial Killers: Inside the Minds of the World’s Most Notorious Murderers. New York: Avon Book.
8.
Pakhomou SM (2004) Serial killers: Offender’s relationship to the victim and selected demographics. Int J Police Sci Management 6: 219-233.
9.
Gerand C, Johnsson P (2010) Africa has more Serial Killers than U.S. and Europe. Afrik-News.
10. Hodgskiss B (2001) A multivariate model of the offence behaviours of South African serial murderers. Unpublished Masters thesis. Rhodes University, Grahamstown, South Africa. 11. Hodgskiss B (2004) Lessons from serial murder in South Africa. J Invest Psychol and Offender Profiling 1: 67-94. 12. Gorby B(2000) Serial murder: A cross-national descriptive study. Unpublished Master’s thesis. California State University: Fresno. 13. Hickey EW (2002) Serial Murderers and their Victims (3rd ed). Belmont: Wadsworth. 14. Labuschagne GN (2001) Serial Murder Revisited: A Psychological Exploration of Two South African Cases University of Pretoria, South Africa. 15. Labuschagne GN (2003) Offender Profiling in South Africa: Its Definition and Context. Acta Criminologica 16: 67-74. 16. Labuschagne GN (2004) Features and Investigative Implications of Multi Murder in South Africa. JIPOP 1: 191-206. 17. Salfati CG, Bateman AL (2005) Serial Homicide: An Investigation of Behavioural Consistency. JIPOP 2: 121-144.
Journal of Forensic Research and Analysis Open Access Journal
18. Salfati CG, Canter D (1999) Differentiating Stranger Murders: Profiling Offender Characteristics from Behavioural Styles. Behav Sci Law 17: 391-406. 19. Salfati CG, Dupont F (2006) Canadian Homicide: An Investigation of Crime-Scene Actions. Homicide Stud 10: 118-139. 20. Salfati CG, Haratsis E (2001) Greek homicide: A behavioral examination of offender crime-scene actions.. Homicide Stu 5: 363-387. 21. Santtila P, Canter D, Elfgren T, Häkkänen H (2001) The Structure of Crime Scene Actions in Finnish Homicides. Homicide Stud 5: 363-387. 22. Thijssen J, de Ruiter C (2011) Instrumental and Expressive Violence in Belgian Homicide Perpetrators. JIPOP 8: 58-73. 23. Field JL, Johnson L, Kim S, Salfati CG (2006) Examining Expressiveness and Instrumentality in Serial Murder and Distances Travelled by Offenders, USA. 24. Sorochinski M, Salfati CG (2010) The consistency of inconsistency in serial homicide: patterns of behavioural change across series. JIP-OP 7: 109-136. 25. Egger SA (1998) The Killers Among Us: An Examination of Serial Murder and its Investigation. Upper Saddle River NJ: Prentice Hall. 26. Canter DV, Wentink N (2004) An Empirical Test of Holmes and Holmes’ Serial Murder Typology. Criminal Justice and Behaviour 31: 489-515. 27. Canter DV, Alison LJ, Alison E, Wentink N (2004) The Organized / Disorganized Typology of Serial Murder: Myth or Model? Psychology, Public Policy, and Law 10: 293-320. 28. Bartholomew DJ, Steele F, Moustaki I, Galbraith JI (2002) The Analysis and Interpretation of Multivariate Data for Social Scientists. London: Chapman & Hall/CRC. 29. Everitt BS (1993) Cluster Analysis (3rd Edition). Halstead: Heinemann. 30. Douglas JE, Munn C (1992) Violent Crime Scene Analysis: Modus Operandi, Signature and Staging. FBI Law Enforcement Bulletin 61: 1-10.
Citation: Taylor S, Cahillane M, Workman L (2017) Adopting the Bottom-up Approach and Cluster Analysis on North American and European Male Serial Killers: A Follow-up Study. J Forensic Res Ana 1(1): dx.doi.org/10.16966/jfra.104
10
Sci Forschen
Journal of Forensic Research and Analysis Open Access Journal
Open HUB for Scientific Researc h
Appendix 1 North American serial killers No. of clusters
Agglomeration last step
Coefficients this step
Change
2
267.288
223.553
43.735
3
223.553
198.325
25.228
4
198.325
177.826
20.499
5
177.826
163.554
14.272
6
163.554
151.748
11.806
No. of clusters
Agglomeration last step
Coefficients this step
Change
2
258.519
216.106
42.413
3
216.106
192.627
23.479
4
192.627
178.584
14.043
5
178.584
166.789
12.795
6
166.789
155.165
11.624
European serial killers
Table A: Re-formed agglomeration table for North American and European serial killer data.
Citation: Taylor S, Cahillane M, Workman L (2017) Adopting the Bottom-up Approach and Cluster Analysis on North American and European Male Serial Killers: A Follow-up Study. J Forensic Res Ana 1(1): dx.doi.org/10.16966/jfra.104
11