SANDIA REPORT SAND2007-4298 Unlimited Release Printed July 2007
Advanced Modeling and Simulation to Design and Manufacture High Performance and Reliable Advanced Microelectronics and Microsystems Kevin G. Ewsuk, Thomas Hinklin, Michael Neilsen, Rajan Tandon, Jose G. Arguello, James F. Dempsey, David Holcomb, Ian Nettleship and Michael Lanagan
Prepared by Sandia National Laboratories Albuquerque, New Mexico 87185 and Livermore, California 94550 Sandia is a multiprogram laboratory operated by Sandia Corporation, a Lockheed Martin Company, for the United States Department of Energy’s National Nuclear Security Administration under Contract DE-AC04-94AL85000. Approved for public release; further dissemination unlimited.
Issued by Sandia National Laboratories, operated for the United States Department of Energy
by Sandia Corporation. NOTICE: This report was prepared as an account of work sponsored by an agency of the United States Government. Neither the United States Government, nor any agency thereof, nor any of their employees, nor any of their contractors, subcontractors, or their employees, make any warranty, express or implied, or assume any legal liability or responsibility for the accuracy, completeness, or usefulness of any information, apparatus, product, or process disclosed, or represent that its use would not infringe privately owned rights. Reference herein to any specific commercial product, process, or service by trade name, trademark, manufacturer, or otherwise, does not necessarily constitute or imply its endorsement, recommendation, or favoring by the United States Government, any agency thereof, or any of their contractors or subcontractors. The views and opinions expressed herein do not necessarily state or reflect those of the United States Government, any agency thereof, or any of their contractors. Printed in the United States of America. This report has been reproduced directly from the best available copy. Available to DOE and DOE contractors from U.S. Department of Energy Office of Scientific and Technical Information P.O. Box 62 Oak Ridge, TN 37831 Telephone: Facsimile: E-Mail: Online ordering:
(865) 576-8401 (865) 576-5728
[email protected] http://www.osti.gov/bridge
Available to the public from U.S. Department of Commerce National Technical Information Service 5285 Port Royal Rd. Springfield, VA 22161 Telephone: Facsimile: E-Mail: Online order:
(800) 553-6847 (703) 605-6900
[email protected] http://www.ntis.gov/help/ordermethods.asp?loc=7-4-0#online
2
SAND2007-4298 Unlimited Release Printed July 2007
Advanced Modeling and Simulation to Design and Manufacture High Performance and Reliable Advanced Microelectronics and Microsystems K.G Ewsuka, T. Hinklina, M. Neilsenb, R. Tandonc, J.G. Arguellod, J. F. Dempseye, D. Holcombf, I. Nettleshipg, and M. Lanaganh a
Ceramic Processing and Inorganic Materials Department, Sandia National Laboratory, PO Box 5800, Albuquerque, NM 87185-1349 b
Applied Mechanics Development Department, Sandia National Laboratory, PO Box 5800, Albuquerque, NM 87185-0847 c
Materials Reliability Department, Sandia National Laboratory, PO Box 5800, Albuquerque, NM 87185-0889
d
Strategic Initiatives Department, Sandia National Laboratory, PO Box 5800, Albuquerque, NM 87185-0376 e
Solid Mechanics Department, Sandia National Laboratory, PO Box 5800, Albuquerque, NM 87185-0372 f
g
Geomechanics Department, Sandia National Laboratory, PO Box 5800, Albuquerque, NM 87185-0751
Department of Materials Science & Engineering, University of Pittsburgh, 848 Benedum Hall, Pittsburgh PA 15261 h
Materials Research Institute, The Pennsylvania State University University Park, PA 16802
3
Abstract An interdisciplinary team of scientists and engineers having broad expertise in materials processing and properties, materials characterization, and computational mechanics was assembled to develop science-based modeling/simulation technology to design and reproducibly manufacture high performance and reliable, complex microelectronics and microsystems. The team’s efforts focused on defining and developing a science-based infrastructure to enable predictive compaction, sintering, stress, and thermomechanical modeling in “real systems,” including: 1) developing techniques to and determining materials properties and constitutive behavior required for modeling; 2) developing new, improved/updated models and modeling capabilities, 3) ensuring that models are representative of the physical phenomena being simulated; and 4) assessing existing modeling capabilities to identify advances necessary to facilitate the practical application of Sandia’s predictive modeling technology.
4
Acknowledgements This work was funded by Sandia National Laboratory’s Laboratory Directed Research & Development program (LDRD).
Sandia is a multiprogram laboratory operated by Sandia
Corporation, a Lockheed Martin Company, for the United States Department of Energy’s National Nuclear Security Administration under Contract DE-AC04-94AL85000.
5
6
Contents Abstract ........................................................................................................................................... 4 Acknowledgements......................................................................................................................... 5 List of Figures ................................................................................................................................. 9 Introduction................................................................................................................................... 11 Objectives ................................................................................................................................. 12 Results and Discussion ................................................................................................................. 13 Materials, Characterization, and Modeling for Multilayer Microelectronic Packaging and Multi-Material Systems ............................................................................................................ 13 Characterization and Modeling the Properties of DuPont 951 LTCC Tape......................... 14 951 LTCC Tape Microstructure........................................................................................ 15 951 LTCC Tape Glass Phase Properties........................................................................... 16 951 LTCC Tape Composite Properties............................................................................. 17 951 LTCC Tape Composite Stresses. ............................................................................... 17 951 LTCC Tape Composite Stress Model. ....................................................................... 19 Coupled Thermomechanical modeling for 951 LTCC Tape. ........................................... 20 New Materials for Microelectronics Packaging ................................................................... 20 Cofirable PZT. .................................................................................................................. 20 New Materials Characterization Equipment and Technology.................................................. 21 Characterizing Thick Film Sintering .................................................................................... 21 Characterizing Deformation in Bulk Materials..................................................................... 22 Predicting Sintering behavior with master sintering curves (MSCs).................................... 23 Determining the Stress Free Temperature of multi-materials systems containing glass ...... 25 Characterizing and Modeling Microstructure and Microstructure Evolution .......................... 26 Characterizing Powder Compact Properties and Compaction Constitutive Behavior.......... 26 Characterizing and Modeling Microstructure Evolution During Sintering .......................... 31 Microstructure in Ideal and Real Systems. ....................................................................... 31 Microstructure and Densification. .................................................................................... 32 Microstructure Analysis using Pore Boundary Tessellation............................................. 34 Microstructure evolution and densification in ZrO2-3mol%Y2O3.................................... 34 Modeling Technology Development, Refinement, Testing, and Validation ............................ 36 Model Updates ...................................................................................................................... 36 Updating the Sandia Compaction Model.......................................................................... 37 Updating the Sandia Sintering Models. ........................................................................... 37 Developing Coupled Modeling............................................................................................. 37 Coupled Compaction and Sintering Modeling. ................................................................ 38 Coupled Sintering and Stress Modeling. .......................................................................... 38 Model Enhancements............................................................................................................ 39 Subincrementation. ........................................................................................................... 39 Determining Modeling Parameters and Parameter Sensitivity......................................... 40 Summary ....................................................................................................................................... 42 References..................................................................................................................................... 43
7
Appendix A................................................................................................................................... 45 Appendix B ................................................................................................................................... 55 Appendix C ................................................................................................................................... 63 Appendix D................................................................................................................................... 87 Distribution ................................................................................................................................... 96
8
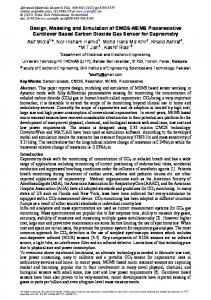
List of Figures Figure 1: A representative microstructure of sintered 951 LTCC tape.
15
Figure 2: Tg and Ts of the glass phase in sintered 951 LTCC tape.
16
1.5
Figure 3: Vickers Hardness and Pc
as a function of load for sintered 951 LTCC tape.
17
Figure 4: A two-phase unit cell model, and the predicted tensile stress from FE modeling.
19
Figure 5: Results of coupled thermal (left) and stress modeling (right) of a 951 LTCC multilayer package containing embedded heaters.
20
Figure 6: Schematic of the TOMMI with the cyclic loading attachment.
22
Figure 7: The master sintering curve for ZnO powder pressed uniaxially in a steel die to compact green density (ρi) of 46, 51, or 56% of theoretical density (TD). In combination, the curves make up a master sintering surface from which the effects of changes in green density on sintering behavior can be predicted and controlled.begins to deform (i.e. curve) under the influence of the (different) coefficient of thermal expansion (CTE) of the glass/composite during cooling. Utilizing the exact glass stress-free temperature as opposed to estimations based on the measured glass transition temperature (Tg) will enable more accurate finite element (FE) modeling of residual stresses in multi-material systems such as glass seals, which will also enable more predictive reliability modeling.
25
Figure 8: The density-pressure compaction response of granulated ZnO powder.
28
Figure 9: (Top) The evolving yield surface of the GeoModel plotted as deviatoric stress (J20.5) as a function of invariant stress (I1), and how it relates to the (bottom) measured axial versus volumetric strain in a particulate body during compaction. 30 Figure 10: (left) A three-dimensional, idealized grain-pore geometry used in the Coble[23] phenomenological model for final-stage sintering showing spherical pores at each apex of a tetrakaidecahedron-shaped grain, and (right) its common twodimensional representation.[31].
31
Figure 11: A representative, low magnification SEM micrograph of ZrO2-3mol%Y2O3 showing fewer, larger, and more widely spaced pores interspersed in dense multigrain areas after sintering at 1275°C for 5 hours.[24]
32
Figure 12: A two-dimensional representation of the non-ideal ZrO2-3mol%Y2O3 microstructure with more than one grain between large pores during later-stage sintering. [24] By comparison to classical sintering models, vacancies must migrate to and be annihilated along the multiple grain boundaries between pores, and over a larger multigrain unit area (in bold) to result in densification during sintering. 33 Figure 13: Tessellation cells in a ceramic microstructure.
9
34
10
Introduction Within the legacy Sandia Engineering Analysis Code Access System (SEACAS) and the multi-physics SIERRA platform, Sandia has developed and compiled an impressive sciencebased engineering capability to conduct, among other things, stress modeling (e.g., with JAS3D and Adagio), thermal modeling (e.g., with Calore), process modeling (e.g., with Skorohod Olevsky Viscous Sintering, SOVS, model and Riedel-Svoboda sintering model), and reliability modeling (e.g., with FailProb). However, despite this extensive capability, models finite element (FE) codes like Adagio have primarily been used in a reactive or response mode to assess and troubleshoot specific problems that arise with materials and/or components in production. There is considerable, but currently largely unrealized potential and value in proactively using the science-based engineering capability within Sandia’s computational modeling portfolio to accelerate the integration of experimentally-validated theoretical knowledge into design tools that engineers can use innovatively to realize products faster and cheaper, and with greater performance margins. Additionally, through a combination of characterization and modeling, it should be possible to establish more quantitative science-based understanding of the uncertainty in design margins to improve confidence in the performance of specialty components. Through an interdisciplinary team of scientists and engineers with expertise in materials processing and properties, materials characterization, and computational mechanics, we set out to integrate scientific understanding, experiment, testing, and predictive component and system engineering into a dramatically more responsive product realization process.
Through a
combination of characterization, modeling, and model validation, we set out to draw upon an appropriate combination of scientific discovery and engineering tool development to demonstrate the ability to conduct and apply Sandia’s model-based engineering technology in product design and manufacturing, with a focus on developing experimentally-validated simulation tools that can be applied to improve designs for manufacturability, to better understand and control processing, and to reproducibly fabricate high performance and reliable, complex microelectronics and microsystems.
11
Objectives Based on previous work completed on ceramic powder compaction[1-5], we know that a combination of materials characterization, modeling, and model validation can be used to develop predictive simulation technology targeted to design and manufacturing[6], e.g., to manufacture multi-material multilayer microelectronic packages. In this study, the focus was on defining and developing the science-based infrastructure necessary to enable predictive sintering, stress, thermomechanical, and reliability modeling, including: i) developing characterization techniques and determining the materials properties and/or constitutive behavior required as input for predictive modeling; ii) ensuring that the models predict behavior representative of the physical phenomena being simulated; and iii) facilitating the practical application of Sandia’s predictive modeling technology An overall objective of this study was to develop critical technology and infrastructure to facilitate the practical application of Sandia’s science-based modeling technology to design advanced materials systems, such as microelectronic packages and advanced microsystems. The intent was that this project would contribute to the development of seamless, flexible, and responsive manufacturing infrastructure that enables the cost-effective, reliable delivery of high quality product in less time to potentially enable; 1) reduced time-to-product cycle in design, fabrication, and qualification, 2) innovations that improve the design/manufacturing process to include reliable design concepts, design tools, and processes, 3) science and technology to advance the development of electronics, electromechanical systems, telemetry systems, advanced sensors, and technologies, 4) enhanced process flexibility and process reliability, and rapid small build technology to fabricate specialty and small lots of hardware from conventional and novel materials, faster, more reliably, and at lower cost, 5) development of lower weight, volume, and cost microelectronics and components with enhanced system capabilities, 6) development of computer-based modeling and simulation tools to improve our understanding and control of the inter-relationships between processing and performance, and to develop robust manufacturing processes,
12
7) development of a design-for-performance manufacturing infrastructure to support low volume, high reliability, high consequence manufacturing needs at Sandia, 8) development of useful design rules for manufacturability that can ultimately be incorporated into product design and manufacturing guidance, and 9) development of flexible, reliable, and cost effective design and process technologies that can be used to make and package advanced components.
Results and Discussion An interdisciplinary team of scientists and engineers having broad expertise in materials processing and properties, materials characterization, and computational mechanics was assembled to develop science-based modeling/simulation technology to design and reproducibly manufacture high performance and reliability, complex microelectronics and microsystems. Their efforts focused on defining and developing a science-based infrastructure to enable predictive modeling in “real systems.” The areas addressed in this study include 1) Materials, Characterization, and Modeling for Multilayer Microelectronic Packaging and Multi-Material Systems; 2) New Materials Characterization Equipment and Technology; 3) Characterizing and Modeling Microstructure and Microstructure Evolution; and 4) Modeling Technology Development, Refinement, Testing, and Validation
Materials, Characterization, and Modeling for Multilayer Microelectronic Packaging and Multi-Material Systems Multilayer ceramic technology offers a cost-effective and versatile approach to design and manufacture high performance and reliability, three-dimensional (3D) microelectronic packages.[7] The ability to integrate functionally different materials into a 3D package is an attribute of multilayer ceramic technology; however, multiple materials integration can also be a liability. Materials and processing control are critical in the design and reproducibly manufacturing of reliable multilayer, multi-material packages. Together, science-based understanding, developed through modeling and characterization, and practical expertise can be applied to systematically develop more compatible materials systems, more complex (integrated) systems, and more cost effective and robust processes.
13
Low temperature co-fire ceramic (LTCC) electronic packaging technology is presently being used to produce components for telemetry, satellites/radar, and MEM systems.[7] LTCC technology provides microelectronic package designers an option for interconnect packaging that offers parallel processing, excellent dielectric isolation, and high layer count circuitry, as well as, high performance conductors, and simple and inexpensive processing. It combines the benefits of both high temperature co-fire ceramics and thick film technologies by providing for a high density, high reliability, high performance, and low cost interconnect package. Dielectric ceramic tape represents one of the major components in a LTCC microelectronic package. One example, the DuPont, low-temperature 951 Green Tape™ is a gold and silver compatible, low coefficient of thermal expansion, high strength glass/ceramic tape. The functionality, performance, and reliability of an LTCC microelectronic package are determined by the properties and compatibility of the materials within the package, as well as how those materials are co-processed. For example, the ability to control the sintering behavior of the dielectric ceramic tape is critical for reproducible processing of reliable LTCC packages. The development of advanced packaging with enhanced functionality hinges on developing new, cofirable materials/systems, characterizing and understanding material and composite properties, and being able to predict and control processing, properties, and reliability. All three areas have been addressed in this study. Characterization and Modeling the Properties of DuPont 951 LTCC Tape. Quantitative predictions hinge on accurate models and modeling. As determined in work conducted at Sandia by Tandon et al.[8] and by Dannheim et al.[9], lifetime reliability predictions for LTCCs are sensitive to the peak stress in the package. As such, inaccurate stresses predicted using an inadequate model will contribute to inaccurate lifetime reliability predictions. We need to be sure that the models we use predict behavior representative of the physical phenomena being simulated. This is accomplished by evaluating the models, and by testing and validating model predictions relative to experimental measurements.[10] Deviations between model and experiment can be used to identify critical deficiencies, should any exist. The DuPont 951 LTCC tape has a complex microstructure consisting of alumina ceramic particles in a glass matrix. As such, a very complex stress state can be generated in the LTCC just by free thermal expansion of this material. The goal of this study was to assess the
14
Figure 1: A representative microstructure of sintered 951 LTCC tape.
feasibility of predicting the properties of the DuPont 951 LTCC tape (composite) from the properties of its constituents (i.e., the glass, alumina, and porosity). A finite element (FE) model of a representative volume of DuPont 951 LTCC tape can be subjected to various macroscopic deformations, either mechanically or through temperature cycling, to investigate the relationship between the macroscopic “average” stress and the stresses determined computationally and experimentally (e.g., by indentation) in the individual phases that comprise the LTCC tape (see Appendix A). This approach has previously been used at Sandia to study the micromechanics of the DuPont 4596 platinum/palladium/gold metallization for LTCC packaging.[11] The first step of the process is to determine the physical characteristics and properties of the individual phases, and then those of the composite LTCC structure. 951 LTCC Tape Microstructure. Figure 1 shows a representative scanning electron microscope (SEM) micrograph of sintered 951 tape showing the alumina (dark phase), the glass (light phase), and the porosity (black). Quantitative stereology was used to analyze 5 images to determine the amount of each phase present. Additionally, 237 intercepts over the 5 images were used to determine the alumina particle size. SEM contrast and point counting determined that there is 47.6 ± 1.7 % alumina, 49.5 ± 2.0 % glass, and 2.9 ± 0.9 % porosity present in the sintered LTCC. Assuming spherical
15
particles, the alumina particles have an average diameter of about 3.77 μm; however, this result may be biased to higher sizes by the inability to clearly define alumina/alumina boundaries (i.e., if there were alumina particles in contact or if the section was a single irregular particle). 951 LTCC Tape Glass Phase Properties. A glass representative of the glass phase in the sintered LTCC composite was prepared by heating a similar composition fritted glass powder to either 875°C or 1400°C on platinum foil. In both cases, some residual entrapped porosity remained in the re-melted glass, although less was present in the 1400°C sample. The density of the glass specimens after sintering was determined using the Archimedes liquid immersion technique. To determine the glass transition temperature (Tg), the glass softening temperature (Ts), and the coefficient of thermal expansion (CTE) of the glass, re-melted samples were heated at 5°C/min to 700°C in air flowing at 1 ml/min in a Netzsch Differential Dilatometer 402ED (Netzsch Instruments Inc., Selb, Germany). The results in Figure 2 indicate that the porosity has an effect on dilatometer determined Tg and Ts, but does not affect CTE. The CTE of the “representative glass phase in the sintered 951 LTCC tape from 25 - 575°C is 5.9 x 10⁻⁶ in/in/°C.
6.E-03
Ts = 699.5°C Ts = 694.6°C
5.E-03
dL/L
4.E-03
Tg = 600.8°C
3.E-03
Tg = 619.7°C
2.E-03 glass heated to 875C
1.E-03
glass heated to 1400C in Pt foil
0.E+00 0
100
200
300 400 500 Temperature (°C)
600
Figure 2: Tg and Ts of the glass phase in sintered 951 LTCC tape.
16
700
800
20
40 Indentation Parameter Hardness (right ordinate)
18
35
14 25
12 10
20
Hardness (GPa)
P/c3/2 (MPa.m1/2)
16 30
8
15
6 10 0
10
20
30
40
50
60
Indentation Load (N)
Figure 3: Vickers Hardness and Pc1.5 as a function of load for sintered 951 LTCC tape.
951 LTCC Tape Composite Properties. To determine the hardness and the fracture toughness of the sintered 951 LTCC tape, indentation experiments were performed as a function of load (P) on the LTCC material.[8] Vickers indentations were produced using loads ranging from 9.8–88.2 N, and crack lengths and impression sizes were measured immediately after indentation. The hardness of the material was measured to be 7.5 GPa (Figure 3) The indentation parameter, P/c1.5 was found to be approximately constant over load, and was used to calculate a toughness of 1.6 MPa.m0.5 for the sintered LTCC. 951 LTCC Tape Composite Stresses. Residual stresses are usually present in ceramics and glasses at the macro-scale as a result of processing, due to anisotropy, or due to differences in properties between the dissimilar materials that comprise the structure/component (e.g., LTCC tape). As such, characterization of the stress state on the micro-scale is essential for understanding the response of the material/component to service stresses, and to assess the reliability. This is particularly important
17
in microsystems (e.g., microelectronics packaging), where the entire component may only be a few grains of material though-the-thickness. Understanding and controlling residual stresses can play an important role in advanced design, prototyping, and manufacturing. In an ideal situation, during the design of a new component, the entire manufacturing process would be simulated, and stresses during manufacture would be calculated using FE analysis. However, realistic simulations can only be completed with experimentally-validated models (e.g., elastic, visco-elastic, or elastic-plastic constitutive models), and representative material property input data for the models. Experimentally measured residual stress can help to verify the fidelity of the input data, and to test and validate constitutive models. Residual stresses in ceramics are often measured using either a sharp Vickers indenter or a blunt spherical indenter. However, the use of these techniques has an inherent size limitation: the stress sampled is on the length scale of the characteristic crack size emanating from the indentation site. Decreasing the load decreases the crack size and results in a smaller volume being sampled; however, below a certain threshold load, cracks are not formed. This issue is further exacerbated in cases where a compressive stress are present, such as in multi-material systems (e.g. LTCC), as compression leads to an increase in the threshold load for cracking. Cube-corner indention circumvents some of the problems of traditional indentation techniques. The cube-corner indenter displaces approximately 3 times the volume of a Vickers or Berkovich’s indenter at the same projected contact area, significantly reducing the indentation cracking threshold load, and enabling the measurement of residual stresses in small volumes. The crack length in a stressed region is higher (or lower) than in an unstressed region depending on the sign of the stress (tensile or compressive), and is sensitive to the spatially varying stress field around the indent. [12] Experiments with a cube-corner indenter reveal that a load as low as ~2 N results in extensive lateral cracking and chipping in various ceramic materials.[13] A nano-indenter (MTS Nano Instruments, Oak Ridge, TN) can be utilized to apply lower loads. Load-controlled nanoindentation experiments have been performed in air using a constant strain rate of 0.05 s-1 for peak loads of 0.1, 0.25, 0.5, 1, and 1.5 N, and load (P)–displacement (d) data have been collected.[13] The surface traces of the three cracks emanating from each impression edge (c),
18
and the surface altitude of the projection of the equilateral triangle-shaped hardness impression (1.5a) are subsequently measured optically (at 500x magnification). We have an interest in assessing the feasibility of estimating properties from indirect measurements (e.g., nanoindentation) [13] on small features and/or near interfaces that cannot be characterized directly.
Sintered 951 LTCC tape samples to conduct nano-indentation
experiments to measure local stress state in the glass near alumina particles have been fabricated for analysis, and once the nano-indentation measurements have been made, they will be compared to FE results described in the following section. 951 LTCC Tape Composite Stress Model. To assess the feasibility of predicting composite properties from the properties of its constituents, two-phase geometries representative of the DuPont 951 low temperature cofired ceramic alumina/glass composite were constructed using unit or multi cells, and FE modeling of a representative volume was subjected to various macroscopic deformations to determine composite properties and spatial stresses (see Appendix A). Initially, unit-cell and multi-cell models with either spherical (Figure 4) or cubic alumina particles were created. Then, an approach for predicting LTCC properties from finite element analyses on the microstructure was developed. The relationship between elastic moduli for the glass phase and the LTCC was studied.
Finally, internal stress generated by free thermal expansion of the LTCC was
investigated. A comparison of predictions generated with a body centered cubic (BCC) packing model with spherical particles and the simple cubic model with cubic particles showed that the
+ spherical alumina
Figure 4:
= glass matrix
alumina/glass composite
predicted tensile stress in glass phase
A two-phase unit cell model, and the predicted tensile stress from FE modeling.
19
Figure 5:
Results of coupled thermal (left) and stress modeling (right) of a 951 LTCC multilayer package containing embedded heaters.
predictions are affected by the microstructural geometry but not significantly; thus, a model that only approximates the true LTCC geometry will generate much useful information (see Appendix A). Coupled Thermomechanical modeling for 951 LTCC Tape.
Calagio, a thermomechanical model that couples the Calore thermal model with the Adagio stress model, has been used to design and develop embedded resistor heaters in LTCC packages. Capabilities to complete coupled modeling have also being developed and employed. The thermal and stress gradients resulting from heating an embedded resistor in a multilayer microelectronics package has been modeled using Calagio (Figure 5), and has been tested and validated by comparison to experimental measurements. New Materials for Microelectronics Packaging Cofirable PZT.
Multilayer ceramic sensors and actuators are comprised of alternating Pb(Zr,Ti)O3 (PZT) and metal layers which are heat-treated at high temperatures. One of the major challenges in cofiring multilayer electronic components is controlling the sintering process to prevent warping,
20
cracking, and high porosity. Through a collaborative effort that integrated the piezoelectric materials expertise of Penn State University with Sandia National Laboratory’s expertise in ceramic sintering, we set out to develop a fundamental understanding of the sintering behavior of PZT ceramics, and ultimately, the co-firing of multilayer ceramic/conductor laminates. Three PZT compositions were evaluated; two from TRS Technologies Inc., and the third developed at Penn State. The effects of Li2CO3 and LiBiO2 fluxes on sintering behavior were examined. The Li-based fluxes significantly reduce the PZT sintering temperature from 1100°C to 850°C, making the material potentially co-firable with silver and copper electrodes. Theoretical density (8 g/cm3) was achieved at 850oC for 2% flux addition for the commercial PZT composition. The dielectric constant (K), and piezoelectric coefficient (d33) were maintained at high levels for the fluxed PZT compositions. (see Appendix B).
New Materials Characterization Equipment and Technology
Accurate property data and materials constitutive models are essential for quantitative predictions. However, data can be expensive to obtain. Therefore, to enable predictive modeling, a combination of reliable but efficient direct characterization techniques need to be considered along with good estimates and/or reasonable approximations. One area of need, for example, was to develop specialized capabilities to characterize the sintering (i.e., constitutive) behavior of thick film materials used in the fabrication of microelectronics packaging. To determine representative materials parameters to support predictive sintering and stress modeling, two new characterization capabilities were developed. Additionally, the master sintering curve (MSC) concept was expanded as a potential tool to estimate properties (e.g., input parameters) for modeling. Characterizing Thick Film Sintering To characterize the constitutive (sintering) behavior of thick film materials, a non-contact laser measurement system was designed. The equipment will allow us to characterize the time and temperature dependent behavior of thick or thin films deposited on thin silicon wafers from ambient to elevated temperature (≤1400°C). The system will be computer-interfaced, and a LabVIEW software program will control the experiment and collect the data automatically. The newly designed, computer-interfaced 3-beam system will afford accurate in situ measurements of
21
Figure 6: Schematic of the TOMMI with the cyclic loading attachment.
sintering shrinkage and in-plane sintering stress of thin and thick film materials to support predictive modeling (e.g., of microelectronics). With the new equipment, sintering shrinkage through the tape thickness can be characterized in situ using a laser reflectance technique.[14][15] Additionally, based on the in situ measured curvature, stresses during sintering/heat treatment can be determined using the Stoney method. [16][17-19][20] Characterizing Deformation in Bulk Materials To characterize the properties of bulk materials to support predictive modeling, the capability to complete controlled cyclic loading at temperature (e.g., creep/deformation measurements) was added to our recently acquired novel thermo-optical mechanical measuring instrument, TOMMI (Institut für Silicatforschung ISC Neunerplatz 297082, Würzburg, Germany). The TOMMI is a novel measuring device for the control of thermal processes that affords the characterization of samples 16 x 7 x 17 cm up to a temperature of 1750°C in air. The deformation of the sample is measured optically with a CCD camera through a 5 cm diameter measuring window to a resolution of 2 μm. An interfaced computer controls the experiment and automatically collects the data. The new loading feature allows us to measure creep/deformation in samples loaded uniaxially (see Figure 6 for a schematic). This new capability provides us the ability to complete controlled sintering experiments under different loads that, with DAKOTA, will allow us to
22
efficiently determine the materials parameters required by the Riedel-Svoboda (RS) sintering model in JAS 3D. Sinter forging experiments have been completed on various ceramic and glass composites using the TOMMI to determine the ceramic sinter viscosity for the SkorohodOlevsky Viscous Sintering (SOVS) model within the JAS3D FE code. Experiments have also been completed to verify the capability of the TOMMI to characterize anisotropic sintering behavior, which is typically observed in cast tapes used to fabricate multilayer microelectronic packages. Using the TOMMI, we have also established the capability to characterize the viscosity of glasses and glass composites. Experiments based on ASTM standards[21-23] have been completed to determine glass viscosity using the beam bending technique, and to determine glass composite viscosity using the parallel plate (compression) technique.[24, 25] We have demonstrated the capability to make good viscosity measurements on 6mm diameter x 12 mm tall right circular cylinders of NIST glass samples 710a and 717, and have successfully used the TOMMI to measure the viscosity of particulate filled glass composite bodies. Viscosity measurements were conducted on 710a up to 800°C with loads of 1, 2, 5, and 10 N, and heating rates of 10°C/min to establish calibration parameters for further measurements. This calibration and capability demonstration provided the basis for viscosity measurements of fabricated silverfilled glass composites in both as-pressed and sintered states. Predicting Sintering behavior with master sintering curves (MSCs) The feasibility of using the master sintering curve (MSC) to predict process dependent (sintering) constitutive behavior to facilitate numerical modeling was assessed. The MSC is an empirical curve that provides a characteristic measure of the densification of a material over a given density range. A unique MSC can be constructed for a given material processed in a given way. Once constructed, the MSC can be used to predict density and densification rates for different time-temperature processing conditions. Predictions can be made for virtually any combination of sintering time and temperature on the basis of just a few simple dilatometric sintering experiments.[26] In this study, the objective was to extend the MSC concept to construct a master sintering surface (MSS) that can be applied to predict sintering behavior as a function of time, temperature, and starting green density.
23
The study was completed on a fine particle size ZnO powder (0.2 mm, Aldrich Chemical Co., St. Louis, MO) ZnO powder granulated with 2 wt% of a 50:50 mixture of polyvinyl alcohol (Airvol 203, Air products and Chemicals, Inc., Allentown, PA) (PVA) and polyethylene glycol (Polyethylene glycol 20,000, Fluka Chemical, Buchs, Switzerland) (PEG) binder solution with 23 ml of Darvan 821A / 500g of ZnO (one monolayer). Granulated powder for pressing was prepared by pan granulation and subsequently passing through a Retsch ZM100 Ultra Centrifugal Mill (Retsch,Inc., Newtown, PA, 18940). The pan-granulated ZnO was sieved using a 170 mesh (88 μm) screen and the fines were used for pressing. Specimens for sintering were prepared by uniaxial dry pressing powder in a 6.35 mm (0.25”) diameter steel die in a Powder Testing Center Model PTC-02DT (KCK Powder Tech Corp., Baltimore, MD) to produce nominally 46, 51 or 56% dense pellets. In preparation for sintering, the organic binder in the green ZnO-pressed powder compact was burned out by heating in air at 1°C/min to 450°C and holding for 2 h. The density of the ZnO test specimens after binder burnout was determined from the measured sample dimensions and mass. To characterize sintering, dilatometric linear shrinkage measurements were made on ZnO powder compacts during constant heating rate experiments of 5, 10, 15, and 20°C/min to 1050°C using a Netzsch 402C dual pushrod Dilatometer (Netzsch Instruments Inc., Selb, Germany). To ensure experimental consistency, a minimum of two samples were characterized at each heating rate. The density of the ZnO test specimens after sintering was determined from the measured sample dimensions and mass, and by using the Archimedes liquid immersion technique. The activation energy (Q) for sintering was determined from the sintering data using a technique described in previous work [26].
The MSC for each green density was then
determined from the measured sintering data and the calculated Q [26]. From the three MSCs constructed for the three different green densities (ρi) studied, a MSS was constructed that can be used to predict the time, temperature, and green density dependent densification behavior of the ZnO ceramic (Figure 7). This MSS provides the potential to efficiently determine densification behavior as a function of green density. Additionally, the MSS can be used to interpolate between measured MSCs to predict representative sintering behavior that can be used as input into the SOVS model in JAS 3D to simulate sintering.
24
This work will support efforts to; a) facilitate modeling by using techniques like the master sintering curve (MSC)[10, 26, 27] to predict process dependent (sintering) constitutive behavior; b) approximate properties from measurements made on similar materials and families of materials; and c) estimate properties and modeling parameters (e.g., for sintering models) from measured (sintering) behavior using advanced computational tools (e.g., Dakota). Determining the Stress Free Temperature of multi-materials systems containing glass Taking advantage of the non-contact optical characterization capability of the TOMMI, a powerful new technique has been developed to determine the stress-free temperature of a glass or glass composite. By sintering a thick film coating on a thin silicon wafer and cooling, the exact stress-free temperature is easily determined by recording the temperature at which the Si wafer
1.0 ρi=
Relative Density
0.9
46u 51u 56u
0.8 0.7 0.6 0.5
Uniaxially Pressed ZnO -18
10
-17
10
-16
10
-15
10
-14
10
-13
10
θ (t,T(t)) Figure 7:
The master sintering curve for ZnO powder pressed uniaxially in a steel die to
compact green density (ρi) of 46, 51, or 56% of theoretical density (TD). In combination, the curves make up a master sintering surface from which the
effects of changes in green density
on sintering behavior can be predicted and controlled.begins to deform (i.e. curve) under the influence of the (different) coefficient of thermal expansion (CTE) of the glass/composite during cooling. Utilizing the exact glass stress-free temperature as opposed to estimations based on the 25
measured glass transition temperature (Tg) will enable more accurate finite element (FE) modeling of residual stresses in multi-material systems such as glass seals, which will also enable more predictive reliability modeling.
Characterizing and Modeling Microstructure and Microstructure Evolution
Characterizing Powder Compact Properties and Compaction Constitutive Behavior In the manufacture of ceramic components, near-net-shape parts are commonly formed by uniaxially pressing granulated powder in a rigid die. Density gradients introduced into a powder compact during press-forming can degrade the performance and reliability of the finished, sintered part. Finite element method (FEM) modeling can be used to predict powder compaction response, and can provide insight into the causes of density gradients in green powder compacts and how to avoid them. Accurate numerical simulations require accurate material properties and realistic constitutive laws.
Determining constitutive properties is challenging for materials such as
powders or powder compacts which undergo large strains during compaction, and that have density dependent moduli. Standard techniques, which measure deformation between two points, are not reliable because of the inevitably non-uniform deformation of compacting powders. Meaningful strain measurements, and, in particular, modulus determinations, requires measurement techniques that account for the deformation of the entire sample. Zeuch et al.[28] implemented an advanced cap plasticity model within the finite element framework to realistically simulate powder compaction using directly measured powder properties and compaction behavior. A refined a soil mechanics approach was used to directly measure the eight parameters that are required for the modified Drucker-Prager cap plasticity model. To accommodate the large strains associated with compacting a low bulk density ceramic powder, a two-stage process was developed; first to accurately determine the pressure-density relationship of a ceramic powder in hydrostatic compression, and then to determine the properties of that same powder compact under deviatoric loading. Hydrostatic and triaxial compression experiments were performed using a liquid-medium, triaxial testing cell consisting of a cylindrical, 200 MPa (29,000 psi) pressure vessel. The upper end of the enclosure was penetrated by a moveable piston mounted in a servo-controlled, 978,600 N (220,000 lb.) capacity
26
MTS load frame to permit deviatoric loading of the specimen. Coaxial electrical feed-throughs permitted direct strain measurements on specimens using various types of transducers, including standard foil strain gauges and linear variable displacement transducers (LVDTs). Pressure was measured using a standard, 207 MPa (30,000 psi) capacity pressure cell with a resolution of ±0.3 MPa (±45 psi). A 66,700 N (15,000 lb.) capacity internal load cell having a resolution of ± 169 N (±38 lb.) was used to measure the deviatoric load applied to the specimen. From a practical point of view, laboratory testing is expensive. For gauged specimens, the expense is driven by the gauges; calibration, installation, removal and data reduction are timeconsuming and thus expensive. Since the work described above was completed, Sandia has further addressed these problems in subsequent work on soils, which are essentially SiO2 powders. That work resulted in the development of techniques to determine the elastic moduli, true volumetric strains, and individual strain components continuously during the course of a compaction test, without the need for gauges on the sample or removing the sample from the vessel. The result is a much higher quality data set and a lower test cost, as compared to conventional techniques. Additionally, these techniques can be applied equally well to specimens of uncompacted powers or pre-compacted specimens. These improved characterization techniques were applied to characterize the (previously described) pan granulated ZnO (see Appendix C). Test slugs were fabricated by pre-pressing ~150g of -170 mesh granulated ZnO powder in a 3.5 cm (1.375”) diameter steel die at 10 MPa (1450 psi) to form a 35 mm diameter by ~ 63 mm tall cylindrical powder compact have in a relative density of ~44%.
These compacts were then further compacted by cold isostatic
pressing (CIPing) at pressures of 20.7, 27.6, 34.5, 41.4, 48.3, 55.2, 69, and 138.3 MPa (3, 4, 5, 6, 7, 8, 10, and 20 kpsi) to produce a suite of samples having relative densities ranging from ~49.9% to 58.7% ±0.5% (Figure 8). These pressed specimens were subsequently machined to 2.5 cm (1”) diameter by 5.1 (2”) tall right circular cylinders for triaxial testing. In previous work completed at Sandia,[28] hydrostatic and triaxial test data were digitized and stored on hard disk using an IBM PC-type computer and the data acquisition program DATAVG. The data were subsequently reduced using PSI-Plot (Version 5), and were then fitted to a simple, two-surface cap model [28] (e.g., the Sandia Cap Model used with the UNIPACK powder compaction code[29]).
27
The Sandia GeoModel provides much more generality than its predecessor, and is thus capable of providing a more accurate representation of the powder compaction process. Additionally, it is possible to relate the evolving yield surface of the GeoModel to the measured volumetric deformation (Figure 9), and, also, to relate the measured constitutive behavior to the physical changes occurring on the micro-scale within a particulate body during compaction.
This
provides the potential to establish a physical basis for the measured constitutive behavior to better understand and control compaction, and possible even the effects of heterogeneities on compaction. In the GeoModel, volumetric strain deformation from a compaction-dominated response during pore collapse occurs initially, followed by a volume-expansion-dominated response. In ceramic powder compaction, pore elimination correlates with the rearrangement of granules and possible even some initial lower pressure deformation of the granules to fill in the larger inter-granule pores. The dilation deformation process is one of later stage deformation of the granules at higher pressure via frictional sliding and possibly even the fracture of individual grains.
Relative Density (%)
60 58 56 54 52 50 20
40
60
80
100 120 140
CIP Pressure (MPa) Figure 8: The density-pressure compaction response of granulated ZnO powder.
28
By taking advantage of the latest developments, a number of shortcomings of the earlier cap plasticity model have been overcome using the GeoModel. Furthermore, the work in this study is based on a logarithmic strain measure as opposed to the engineering strain measure used previously. This is warranted because of the relatively high (~30-50 %) values of strain Dilation
500 400
Failure
Critical State
Compaction
Laboratory Load Path GeoModel Peak Shear-Stress Data
300 200 100 0 1000
0
-1000
-2000
29
-3000
-4000
-5000
-1200
Axial Stress (MPa)
-1000
Failure
-800
Dilation
-600
Critical State
-400 Data GeoModel
-200 0 0.02
0
-0.02
-0.04
-0.06
-0.08
-0.1
Compaction
-0.12
-0.14
Volumetric Strain
Figure 9: (Top) The evolving yield surface of the GeoModel plotted as deviatoric stress (J20.5) as a function of invariant stress (I1), and how it relates to the (bottom) measured axial versus volumetric strain in a particulate body during compaction.
measured during the tests. Additionally, a nonlinear bulk modulus (not available previously) was used to model the elastic portion of the compaction process, resulting in a better fit for the hydrostatic load path, and also for the triaxial compression load path following hydrostatic load up. The GeoModel also affords a smooth transition in the volumetric strain deformation from a compaction-dominated response during pore collapse to a volume-expansion-dominated response that occurs, for example, during intra-granular “microcracking”. This was not possible with the earlier cap plasticity model. Moreover, the GeoModel includes a new and more realistic ‘pressure-volume’ response function to be used for the powder-to-solid deformation. In earlier work, a power-law function was used to match the highly compactable pressure-volume response of the powder, and was used in place of the usual exponential spline. In this study, however, the power-law function does not allow the inelastic volumetric strain to asymptote to the initial porosity, which does not result in very good volumetric strain predictions during the nonhydrostatic portions of the triaxial compression experiments. Therefore, a new ‘pressure-volume’ function was used in this study that can adequately match the data and allow the inelastic volume strain to asymptote to the initial porosity. These issues, the nonlinear elastic behavior of the
30
compact, and transitioning from inelastic compaction to dilatation are important ones because they will affect the predictions of density gradients in green compacts. Using the aforementioned techniques, the measured properties and constitutive behavior of a 94% alumina, 99.5% alumina, and zirconia ceramic powders were fitted to the Sandia GeoModel (see Appendix D) for implementation in JAS 3D for use with the UNIPACK powder compaction code. Characterizing and Modeling Microstructure Evolution During Sintering Phenomenological, constitutive, and continuum models for sintering were assessed to provide guidance on how to refine and improve existing models and modeling capabilities, as well as to further enhance Sandia’s modeling portfolio. The analyses identified a clear need to better understand the effects of materials and process non-idealities on the sensitivity and uncertainty of simulation results, which are based largely on ideal conditions. Microstructure in Ideal and Real Systems.
Classical sintering models such as Coble’s[30] final-stage sintering model are based on an idealized grain-pore geometry that assumes a homogeneous microstructure consisting of uniformly sized grains packed uniformly, and uniformly sized pores distributed uniformly throughout the microstructure (Figure 10). However, a typical ceramic microstructure is heterogeneous, with randomly packed particles or grains, a distribution of grain and pore sizes,
Figure 10: (left) A three-dimensional, idealized grain-pore geometry used in the Coble[23] phenomenological model for final-stage sintering showing spherical pores at each apex of a tetrakaidecahedron-shaped grain, and (right) its common two-dimensional representation.[31].
31
and an irregular spatial distribution of porosity (Figure 11). For this “real-life” situation, the idealized geometry assumed in classical sintering modeling overestimates the ratio of grain size to pore size when compared with experimental results, and underestimates the pore coordination. In turn, these factors impact model predictions of microstructure evolution and densification. A “real” microstructure typically contains a distribution of pore sizes, in which the smaller pores are typically eliminated preferentially during sintering.[31] Additionally, a spatial variation in density will result in localized differences in microstructure evolution and densification that can differ significantly from the body as a whole. Consequently, microstructure heterogeneity and its subsequent effect(s) on microstructure evolution and densification must be understood and considered to understand, control, and model sintering in real
. Figure 11: A representative, low magnification SEM micrograph of ZrO23mol%Y2O3 showing fewer, larger, and more widely spaced pores interspersed in dense multigrain areas after sintering at 1275°C for 5 hours.[24] Microstructure and Densification.
The relationship between microstructure and densification has traditionally been made based on a homogeneous, model pore-grain structure such as that in Figure 10, assuming the diffusion distance (i.e., the distance between pores) is proportional to the grain size. In this ideal 32
scenario, densification slows with sintering time due to an increase in diffusion distance with coarsening, as measured by an increase in grain size. However, in a heterogeneous real system such as that shown in Figure 11, the pore spacing is not directly proportional to the grain size. In a real system, there can be many grains between pores (Figure 12) [31]. Consequently, the evolution of pore spacing becomes a better measure of coarsening (as opposed to grain size) during sintering.
This, in turn, dictates that we reevaluate the way we characterize
microstructure. Sandia’s modeling is being advanced in combination with a more comprehensive understanding of the physical sintering process (i.e., microstructure/evolution) using quantitative stereology and pore boundary tessellation. A combination of pore boundary tessellation and quantitative stereology can be used to develop a more comprehensive picture of microstructure evolution and its effect on densification during sintering. [31]
Pore Pore
Pore
Pore
Figure 12: A two-dimensional representation of the non-ideal ZrO2-3mol%Y2O3 microstructure with more than one grain between large pores during laterstage sintering. [24] By comparison to classical sintering models, vacancies must migrate to and be annihilated along the multiple grain boundaries between pores, and over a larger multigrain unit area (in bold) to result in densification during sintering.
33
Microstructure Analysis using Pore Boundary Tessellation.
Pore boundary tessellation is accomplished using Tessellator software developed at the University of Pittsburgh to tessellate a digitized microstructure. [31, 32] Figure 13 shows a microstructure with a superimposed pore boundary tessellation. Each tessellation cell will contain one pore, from which the pore boundary tessellation was performed, and some surrounding solid phase. For intermediate-stage sintering, a cell contains the pore and parts of the surrounding grains to which the pore is coordinated. In final-stage sintering when the number of pore sections per unit area decreases quickly, the tessellation cell may also contain several grains that are not directly coordinated to the pore. Measurements taken from a tessellated microstructure included the area of the pore section in the cell (PA) and the tessellation cell area (CA). The solid area fraction (SAF) of each cell can then be defined from these two measurements. In turn, the population of the tessellation cell properties can be represented on cell maps, which are plots of one cell property against another.
Figure 13: Tessellation cells in a ceramic microstructure.
Microstructure evolution and densification in ZrO2-3mol%Y2O3.
Quantitative stereology and pore boundary tessellation were used to characterize the microstructure of ZrO2-3mol%Y2O3 during isothermal sintering, including comparing the
34
microstructure evolution in ZrO2-3mol%Y2O3 relative to an ideal microstructure.[31] Consistent with scanning electron microscope (SEM) images of the microstructure, pore boundary tessellation showed quantitatively that the microstructure of a pressed, fine powder Tosoh ZrO23mol%Y2O3 compact is initially heterogeneous, and that this heterogeneity affects sintering behavior. During early-stage sintering, the microstructure consists of a mixture of higher and lower density regions. Tessellation conclusively showed that the smaller pores in the higher density regions are preferentially eliminated, which is reflected by the high rate of densification observed during early-stage sintering. Tessellation and quantitative stereology both showed quantitative evidence of microstructure coarsening during the later stages of sintering (i.e., an increase in grain size and pore size), as well as an increase in pore separation with density. This is reflected in the slower densification kinetics observed during later-stage sintering. The evolution of the pore separation during sintering identified using tessellation revealed significant coarsening that is not apparent from traditional grain size measurements alone. It was hypothesized that inhomogeneous particle packing, as reflected by the low green density of the pressed powder compacts, contributes to a high degree of microstructure heterogeneity that significantly affects the evolution and coarsening of the ZrO2-3mol%Y2O3 microstructure during sintering. Additionally, the critical distance for diffusion and densification during late-stage sintering in ZrO2-3mol%Y2O3 correlates with the average pore separation distance, which is significantly greater than the average grain size assumed in classical sintering models. The implication of a heterogeneous green microstructure in a “real” system is that differential densification can and will occur within a chemically homogeneous body during sintering. In the “worst-case” scenario, differential sintering due to density gradients can lead to sintering damage; crack-like separations can result if differential densification results in local stresses that exceed the strength of the material during sintering. This is a problem that often becomes more severe and more difficult to control in more heterogeneous green compacts, such as those formed from finer particle size, nano-scale powders. The keys to better understand and control differential sintering will hinge on determining the magnitude of the forces and the microstructure variation (i.e., heterogeneity) that lead to sintering induced microstructure hierarchies, differential sintering, and sintering damage. The measured dependence of green density on the densification behavior of ZrO23mol%Y2O3 revealed that microstructure evolution changes with green density. This change has
35
also been verified by quantitative microstructure analysis completed using traditional quantitative stereology and a novel, pore boundary tessellation technique.[31, 33] This microstructure analysis, which is detailed in separate work [31, 33], provides the physical picture of the non-ideal micro/macro structure that needs to be considered with the continuum modeling to understand, predict, and control sintering behavior (i.e., densification and microstructure evolution) in real systems. Work needs to continue to characterize microstructure and to link the physical nano/micro/macro structure with continuum modeling to better understand the effect(s) of non-idealities on compaction and sintering modeling.
Modeling Technology Development, Refinement, Testing, and Validation
An appropriate combination of scientific discovery and engineering tool development were drawn upon to help demonstrate the ability to apply Sandia’s model-based engineering technology in product design and manufacturing. Efforts addressed developing and/or refining technology to facilitate developing and applying: 1) scientific understanding and the enhanced modeling capabilities necessary to efficiently predict and control manufacturing in “real-life,” non-ideal materials, including understanding the important non-idealities prevalent in materials and processing (e.g., anisotropy, microstructure hierarchy, and microstructure heterogeneity, etc.), such as by linking the physical nano/micro/macro structure with continuum modeling and statistical tools to better understand sensitivity and uncertainty; 2) coupled modeling to understand and control the interrelationships between the different unit processes that comprise the entire manufacturing process; and 3) advanced characterization and computational tools (e.g., Dakota) to facilitate parameter determination/estimation, sensitivity analysis, and process understanding and optimization in large, complex, non-ideal “real-life” materials/manufacturing problems. Scientific understanding and enhanced modeling capabilities. For example, to predict the effects of realistic compact density heterogeneities on ceramic component sintering and performance, we took steps to develop a coupled compaction and sintering model, and a coupled sintering and stress model. Model Updates To have the capability to simulate powder compaction and sintering, and to be able to couple the powder compaction results from UNIPACK as input into a sintering model (e.g., the
36
SOVS model), it was necessary to update the compaction and sintering currently in models in JAS3D to the most recent version of ACCESS and the Redhat Linux Operating system. The update to the most current version of the code (version 2.2) was required to have all of the models on one compatible platform to allow us to use a consistent version of the code for both the powder compaction process and the subsequent sintering and stress analyses. Updating the Sandia Compaction Model.
The UNIPACK compaction code was updated from version 1.6 to the most current version of JAS3D to enable the simulation of powder compaction using a 94% alumina, 99.5% alumina, or zirconia ceramic powder using the Sandia Cap Mode, an earlier version of a cap model that was the predecessor of the Sandia Geomodel.[29] As previously discussed, the compaction response and the powder compact properties for the three powders were also fitted to the Sandia GeoModel (see Appendix C) for use with the UNIPACK powder compaction code. Once the capability to predict density is added to the most current version of the Sandia Geomodel, it will also be implementation in the most current version of JAS3D. The update of UNIPACK to the most current version of the Geomodel should allow us to subsequently couple the results from compaction modeling as input to the sintering models. Updating the Sandia Sintering Models.
The Skorohod Olevsky Viscous Sintering (SOVS) model and the recently-implemented Reidel-Svoboda (RS) sintering models were updated to the most recent version of JAS3D in the most recent version of ACCESS. JAS3D development had continued beyond the version that was used to initially implement the sintering models (version 2.0) and that version of the code was incompatible with the much earlier version of the code around which UNIPACK was built (version 1.6). Developing Coupled Modeling One of the advantages of FE modeling is that it has no geometric restrictions; that is, once the materials properties are known for a given system (e.g., LTCC packaging materials), simulations can be run on virtually any geometry imaginable. This facilitates the practical
37
application of the modeling technology.
Model coupling, which is simplified on Sandia’s
SIERRA platform, also facilitates the practical application of the modeling technology.[6] Coupled Compaction and Sintering Modeling.
We have started the process of linking compaction modeling output to use as input for sinter modeling in JAS3D. In their green body state, real particulate ceramic parts are complex and most likely to be in a non-uniform density state because of the compaction process. The current versions of the SOVS & RS sintering models are limited to starting with a uniform density state. The capability to start with the density state coming out of the powder compaction stage is needed to accurately model the initial conditions for the start of sintering in real parts. This involves taking the state of the compact coming out of the compaction model, with its potentially distorted mesh, and mapping it onto a more uniform starting mesh for the sintering model. Because the constitutive model for compaction has different state variables than those in the two constitutive models for sintering, mapping from the end state of compaction to the beginning state of sintering must be completed. Some hooks for doing this are already available, but some intermediary code writing is also required to complete this task. Coupled Sintering and Stress Modeling.
The implication of a heterogeneous green microstructure in a “real” system is that differential densification can and will occur within a chemically homogeneous body during sintering. In the “worst-case” scenario, differential sintering due to density gradients can lead to sintering damage; crack-like separations can result if differential densification results in local stresses that exceed the strength of the material during sintering. This is a problem that often becomes more severe and more difficult to control in more heterogeneous green compacts, such as those formed from finer particle size, nano-scale powders. The keys to better understand and control differential sintering will hinge on determining the magnitude of the forces and the microstructure variation (i.e., heterogeneity) that lead to sintering induced microstructure hierarchies, differential sintering, and sintering damage. To address these issues, Sandia’s modeling was advanced in combination with a more comprehensive understanding of the physical sintering process (i.e., microstructure/evolution) using quantitative stereology and pore boundary tessellation.
38
We have established the feasibility of coupling the SOVS sintering model with the stress modeling within JAS3D. Some advantages of coupling these two models are that the FE mesh needs to be generated only once, and the more precise geometry defined by the FE mesh after sintering, coupled with the predicted residual stress state after sintering, will subsequently afford more quantitative predictions of residual stress. This coupling also affords the analysis of interfaces with respect to processing and performance (e.g., as discussed above). Assessing the role of interfaces and interface properties (e.g., friction) is of particular interest, as interfaces are likely to be extremely important in highly-integrated microelectronics and microsystems. Detailed model analysis can provide greater insight into the sensitivity of simulation results to different properties and modeling parameters, which should prove useful in differentiating the critical properties/parameters that need to be measured (i.e., determined quantitatively) for predictive modeling, and which ones can be approximated. Model Enhancements Improved models that provide the potential for more detailed understanding relative to the physical micro/macrostructure, and that enable greater scientific understanding have been identified in this study. Additionally, model enhancements and complimentary modeling technology were identified to improve modeling efficiency in solving large, “real-life” problems (e.g., the sintering of multi-material, multilayer microelectronics). Subincrementation.
Enhancements have been identified to improve modeling efficiency, including the use of shell elements for modeling deformation in thin layers, and the use of subincrementation to improve modeling efficiency by allowing for smaller number of global time steps in solving large, “real-life” problems (e.g., the sintering of multi-material, multilayer microelectronics). To enable faster, more efficient simulations, subincrementation, mesh optimization, and the replacement of solid 3D elements with fewer shell elements offer advantages, especially for modeling multilayer LTCC packages with thin layers of thick film metallization and resistor between thicker layers of ceramic tape. Constitutive models for sintering need to be modified to use shell elements to model the sintering of thin layers (e.g., thick films), and subincrementation needs to be implemented for more efficient modeling of large, “real life” sintering problems.
39
To improve simulation efficiency of large simulations, some preliminary scoping work for implementing “subincrementation” in the recently-implemented RS sintering model has been completed. This is needed because the model was initially implemented using a simple forwardEuler integration process that requires a relatively small time step for stability, requiring that a large number of small global time steps are needed to solve a problem. While this is okay for small problems typically used to verify that an implementation is correct (as was done to compare with the ABAQUS Explicit implementation), such small time steps are prohibitive for larger, more complex (real) problems. A method is available to use in quasistatic codes like JAS3D that allow one to use larger global time steps to solve the problem while using smaller subincrements within the constitutive model to integrate the model through the larger global time step. This is done by calculating the stability limit needed by the constitutive model, and using that smaller time step value to integrate the constitutive model from the start to the end of the larger time increment. Subincrementation will allow us to solve large problems much more efficiently using a reasonable number of global time steps Different meshing approaches for modeling thin layers for sintering may also be needed. In particular, it may be beneficial to use shell elements to model layers more efficiently. Although a shell element is available in JAS3D, reworking of the constitutive models is necessary to get them to respond to in plane-stress in a fashion compatible with the shell element. This will require a substantial effort. Determining Modeling Parameters and Parameter Sensitivity
An important component of predictive modeling is materials specific input parameters for the models. Materials characterization is often tedious and expensive, and resources are usually not available to characterize every possible material/parameter. As such, there is a clear need for improved techniques/technology to identify the most critical parameters for modeling, and to facilitated parameter determination for modeling. One possibility is to estimate properties and modeling parameters (e.g., for sintering models) from measured (sintering) behavior using advanced computational tools and techniques (e.g., Dakota). The procedure for estimating the parameters required by advanced constitutive models using traditional approaches is tedious and time-consuming, and the goodness of the fitted response to experimental is often qualitative. Modern systems analysis methods can be used to streamline this process significantly. The
40
DAKOTA toolkit provides a flexible, extensible interface between analysis codes and iterative systems analysis methods. DAKOTA contains algorithms for parameter estimation with nonlinear least squares methods, sensitivity and variance analysis with design of experiments, and parameter study capabilities. We need to use the DAKOTA toolkit for parameter estimation for the sintering models. In particular, the use of DAKOTA may be the only viable option to obtain parameters for the Reidel-Svoboda model for new materials in a reasonable time (e.g., weeks versus years). Dakota is also ideally suited to determine parameter sensitivity and to provide guidance on optimization (e.g., compaction, sintering individually, and coupled compaction and sintering).
41
Summary An interdisciplinary team of scientists and engineers having broad expertise in materials processing and properties, materials characterization, and computational mechanics was assembled to develop science-based modeling/simulation technology to design and reproducibly manufacture high performance and reliability, complex microelectronics and microsystems. The team’s efforts focused on defining and developing a science-based infrastructure to enable predictive compaction, sintering, stress, and thermomechanical modeling in “real systems,” including: 1) identifying and developing techniques to and determining materials properties and constitutive
behavior
required
for
modeling;
2) identifying
and
developing
new,
improved/updated models and modeling capabilities, 3) assessing models and modeling capabilities to ensure that existing models are representative of the physical phenomena being simulated; and 4) assessing existing models and modeling capabilities to identify advances necessary to facilitate the practical application of Sandia’s predictive modeling technology.
42
References 1.
2.
3. 4. 5. 6.
7. 8. 9. 10. 11. 12. 13. 14. 15.
K.G. Ewsuk, J.G. Arguello, D.H. Zeuch, B. Farber, L. Carini, J. Kaniuk, J. Keller, C. Cloutier, B. Gold, R.B. Cass, J.D. French, B. Dinger, and W. Blumenthal, CRADA Develops Model for Powder Pressing and Die Design. American Ceramic Society Bulletin, 2001. 80(1): p. 53-60. K.G. Ewsuk, J.G. Arguello, D.H. Zeuch, B. Farber, L. Carinci, J. Kaniuk, J. Keller, C. Cloutier, B. Gold, R.B. Cass, J.D. French, B. Dinger, and W. Blumenthal, CRADA Develops Model for Powder Pressing and Die Design: Part two. American Ceramic Society Bulletin, 2001. 80(2): p. 41-46. K.G. Ewsuk and J.G. Arguello, Science-Based Ceramic Powder Processing. Key Engineering Materials, 2003. 247: p. 27-34. K.G. Ewsuk and J.G. Arguello, Controlled Ceramic Powder Compaction Through Science-Based Understanding. Key Engineering Materials, 2004. 264-268(I): p. 149-154. J. Arguello, Continuum-Based FEM Modeling of Ceramic Powder Compaction Using a Cap-Plasticity Constitutive Model. KONA Powder and Particle, 2001. 19: p. 166-175. R. Tandon, J.T. McLaughlin, M.A. Neidigk, T.E. Buchheit, and J.E. Massad, Component Development Using a Coupled Analysis and Experimental Approach: Ceramic-Ceramic and Ceramic-Metal Joining. Proceedings of the 3rd International Brazing and Soldering Conference, 2006. 2006: p. 67-72. C.B. DiAntonio, D.N. Bencoe, and K.G. Ewsuk, Characterization and Control of Low Temperature Co-fire Ceramic (LTCC) Sintering. Proceedings of SPIE - The International Society for Optical Engineering, 2003. 5231: p. 160-164. R. Tandon, C.S. Newton, S.L. Monroe, S.J. Glass, and C.J. Roth, Sub-Critical Crack Growth Behavior of a Low Temperature Co-Fired Ceramic (LTCC). J. Am Ceram Soc., 2007. submitted. H. Dannheim, A. Roosen, and U. Schmid, Effect of Metallization on the Lifetime Prediction of Mechanically Stressed Low-Temperature Co-fired Ceramics Multilayers. Journal of the American Ceramic Society, 2005. 88(8): p. 2188-94. M.W. Reiterer, K.G. Ewsuk, and J.G. Arguello, An Arrhenius-Type Viscosity Function to Model Sintering Using the Skorohod-Olevsky Viscous Sintering Model Within a FiniteElement Code. Journal of the American Ceramic Society, 2006. 89(6): p. 1930-5. M. Neilsen, private communication. 2006. R. Tandon and T.E. Buchheit, Use of Cube-Corner Nano-Indentation Crack Length Measurements to Estimate Residual Stresses Over Small Spatial Dimensions. J Am. Ceram. Soc, 2007. 90(2): p. 502-8. R. Tandon, A Technique for Measuring Stresses in Small Spatial Regions Using CubeCorner Indentation: Application to Tempered Glass Plates. Journal of the European Ceramic Society, 2007. 27(6): p. 2407-2414. T.J. Garino and H.K. Bowen, Kinetics of constrained-film sintering. Journal of the American Ceramic Society, 1990. 73(2): p. 251-7. J.N. Calata, G.Q. Lu, and T.J. Chuang, Constrained sintering of glass, glass-ceramic and ceramic coatings on metal substrates. Surface and Interface Analysis, 2001. 31(7): p. 673-81.
43
16. 17. 18. 19. 20. 21. 22. 23. 24. 25. 26. 27. 28. 29. 30. 31. 32. 33.
G.G. Stoney, The tension of metallic films deposited by electrolysis. Proceedings of the Royal Society of London Series A-Containing Papers of A Mathematical and Physical Character, 1909. 82(553): p. 172-175. C.A. Klein, How accurate are Stoney's equation and recent modifications. Journal of Applied Physics, 2000. 88(9): p. 5487-9. C.A. Klein, Comment on "The multilayer-modified Stoney's formula for laminated polymer composites on a silicon substrate" [J. Appl. Phys. 86, 5474 (1999)]. Journal of Applied Physics, 2000. 88(9): p. 5499-500. C.A. Klein and R.P. Miller, Strains and stresses in multilayered elastic structures: The case of chemically vapor-deposited ZnS/ZnSe laminates. Journal of Applied Physics, 2000. 87(5): p. 2265-72. R.J. Ong, D.A. Payne, and N.R. Sottos, Processing effects for integrated PZT: residual stress, thickness, and dielectric properties. Journal of the American Ceramic Society, 2005. 88(10): p. 2839-47. Measurement of Viscosity of Glass Between 104 Pa•s and 108 Pa•s by Viscous Compression of a Solid Right Cylinder, in ASTM C1351M-96. 2002, ASTM International. Measurement of Viscosity of Glass Between Softening Point and Annealing Range (Approximately 108 Pa•s to Approximately 10 13 Pa•s) by Beam Bending in ASTM C1350M-96. 2003, ASTM International. Annealing Point and Strain Point of Glass by Beam Bending, in ASTM C598-93 2003, ASTM International. H.E. Hagy, Exeprimental Evaluation of Beam-Bendng Method of Determining Glass Viscosities Iin the Range 10(8) to 10(15) Poises. Journal of the American Ceramic Society, 1963. 46(2): p. 93-97. A.N. Gent, Theory of the Parallel Plate Viscometer. British Journal of Applied Physics, 1960. 11(2): p. 85-87. K.G. Ewsuk, D.T. Ellerby, and C.B. DiAntonio, Analysis of Nanocrystalline and Microcrystalline ZnO Sintering Using Master Sintering Curves. Journal of the American Ceramic Society, 2006. 89(6): p. 2003-9. C.B. DiAntonio and K.G. Ewsuk, Controlled and Predicted Ceramic Sintering Through Master Sintering Curve Theory. Ceramic Transactions, 2005. 157: p. 15-23. D.H. Zeuch, J.M. Grazier, J.G. Arguello, and K.G. Ewsuk, Mechanical properties and shear failure surfaces for two alumina powders in triaxial compression. Journal of Materials Science, 2001. 36(12): p. 2911-24. K.G. Ewsuk, J.G. Arguello, D.H. Zeuch, and A.F. Fossum, Real-Time Design of Improved Powder Pressing Dies Using Finite Element Method Modeling. SAND Report, 2000. SAND 20-3045: p. 33. R.L. Coble, SINTERING CRYSTALLINE SOLIDS .1. INTERMEDIATE AND FINAL STATE DIFFUSION MODELS. Journal of Applied Physics, 1961. 32(5): p. 787-&. I. Nettleship, T. Chen, and K.G. Ewsuk, Microstructure Evolution in ZrO2-3mol% Y2O3 During Isothermal Sintering. J. Am. Ceram. Soc., 2007. submitted January 2007. R.J. McAfee and I. Nettleship, A Mesoscale Description of Microstructure Evolution for the Sintering of Ceramics. Acta Materialia, 2005. 53(16): p. 4305-4311. I. Nettleship and R.J. McAfee, A Mesoscale Description of Microstructure Evolution for the Sintering of Ceramics. Acta Materialia, 2005. 53(16): p. 4305-11.
44
Appendix A
45
Operated for the U.S. Department of Energy by
Sandia Corporation Albuquerque, New Mexico 87185-0847 date: to:
August 3, 2006 Kevin Ewsuk, 1815 Original Signed by Mike Neilsen and Raj Tandon
from:
subject:
Mike Neilsen, 1526, and Raj Tandon, 1825 Micromechanics Modeling of Low-Temperature Co-Fired Ceramic Introduction
Low-temperature co-fired ceramic (LTCC) has a complex microstructure. It consists of alumina ceramic particles in a glass matrix (Figure 1). Ian Nettleship, University of Pittsburgh, obtained phase fractions based on SEM contrast and point counting using a 49 point square grid. The results from a total of 15 images are as follows: dark phase (alumina) 47.6+/- 1.7 percent, light phase (glass) 49.5 +/- 2.0 percent, and porosity 2.9 +/- 0.9 percent. The alumina particles have an average diameter of about 3.77 μm (Ewsuk, 2006). For our initial investigation, unit-cell and multi-cell models with either spherical or cubic alumina particles were created. An approach for predicting LTCC properties from finite element analyses on the microstructure was developed. The relationship between elastic moduli for the glass phase and the LTCC was investigated. Finally, internal stress generated by free thermal expansion of the LTCC was investigated. Results from these initial analyses are documented in this memo.
Figure 1. Low-temperature co-fired ceramic. Light matrix phase is glass and the darker particles are alumina ceramic.
46
Unit-Cell Simulations: Spatially-periodic, finite element models of representative volumes of LTCC were developed (Figure 2). The model in Figure 2a is based on spherical particles of alumina with a body centered cubic arrangement. The model in Figure 2b is based on cubic particles of alumina with a simple cubic arrangement. Both models have a volume fraction of 47.6 percent alumina ceramic and 52.4 percent glass. Voids were not included in these initial analyses. Spatiallyperiodic geometry means that nodes on the boundaries are arranged such that these models will exactly fit together with replicas of themselves to fill space. Mechanical properties for a LTCC material that is constructed from repeating cells with the geometry shown in Figure 2 were then computed by applying appropriate spatially periodic boundary conditions to the models. With spatially periodic boundary conditions, boundary tractions or displacements are not prescribed and instead the relative positions of spatially periodic nodes are given by a prescribed lattice vector. For example, the position of Node B in Figure 2a is constrained to be equal to the position of Node A plus Lattice Vector X. Likewise, nodes on the front of the block are tied to nodes on the back and nodes on the top are tied to nodes on the bottom.
+
=
A
B X
(a) spherical alumina particles with body-centered cubic arrangement.
=
+
(b) cubic alumina particles with simple cubic arrangement. Figure 2. Finite element model of unit cell, blue = alumina particles, green = glass matrix.
47
The individual glass and alumina ceramic materials were modeled as simple isotropic, linear elastic materials with the properties given in Table 1.
Table 1. Mechanical properties used for the individual phase materials.
Material
Young’s Modulus (psi)
Poisson’s Ratio
Alumina Ceramic Glass
52.0 x 10⁶ 9.5 x 10⁶
0.21 0.242
Thermal Expansion Coefficient (1/oC) 7.5 x 10⁻⁶ 5.0 x 10⁻⁶
Mechanical strains were applied to the models by simply prescribing changes to the length or orientation of the lattice vectors. The resulting boundary tractions were then used to compute the Cauchy stress, σij, generated in the LTCC (“equivalent” continuum that occupies the same space as the microstructural model) using the following equation
σ ij =
1 1 σ ijelement dv = ∑ ri ⊗ f j ∫ volume volume volume boundary
(1)
nodes
where ri is the current position of a boundary node, fj is the traction applied to the node, and volume is the current volume of the unit cell model which is computed from the length and orientation of the three lattice vectors. Elastic moduli for the LTCC were obtained by performing six different simulations. In the first simulation, the BCC model with spherical alumina particles was subjected to a uniaxial strain of 0.0001 in the X-direction. The LTCC “equivalent continuum” stress (psi) generated by a uniaxial strain of 0.0001 in the X-direction is shown in Equation 2. This computed LTCC stress was then used to generate the first column in the elasticity matrix for the LTCC as follows:
σ = E : ε,
⎧2150.4 ⎫ ⎡21.504 x10 6 ⎪ 649.9 ⎪ ⎢ 6 ⎪ ⎪ ⎢ 6.499 x10 ⎪ 650.1 ⎪ ⎢ 6.501x10 6 ⎨ ⎬=⎢ 0 0 . 0. 0 ⎪ ⎪ ⎢ ⎪ 0.0 ⎪ ⎢ 0. 0 ⎪ ⎪ ⎢ 0. 0 ⎩ 0.0 ⎭ ⎢⎣
⎤ ⎧0.0001⎫ ⎥⎪ ⎪ ⎥⎪ 0 ⎪ ⎥⎪ 0 ⎪ ⎥⎨ ⎬ ⎥⎪ 0 ⎪ ⎥⎪ 0 ⎪ ⎥⎪ ⎪ ⎥⎦ ⎩ 0 ⎭
The remaining components of the elasticity tensor were then obtained from 5 additional simulations in which one of the other 5 strain components was non-zero. The elasticity tensor predicted for the LTCC is shown in Equation (3). As expected, this matrix is very nearly symmetric (lack of symmetry is only due to small numerical error). Also, the geometry of the model had cubic symmetry and the elasticity tensor, as expected, has 3 independent elastic constants but is nearly isotropic.
48
(2)
⎡ 21 .504 x10 6 ⎢ 6 .499 x10 6 ⎢ 6 .501 x10 6 E⇒ ⎢ 0 .0 ⎢ 0 .0 ⎢ ⎢⎣ 0 .0
6 .499 x10 6 21 .504 x10 6 6 .501 x10 6 0 .0 0 .0 0 .0
6 .496 x10 6 6 .497 x10 6 21 .501 x10 6 0 .0 0 .0 0 .0
0 .0 0 .0 0 .0 8 .019 x10 6 0 .0 0 .0
0 .0 0 .0 0 .0 0 .0 8 .019 x10 6 0 .0
⎤ 0 .0 ⎥ 0 .0 ⎥ 0 .0 ⎥ 0 .0 ⎥ 0 .0 ⎥ 8 . 019 x10 6 ⎥⎦
⎡23.632 x10 6 ⎢ 5.637 x10 6 ⎢ 5.637 x10 6 E⇒⎢ 0.0 ⎢ 0.0 ⎢ ⎢⎣ 0.0
5.637 x10 6 23.632 x10 6 5.637 x10 6 0.0 0.0 0.0
5.636 x10 6 5.636 x10 6 23.629 x10 6 0.0 0.0 0.0
0.0 0.0 0.0 7.254 x10 6 0.0 0.0
0.0 0.0 0.0 0.0 7.254 x10 6 0.0
0.0 ⎤ 0.0 ⎥ 0.0 ⎥⎥ 0.0 ⎥ 0.0 ⎥ 7.254 x10 6 ⎥⎦
(3)
(4)
Likewise, the elasticity tensor (psi) for the simple cubic model with cubic particles was computed (Equation 4). Results from these computations revealed that the simple cubic model was less isotropic than the BCC model with spherical particles. Internal stress distributions generated by these small strains were also investigated. In the BCC model, a maximum tensile stress of 2831 psi was generated in the glass directly between the ceramic particles (Figure 3) when the model was subjected to a uniaxial strain of 0.0001 in the X-direction. Recall that for this deformation, an equivalent continuum normal stress of 2150.4 was applied in the X-direction so the stress generated internally is higher than the average stress applied to the LTCC. In the simple cubic model a maximum tensile stress of 2,976 psi was generated in the glass between ceramic particles (Figure 3). These results suggest that when LTCC is subjected to tension, maximum tensile stress in the glass will be much higher in glass located between alumina particles that are oriented along the load path.
X
Figure 3. Maximum tensile stress (psi) generated in the glass by an applied uniaxial strain of 0.0001 in the X-direction.
49
Next, the relationship between Young’s moduli for the LTCC and Young’s modulus for the glass phase was investigated. Results from this investigation, Figure 4, revealed a non-linear relationship between the glass matrix modulus and the LTCC moduli. Curves generated by the BCC model with spherical particles and the simple cubic model with cubic particles were surprisingly similar.
Figure 4. Young’s modulus in the direction for the LTCC as a function of Young’s modulus for the isotropic glass phase. Alumina particles were given a Young’s modulus of 52.0e6 psi (358.6 GPa).
Thermal Expansion of Unit Cell Models In the next investigation, the unit cell models with spatially periodic boundary conditions were heated from a stress free temperature of 20oC to 500oC and allowed to freely expand. Results from the simulation with the BCC model indicated that the LTCC would have a thermal expansion coefficient of 6.478 x 10⁻⁶ per degree C. The simulation with the simple cubic model predicted a thermal expansion coefficient of 6.496 x 10⁻⁶ per degree C. If we compute the thermal expansion coefficient simply based on the volume fraction of each material we would get
α LTCC = 0.476 α alu min a + 0.524 α glass = 6.19 x10 −6 1/ oC
(5)
The computed thermal expansion coefficient is higher than the thermal expansion coefficient based on volume fraction because the alumina ceramic is stiffer than the glass and, thus, has a larger influence on the composite thermal expansion coefficient than the glass (i.e. the higher alumina thermal expansion coefficient makes the composite thermal expansion coefficient higher).
50
The internal maximum principal stress distribution generated in the individual phases by heating the LTCC from 20 to 500 oC is shown in Figure 5. A compressive stress is generated in the alumina particles and significant tensile stress is generated in the glass. This occurs because the alumina particles try to expand more than the glass as the LTCC is heated. A maximum tensile stress of 12,320 psi (85 MPa) was generated in the glass matrix in the BCC model and a maximum tensile stress of 12,880 psi (89 MPa) was generated in the glass matrix in the simple cubic model. Thus, the maximum tensile stress level does not appear to be very sensitive to model geometry.
Figure 5. Maximum tensile stress (psi) generated in the alumina particles and glass matrix by heating the LTCC from 20 to 500 oC.
51
Thermal Expansion of Multi-Cell Models In the next investigation, multi-cell models (Figure 6) were heated from a stress free temperature of 20 oC to 500 oC and allowed to freely expand. The primary purpose of these analyses was to investigate the effects of free edges on the stress distribution in LTCC generated by heating. Results from these analyses, showed that the stress state generated near a free surface will be significantly different than the stress generated in the interior of the LTCC (Figure 7). As we approach the surface, the maximum tensile stress in the glass phase decreases but the maximum tensile stress in the alumina particles increases.
(a) spherical alumina particles with body-centered cubic arrangement.
(b) cubic alumina particles with simple cubic arrangement.
Figure 6. Multi-cell models constructed from 4x4x4 array of unit-cell models, blue = alumina particles, green = glass matrix.
52
Figure 7. Maximum tensile stress (psi) generated in the alumina particles and glass matrix by heating the LTCC from 20 to 500 oC. Note that only one-half of the model is shown to facilitate comparison of internal and free surface stress states.
53
Summary and Future Work:
These results show that a very complex stress state can be generated in the LTCC just by free thermal expansion of this material. A comparison of predictions generated with the BCC model with spherical particles and the simple cubic model with cubic particles shows that the predictions are affected by the microstructural geometry but not significantly; thus, a model which only approximates the true LTCC geometry will generate much useful information. Future microstructural modeling work will include: 1. 2. 3. 4. 5. 6.
Development of spatially periodic models with more realistic LTCC-like microstructure. Incorporation of measured glass phase properties into the simulations. Incorporation of porosity into the simulations. Investigation effects of metallization additions on stress levels generated near a surface. Investigation of stress levels generated near a via. Comparison of indentation experiments with simulations of those experiments.
If you have any questions about these simulations, please give us a call.
Acknowledgement:
Timely information provided by Kevin Ewsuk, 1815, facilitated the performance of this work.
Copy to (via e-mail): J.G. Arguello D.J. Holcomb A.F. Fossum J.F. Dempsey T. Hinklin R. Tandon M. Neilsen J. Redmond J. Pott T. Baca P. Wilson, R. Gonzales,
1525, 6117, 6117, 1524, 1815, 1825, 1526, 1526, 1524, 1523, 1520, 1526,
MS0376 MS0751 MS0751 MS0372 MS1349 MS0889 MS0847 MS0847 MS0372 MS0847 MS0847 MS0847 (department file)
54
Appendix B
55
Sintering of Lead Zirconate Titanate Ceramics
Progress Report
Submitted to: Kevin Ewsuk Sandia National Laboratory 1001 University Blvd. Albuquerque, NM 87106 e-mail
[email protected] phone 505-272-7620
Submitted by: Michael Lanagan, Niall Donnelly, Amanda Baker, Clive Randall, Shujun Zhang, Tom Shrout and Dean Anderson Materials Research Institute The Pennsylvania State University University Park, PA 16802
August 14, 2006
56
Executive Summary:
Multilayer ceramic sensors and actuators are comprised of alternating Pb(Zr,Ti)O3 (PZT) and metal layers which are heat treated at high temperatures. One of the major challenges in co-firing multilayer electronic components is controlling the sintering process to prevent warping, cracking, and high porosity. The goal of this study is to develop a fundamental understanding of the sintering behavior of PZT ceramics and ultimately the co-firing of multilayer ceramic/conductor laminates. This collaborative project integrates the piezoelectric materials expertise of Penn State University with Sandia National Laboratory’s expertise in ceramic sintering. In the first phase of this project, three PZT compositions were explored. Two of the compositions were from TRS Technologies Inc. and the third PZT composition was developed at Penn State. The effects of Li2CO3 and LiBiO2 fluxes on sintering behavior were explored for both compositions. Background:
Piezoelectric actuators are being considered to replace electromagnetic solenoid valves in diesel injection in a so-called “Common Rail” system, Figure 1. [1]
Figure 1: Fuel injector system with a multilayer piezoelectric actuator. Through careful design of the injector, the piezoelectric actuator can offer a number of attractive advantages over traditional solenoids, including easy starting, increased fuel
57
efficiency, low CO2 emissions, and low engine noise. [2] These advantages are reaped owing to the high-speed operation and the flexibility of the control of injector processes. The response of the nozzle needle is less than 0.0001 seconds. This fast response reduces the fuel delivery rate and in turn the energy required from the high-pressure fuel pump. Furthermore, more sophisticated injection processes can be designed to also increase efficiency of the combustion process.
A typical injector system is schematically
represented in Figure 1(b) with the position of the multilayer actuator indicated. [3] The general requirements are control of the stroke amplitude, the speed of the stroke and the blocking pressure the actuator can supply. These basic requirements need a high piezoelectric coefficient material that is designed into a device that can quickly be charged and is elastically stiff. The precise designs of both the injector and the actuators vary from system to system. Specifically, the geometry, electromechanical performance, capacitance, and drive circuitry of the actuator all vary. So unlike the production of multilayer capacitor and varistor devices there is no standardization and hence actuator components are constructed on a customer specific basis. The major effort in the scaling up multilayer piezoelectric actuators for diesel fuel injection is in Europe, where approximately 40% of automobiles are diesel. However, in the long term, these injection systems will expand to gasoline-based vehicles, thereby revolutionizing the whole automobile industry and drastically expanding the piezoelectric ceramic industry. [3] Furthermore, with the availability of low cost actuators, many of the “smart” systems that have been previously discussed become more likely and costeffective.
The replacement of high-cost palladium alloy electrodes with lower cost
copper and silver electrodes is a major area of research. [4] One of the major challenges in co-firing multilayer structures is controlling the sintering process to prevent warping, cracking, and high porosity. The goal of this study is to develop a fundamental understanding of the sintering behavior of multilayer ceramic/conductor laminates. Piezoelectric ceramics, such as Pb(Zr,Ti)O3 (PZT), are presently being developed for co-firing with silver-palladium alloys which sinter at 1100°C.
Co-firing at lower temperatures will allow the electrodes to have lower
palladium content. The melting point of silver (930°C in air) necessitates that the ceramic material is sintered below 900°C for pure silver electrodes. In addition, the piezoelectric
58
properties must be maintained for actuator and sensor applications.
Samples were
fabricated at Penn State and sintering data were collected under a range of heat treatment conditions.
59
Technical Progress:
Three PZT compositions: commercial “5A” and “5H” compounds from TRS Technologies Inc. and an experimental PZT-SKN composition from Penn State were investigated. The effect of Li2CO3 and LiBiO2 fluxes on sintering behavior was explored for all compositions (Figures 2 and 3, and Table 1,)
Figure 2: Sintering behavior of commercial 5A PZT ceramic with flux additions. The theoretical density of PZT is close to 8 g/cm3 and full densification was not achieved below 1000°C for the fluxed commercial 5A powder. Cold isostatic pressed samples had a higher starting green density; however, the density remained low for sintering temperatures of 1000°C. Table 1: Sintering TRS 5H commercial PZT with flux additions Material 5H2 -1% LiBiO2 … 5H2-2% LiBiO2 … … 5H2-3% LiBiO2 … …
Sinter temp/time 900oC/2h 950oC/2h 850oC/2h 900oC/2h 950oC/2h 850oC/2h 900oC/2h 950oC/2h
density
K
6.6 7 8 8 8 8 8 8
1800 2160 3760 4140 4430 3100 3720 3940
60
d33 (pC/N) 330 350 540 630 650 340 430 540
Theoretical density (8 g/cm3) was achieved at 850oC for 2% flux addition for the commercial PZT composition. The dielectric constant, K, and piezoelectric coefficient, d33, were maintained at high levels for the fluxed PZT compositions. The densification behavior of an experimental PZT powder developed at Penn State is shown in Figure 3. In this case the Li-based fluxes have a significant effect on the sintering behavior.
Figure 3: Sintering behavior of PZT-SKN powder developed at Penn State University. In this case the Li-based fluxes significantly reduce the PZT sintering temperature and this material potentially may be co-fired with silver and copper electrodes.
61
Future Work:
For the last month of the project, PZT powders will be pressed into pellets and delivered to Sandia for thermomechanical analysis (TMA). The sintering data will be compared with PSU results. Longer term research activities will explore the interplay between PZT composition and flux composition. Transient liquid phases created by flux additions will be explored in detail. In addition, selected PZT compositions will be tape cast and cofired with metal electrodes. The ultimate goal of the project is to provide sintering data for incorporation into a model to predict the sintering behavior of a multilayer composites structure.
Long-Term Technical Tasks
(1)
Develop a characterization protocol for monitoring critical sintering parameters such as viscosity and shrinkage rate. Penn State will collaborate with Sandia to generate the appropriate sample geometry for the PZT and metal.
(2)
Transient liquid phases will be monitored as a function of sintering time and temperature.
(3)
The porosity of the ceramic will be characterized by mercury porisimetry.
(4)
Composite multilayer structures will be fabricated at Penn State University, comprised of PZT/silver and sintered. The warpage and shrinkage of the composite will be compared with predicted sintering behavior from Sandia.
References:
1. F. Zhao, M.C. Lai, and D.L. Harrington, Prog. In Energy and Combustion Science 25(5), 437–562 (1999). 2. P.J. Tennison and R. Rertz, J. of Engineering for Gas Turbines and Power, Transactions of the ASME Engine 123(1), 167–174 (2001). 3. Professional Engineering 16(1), 54–56 (2003). 4. C. A. Randall, A. Kelnberger, G.Y. Yang, R. E. Eitel, and T. R. Shrout, J. Electroceramics 14(3), 177-191 (2005).
62
Appendix C
63
Operated for the U.S. Department of Energy by
Sandia Corporation Albuquerque, New Mexico 87185-0847
7/02/2007
date:
Kevin Ewsuk (01815) Lupe Aguello (01525) Larry Costin (06315)
MS 1349, MS 0372 MS 0751
D. J. Holcomb (6315)
MS0751
to:
from:
subject:
Results of triaxial tests conducted on samples prepared from ZnO2 powders compacted by Cold Isostatic Pressing (CIPing)
Introduction A suite of samples prepared from ZnO2 by Cold Isostatic Pressing (CIPing) was tested to determine mechanical properties, including strength and moduli under compressive triaxial stresses. The samples had been prepared using CIPing pressures ranging from 3 to 20 ksi (20.1 to 137 MPa). Our goal was to measure the mechanical properties, including moduli and yield stresses, for one sample prepared at each of the CIP pressures. Results of the testing were to be used as input for constructing constitutive models. This work was done in support of LDRD project titled Advanced Modeling and Simulation to Design and Manufacture High Performance and Reliability Advanced Microelectronics and Microsystems.
Experimental Methods Specimens were received as right circular cylinders which were end ground and centerless ground to 1” diameter x 2’’ tall (25.4 by 50.8 mm). Strains were measured using LVDTs (linear variable displacement transformers) mounted on a diameter of the sample for the lateral strain ε33 and from end cap to end cap for the axial strain ε11. Photographs in Error! Reference source not found. shows the sample prior to jacketing (panel a) and after jacketing with instrumentation installed (panel b). Testing was carried out in a standard triaxial configuration, using a servo-controlled test frame and pressure control system. Standard triaxial tests use fluid pressure to apply σ2= σ3, the minimum principal stresses and a hydraulic ram to apply σ1, the maximum
64
compressive principal stress. We use the geomechanics convention that compressive stresses and strains are positive. Instrumented samples were tested in a pressure vessel with a pressure capability of 200 MPa (see Error! Reference source not found.) which applied the confining pressure PC=σ2=σ3 using a fluid medium (Isopar) that was excluded from the sample by a jacket of polyethylene shrink fit tubing. Error! Reference source not found.b shows a jacketed, instrumented sample ready to be placed into the pressure vessel, which is shown in position in the load frame in Error! Reference source not found.. All tests were done using the same stress path: apply hydrostatic pressure to a value equal to the CIP pressure, followed by loading along the axis of the cylinder by means of the hydraulic ram advancing a piston into the vessel to apply an axial strain of dε11/dt = 2 x 10⁻⁵/s.
a b Figure 14. (a) Sample in position between end caps, ready to jacket. (b) Jacketed and instrumented sample, ready for testing. It is common to assume that when non-elastic materials are initially unloaded, moving the stress state away from a yield surface or cap, the strains are elastic. Thus for small stress loops that begin with unloading, the slope of the stress-strain curve can be used to determine the appropriate modulus. Moduli measurements were made by using unloadreload loops with a magnitude of 10-20 MPa. When done during the hydrostatic portion of the test, the bulk modulus can be determined this way. Similar unload-reload loops
65
allowed Poisson’s ratio, ν, and Young’s modulus, E, to be determined during the portion of the test when shear stress was increasing. These measurements were made in the expectation that the stress-induced compaction and dilation of the material would result in significant changes in elastic properties, knowledge of which would be useful for modeling.
Figure 15. Load frame with pressure vessel in position ready for testing. Axial (σ11) stress was applied by the piston that passes vertically through the vessel closure. Lateral stress (σ33) or confining pressure s applied to the jacketed sample by fluid (Isopar) in the pressure vessel.
Description of Samples 24 samples were prepared by CIP, but only a representative subset was tested. Error! Reference source not found. contains information on all of the samples, with the asreceived properties of the samples tested marked in gray in the first column. It may be seen from the consistency of densities for the repeat samples that the CIP process produced very similar results under identical conditions, implying that the subset we tested was likely to be representative of the entire sample set.
66
Table 1. As-received properties of the samples, with sample numbers for tested specimens highlighted in gray in the first column. Pressed Pressed Pressed Pressed Pressed Height Diameter Weight aspect Density (mm) (mm) (g) ratio (g/cc)
% Thy
CIPed CIPed CIPed CIPed CIPed CIP Height Diameter Weight aspect Density ρ/ρ they Pressure (mm) (mm) (g) ratio (g/cc) (ksi) %)
3 ksi S-17
63.56
34.98 150.517
1.82
2.46
43.46 62.64
32.90 150.460
1.90
2.83 49.83
S-18 S-19
63.23 63.69
35.03 150.152 34.98 150.450
1.81 1.82
2.46 2.46
43.46 62.28 43.35 62.63
32.95 150.097 32.85 150.391
1.89 1.91
2.83 49.85 2.83 49.97
AVG
63.49
35.00 150.37
1.81
2.46
43.42 62.52
32.90 150.32
1.90
2.83 49.88
STDV
0.24
0.19
0.01
0.00
0.19
0.01
0.00
0.03
0.06
0.21
0.05
3
0.07
4 ksi S-14
63.23
34.96 149.875
1.81
2.47
43.55 61.68
32.66 149.795
1.89
2.90 51.13
S-15 S-16
63.69 63.94
34.98 150.681 35.03 150.908
1.82 1.83
2.46 2.45
43.42 62.12 43.19 62.30
32.70 150.607 32.61 150.856
1.90 1.91
2.89 50.91 2.90 51.13
AVG STDV
63.62 0.36
34.99 150.49 0.04 0.54
1.82 0.01
2.46 0.01
43.39 62.03 0.18 0.32
32.66 150.42 0.05 0.55
1.90 0.01
2.89 51.06 0.01 0.12
S-11
62.86
34.98 150.298
1.80
2.49
43.88 60.99
32.44 150.232
1.88
2.98 52.56
S-12 S-13
63.33 64.65
34.97 150.119 34.98 150.503
1.81 1.85
2.47 2.42
43.53 61.04 42.72 62.43
32.46 150.084 32.13 150.439
1.88 1.94
2.97 52.40 2.97 52.42
AVG STDV
63.61 0.93
34.98 150.31 0.01 0.19
1.82 0.03
2.46 0.03
43.38 61.49 0.59 0.82
32.34 150.25 0.19 0.18
1.90 0.04
2.97 52.46 0.00 0.09
S-5
61.02
35.03 149.973
1.74
2.55
44.98 59.33
32.68 149.895
1.82
3.01 53.12
S-6
62.86
35.01 149.980
1.80
2.48
43.71 60.84
32.41 149.901
1.88
2.99 52.67
4
5 ksi 5
6 ksi
S-7
62.47
34.98 149.744
1.79
2.49
43.99 60.33
32.28 149.663
1.87
3.03 53.46
AVG STDV
62.12 0.97
35.01 149.90 0.03 0.13
1.77 0.03
2.51 0.04
44.23 60.17 0.66 0.77
32.46 149.82 0.20 0.14
1.85 0.03
3.01 53.09 0.02 0.40
S-8
62.24
34.95 150.078
1.78
2.51
44.33 59.93
32.15 149.997
1.86
3.08 54.38
S-9
62.34
34.98 149.970
1.78
2.50
44.15 59.97
32.19 149.890
1.86
3.07 54.17
S-10
62.75
34.97 150.254
1.79
2.49
43.97 60.46
32.15 150.169
1.88
3.06 53.96
AVG
62.44
34.97 150.10
44.15 60.12
32.16 150.02
STDV
0.27
6
7 ksi
0.02
1.79
2.50
0.14
0.01
0.01
0.18
0.30
0.02
1.87
3.07 54.17
0.14
0.01
0.01
7
0.21
8 ksi S-3
61.62
35.01 149.904
1.76
2.53
44.57 59.70
32.34 149.642
1.85
3.05 53.82
S-4 S-24
61.03 63.63
35.01 149.613 35.05 149.732
1.74 1.82
2.55 2.44
44.91 58.64 43.01 61.15
32.13 149.523 31.85 149.731
1.83 1.92
3.14 55.47 3.07 54.20
AVG STDV
62.09 1.36
35.02 149.75 0.02 0.15
1.77 0.04
2.50 0.06
44.17 59.83 1.01 1.26
32.11 149.63 0.25 0.10
1.86 0.05
3.09 54.50 0.05 0.86
Pressed Pressed Pressed Pressed Pressed Height Diameter Weight aspect Density (g/cc) (mm) (mm) (g) ratio
8
CIPed CIPed CIPed CIPed CIPed CIP Height Diameter Weight aspect Density ρ/ρ they Pressure % Thy (mm) (mm) (g) ratio (g/cc) (ksi) %)
67
Table 1. As-received properties of the samples, with sample numbers for tested specimens highlighted in gray in the first column. 10 ksi S-1
62.44
34.98 149.993
1.79
2.50
44.09 59.61
31.92 149.934
1.87
3.14 55.43
S-2 S-23
62.75 63.46
35.05 149.930 35.03 149.748
1.79 1.81
2.48 2.45
43.67 59.66 43.18 60.51
31.61 149.878 31.68 149.744
1.89 1.91
3.20 56.46 3.14 55.37
AVG STDV
62.88 0.52
35.02 149.89 0.04 0.13
1.80 0.01
2.47 0.03
43.65 59.93 0.45 0.51
31.74 149.85 0.16 0.10
1.89 0.02
3.16 55.75 0.03 0.61
S-20
63.28
35.02 149.921
1.81
2.46
43.38 59.11
31.16 149.896
1.90
3.33 58.65
S-21
63.66
35.01 150.041
1.82
2.45
43.18 59.57
31.01 150.033
1.92
3.33 58.81
S-22
63.71
35.05 149.908
1.82
2.44
43.01 59.35
31.14 149.899
1.91
3.32 58.49
AVG STDV
63.55 0.24
35.03 149.96 0.02 0.07
1.81 0.01
2.45 0.01
43.19 59.34 0.19 0.23
31.10 149.94 0.08 0.08
1.91 0.01
3.33 58.65 0.01 0.16
10
20 ksi
68
20
Table 2. Elastic moduli and associated experimental conditions. Bulk modulus, K, can only be directly determined using unloading loops during the hydrostatic portion of the test. Young’s modulus, E, and Poisson’s ratio, ν, can only be determined using unloading loops during the non-hydrostatic portion of the test. Sample ID S21 S21 S21 S21 S21 S21
σ11 (MPa)
σ33 (MPa)
ε11
εkk
69 126 189 269 322 351
67 123 138 138 138 138
1.53E-02 2.62E-02 4.16E-02 9.18E-02 1.48E-01 2.07E-01
7.56E-02 1.23E-01 1.47E-01 1.48E-01 1.10E-01 1.71E-02
3.56 3.76 3.86 3.87 3.70 3.35
2,352 3,803
S01 S01 S01 S01 S01 S01 S01
36 71 104 125 157 170 175
35 70 70 70 70 70 70
1.03E-02 2.00E-02 3.98E-02 6.65E-02 1.12E-01 1.48E-01 1.68E-01
5.28E-02 9.95E-02 1.19E-01 1.23E-01 1.03E-01 6.23E-02 2.85E-02
3.34 3.51 3.58 3.60 3.52 3.37 3.25
1,635 2,516
S03 S03 S03 S03 S03 S03 S03 S03
29 57 68 76 86 97 106 131
27 55 55 55 55 55 55 55
8.14E-03 1.67E-02 2.25E-02 2.76E-02 3.83E-02 5.30E-02 6.95E-02 1.32E-01
4.09E-02 8.14E-02 9.44E-02 9.73E-02 1.02E-01 1.06E-01 1.06E-01 6.76E-02
3.24 3.38 3.43 3.44 3.46 3.47 3.47 3.33
1,575 1,979
S09 S09 S09 S09 S09 S09 S09
26 51 74 84 92 115 124
24 49 49 49 49 49 49
8.19E-03 1.64E-02 3.59E-02 5.39E-02 6.70E-02 1.31E-01 1.71E-01
4.18E-02 8.00E-02 9.80E-02 9.72E-02 9.84E-02 7.23E-02 2.10E-02
3.19 3.32 3.39 3.38 3.39 3.29 3.12
1,476 1,781
S07 S07 S07 S07 S07 S07 S07
24 43 53 63 71 82 95
21 40 41 41 41 41 41
7.23E-03 1.42E-02 2.10E-02 3.09E-02 4.38E-02 6.94E-02 1.11E-01
3.64E-02 6.97E-02 8.46E-02 9.08E-02 9.40E-02 8.53E-02 6.81E-02
3.12 3.23 3.28 3.31 3.32 3.29 3.23
1,281 1,592
S11 S11 S11 S11
19 36 53 59
18 35 35 35
6.51E-03 1.36E-02 3.00E-02 3.84E-02
3.45E-02 6.91E-02 8.87E-02 9.26E-02
3.05 3.17 3.24 3.25
1,237 1,484
69
ρ (g/cc) K (MPa)
E(MPa)
ν
5,764 14,286 15,614 15,562
0.406 0.542 0.801 1.069
10,303 10,480 12,206 12,995 14,682
0.390 0.499 0.625 1.141 1.349
5,372 5,113 6,953 6,552 7,767 11,613
0.075 0.285 0.364 0.423 0.505 0.697
7,890 9,250 10,215 12,141 12,226
0.420 0.439 0.498 0.671 0.875
8,277 7,382 7,647 8,385 8,944
0.042 0.435 0.490 0.659 0.603
6,602 7,207
0.356 0.392
Table 2. Elastic moduli and associated experimental conditions. Bulk modulus, K, can only be directly determined using unloading loops during the hydrostatic portion of the test. Young’s modulus, E, and Poisson’s ratio, ν, can only be determined using unloading loops during the non-hydrostatic portion of the test. Sample ID S11 S11 S11 S11
σ11 (MPa)
σ33 (MPa)
ε11
εkk
ρ (g/cc) K (MPa)
66 71 79 89
35 35 35 35
5.97E-02 7.52E-02 1.05E-01 1.51E-01
9.56E-02 9.36E-02 8.21E-02 4.59E-02
3.26 3.25 3.21 3.09
S14 S14 S14 S14 S14 S14 S14 S14 S14
8 14 30 37 45 52 63 70 77
7 13 27 27 27 27 27 28 28
2.41E-03 5.47E-03 1.26E-02 1.93E-02 3.26E-02 5.13E-02 9.51E-02 1.40E-01 1.85E-01
1.25E-02 2.80E-02 6.35E-02 7.60E-02 8.38E-02 9.06E-02 8.83E-02 5.68E-02 -1.17E-03
2.91 2.96 3.07 3.11 3.14 3.16 3.15 3.05 2.87
789 1,038 1,289
S17 S17 S17 S17 S17 S17
11 22 34 37 47 54
11 21 21 21 21 21
5.59E-03 1.25E-02 2.95E-02 3.65E-02 6.59E-02 9.97E-02
3.05E-02 6.88E-02 9.07E-02 9.58E-02 1.08E-01 1.08E-01
2.88 3.00 3.07 3.09 3.13 3.13
822 1,213
ν
E(MPa) 7,872 8,324 7,872 8,996
0.501 0.635 0.647 0.906
7,365 6,498 6,007 7,339 8,425 8,382
0.135 0.343 0.433 0.650 0.783 0.889
2,834 5,959 7,959 10,264
0.311 0.358 0.465 0.568
Table 3. Key experimental values at selected points in each test. Sample #
S21
S1
S3
S9
S7
S11
S14
S17
Compaction Pressure (ksi)
20.00
10.00
8.00
7.00
6.00
5.00
4.00
3.00
Compaction Pressure (MPa)
137.93
68.97 55.17 48.28 41.38 34.48 27.59 20.69
Diameter (mm)
25.41
25.41 25.41 25.37 25.41 25.37 25.42 25.38
Length (mm)
50.86
50.83 50.82 50.82 50.83 50.86 50.84 50.80
Volume (cc)
25.79
25.78 25.77 25.69 25.78 25.71 25.80 25.70
Mass (g)
84.95
81.41 80.05 78.47 77.48 75.83 74.14 71.71
ρ after CPI (g/cc)
3.33
3.14
3.05
3.07
3.03
2.98
2.90
2.83
ρ pre test (g/cc)
3.29
3.16
3.11
3.05
3.01
2.95
2.87
2.79
Porosity pre test (%) Grain density (g/cc) Test Pressure (MPa)
37.46 5.27 138
38.56 38.90 40.58 41.95 43.33 45.77 47.31 5.14 5.08 5.14 5.18 5.21 5.30 5.30 70 55 50 43 36 30 20.5
70
Table 3. Key experimental values at selected points in each test. εkk @Test Pressure
0.13
ρ @Test Pressure (g/cc)
3.82
3.54
3.4
3.34
3.24
3.19
3.09
3.01
σ11 @C' (MPa)
239.00
126
102
87
72
65
57
50.5
σD @C' (MPa)
101.00
56.00
47.00
37.00
29.00
29.00
27.00
30.00
σmean @C' (MPa)
171.67
88.67
70.67
62.33
52.67
45.67
39.00
30.50
εkk @C'
0.15
0.1 0.094 0.096 0.093
0.11
ρ @C' (g/cc)
3.88
3.60
3.47
3.39
3.32
3.26
3.17
3.14
σ11,peak (MPa)
350.00
176
130
125
121
91
75
55
0.099 0.081
0.08 0.075 0.069 0.064 0.069
0.123 0.106
σD,peak (MPa) 212.00 106.00 75.00 75.00 78.00 55.00 45.00 34.50
Key to Error! Reference source not found. Sample #
Same as used in Table 1
Compaction Pressure (ksi)
Pressure applied during CIP (ksi)
Compaction Pressure (MPa)
Pressure applied during CIP (MPa)
Diameter (mm)
As-tested starting diameter
Length (mm)
As-tested starting length
Volume (cc)
As-tested starting volume, calculated
Mass (g)
As-tested starting mass
ρ after CPI (g/cc)
Density from Table 1, measured post CIP
ρ pre test (g/cc)
As-tested density, calculated
Porosity pre test (%) Grain density (g/cc) Test Pressure (MPa)
Porosity determined using pycnometer Grain density calculated using pycnometer results
εkk @Test Pressure
Volume strain at end of hydrostat (= is compactive)
ρ @Test Pressure (g/cc)
Calculated density at end of hydrostat
σ11 @C' (MPa)
Axial stress at compaction to dilation transition
σD @C' (MPa)
Stress difference (σ11 - σ33) at compaction to dilation transition
σmean @C' (MPa)
Mean stress, (σ11+ 2σ33)/3 ,at compaction to dilation transition
εkk @C'
Volume strain at compaction to dilation transition
ρ @C' (g/cc)
Density at compaction to dilation transition
σ11,peak (MPa)
Peak compressive stress
σD,peak (MPa)
Peak stress difference
Maximum hydrostatic pressure during test = CIP pressure
71
Experimental Results Results from the eight successful tests are combined on the following plots, using color coding and line style variations, as indicated in the legends, to differentiate the test results. Test results are referenced by the CIP pressure and sample number (e.g. 137 MPa S21). The CIP pressure used to prepare the sample was also the hydrostatic pressure applied to the sample during the reported triaxial tests. Error! Reference source not found. lists all properties for the as-received samples, using the same sample number as is used in the plot legends. Error! Reference source not found. and Error! Reference source not found. summarize key results for the triaxial tests. Stress histories for all tests are summarized in Error! Reference source not found. in the mean stress-vs.-stress difference space, where σmean = (σ11+2*σ33)/3 and σD=(σ11σ33)/2. These variables are the first and second stress invariants, to a multiplicative constant. The hydrostatic portion of each test follows the σmean axis, and is only visible because of small deviations from perfect hydrostatic loading. This is the same stress path followed during the CIP process. After the maximum hydrostatic pressure was reached, corresponding to the maximum pressure used during CIP, shear stress was applied to the sample by increasing σ11, resulting in the sloping portion of the stress history. During this phase of the test, the confining pressure PC = σ33 was held constant, but the mean stress continued to increase because of the increase of σ11.
CIP ZnO2
σD (MPa)
200 150
137 MPa S21 70 MPa S1 55 MPa S3 50 MPa S9 43 MPa S7 36 MPa S11 30 MPa S14 20.5 MPa S17
100 50 0 0
50
100
σmean
150
200
Figure 16. Stress path for all tests plotted using σmean = (σ11+2*σ33)/3 and σD=(σ11-σ33)/2.
72
Results of Hydrostatic Loading Volume strains were computed as εkk = ε11+2*ε33 , assuming that the lateral strains are isotropic, and treating compressive strains as positive. Results for all tests are shown in Error! Reference source not found.. The generally smooth form of the pressure-volume strain curves is interrupted by a few glitches that are the result of incomplete removal of the data points taken during the unloading loops. We observed a consistent pattern in volume strains as a function of the CIP pressure applied in forming the sample. At a given confining pressure, PC , lower CIP pressures resulted in higher compressive volume strains during the triaxial tests. This is as expected since the CIP removes more porosity as the CIP pressure increases, resulting in a material that is less compliant (higher bulk modulus). As an example, compare the results for S21 and S17, which were CIPed at 137 and 20.5 MPa, respectively. When pressure was reapplied during triaxial testing, S21, the stiffer material formed at a higher CIP pressure exhibited less compactive volume strain than sample S17.
CIP ZnO2
PC
100
137 MPa S21 70 MPa S1 55 MPa S3 50 MPa S9 43 MPa S7 36 MPa S11 30 MPa S14 20.5 MPa S17
50
0
0
0.05 εkk
0.1
0.15
Figure 17. Volume strain, εkk, during hydrostatic loading of the samples. Compression results in positive values of, εkk. Minor deviations from smooth compression are experimental artifacts. Bulk moduli, measured by computing the slope of unloading loops, were found to be consistent for the 8 tests, varying from 1 GPa at the lowest pressure where measurements were made to 4 GPa at the highest. It would be expected that the bulk modulus would be increased as a result of the pressure-induced porosity decrease during CIPing, and would remain high after unloading. Error! Reference source not found. replots the pressurevolume strain data, using the left axis for the pressure, and overlays the bulk moduli, using the right-hand axis. Color and size coded symbols are used for the moduli, with
73
colors matching the corresponding line color for the strain data. Large dots are used for moduli measured during the tests plotted using the solid lines, and small dots correspond to the tests plotted using dashed lines. The hydrostatic portion of each test applied the same maximum pressure as was used during preparation of the sample by CIPing. Thus the tests may be viewed as eight replications of the same stress path on the same material, and it would be expected that the moduli from the various tests would appear to be from one test to the highest pressure. And in fact, a general trend was observed of increasing bulk moduli with increasing compressive volume strain. There is a fair amount of scatter in the moduli as plotted in Error! Reference source not found.. The cause of the scatter is the use of εkk as the independent variable. Volume strain does not take into account the different initial densities; it always starts at zero in the initial state. Error! Reference source not found. shows that ρnorm , density normalized to theoretical density, is a more appropriate choice of independent variable, because it does account for the densification accomplished by CIPing. When the moduli are plotted as a function of density, normalized to the theoretical density, they are seen to follow one curve, implying a strong functional relationship between density and bulk modulus. The outliers above the main curve are bulk moduli computed during the shear loading portion of the test, and will be discussed later. The main trend is what would be observed if all measurements were made on one sample, CIPed at a low pressure, and compressed to a maximum pressure of 137 MPa.
74
Figure 18. Pressure-vs.- volume strain, εkk, for the hydrostatic phase of all tests (left axis), overlaid with the bulk modulus, K (right axis). Large dots are used to indicate the moduli for the test plotted in the same color using solid lines, while small dots represent the moduli for tests plotted in the matching color using dashed lines.
Results From Non-hydrostatic Loading Stress-strain plots for the non-hydrostatic portion of the tests are shown in Error! Reference source not found. through Error! Reference source not found.. The stress path for this portion of the tests corresponds to the upward slanting lines in the stress history plot (Error! Reference source not found.). All samples exhibited the same pattern of deformation, which is typical of polycrystalline media with porosity. We will discuss a few aspects using S21 (thick blue line) as an example. During the hydrostatic portion of the test (σ11 = σ33 = PC ) axial and lateral strains are both compressive but the lateral strain ε33 which is the right-most thick blue line showed more compressive strain. At the peak pressure (137 MPa) ε33 was about 0.05 while the axial strain ε11 was smaller at 0.025. For an isotropic material, of course, the strains would be the same. We attribute the difference to the die precompaction that was done on the samples prior to CIP. It appears that the compressive strains induced by the precompaction increased the axial stiffness by about a factor of 2, even after CIP. Similar results were observed for the other samples. At the commencement of non-hydrostatic loading, ε11 and ε33 showed divergent behavior, with ε11 exhibiting compaction, while ε33 showed expansion. This is of course just the result of the Poisson effect. When the volume strain is considered (Error! Reference source not found.), a less common phenomenon was observed; compaction ceased and 75
the samples began to expand or dilate even under increasing σ11. Many geomaterials exhibit dilatation under compressive stresses, and the cause is always non-linear, nonelastic microscale behavior such as grain cracking or slip on the boundary between grains, resulting in increased lateral expansion sufficient to overcome the axial shortening and resulting in a volume increase. Although Error! Reference source not found. lists a peak stress σ11,peak, it is clear that the stress never really reached a maximum, but only a slowly increasing phase. Note that σ11 has been corrected for the increase in cross sectional area due to the lateral strains ε11. Density increased during the hydrostat, and during the initial phase of non-hydroatatic loading. However as Error! Reference source not found. and Error! Reference source not found. show, at higher stresses, the density reached a maximum and began to decrease due to the transition from compaction to dilation. In geomechanics the transition point is referred to as C’ (see Error! Reference source not found.). Error! Reference source not found. uses σmean as the ordinate which is a more appropriate variable for considering the functional dependence of volume strains. Stress difference at C’ and at the peak (approximately) is plotted as a function of confining pressure in Error! Reference source not found.. The peak stress difference-vs.- pressure can be considered as an approximation to the ultimate yield surface, with the caveat that the stress never reached an absolute maximum. It is not known if a maximum would have been reached if the axial shortening had been continued past 15 or 20%. Samples did not exhibit significant barreling (inhomogeneous lateral strain with a maximum at the sample midlength) even at these high axial strains, so meaningful data could be obtained at higher axial strains. Error! Reference source not found. compares the densities at several points during the testing process. Densities observed post-CIP (magenta squares) match closely with the pre-test densities (black diamonds) calculated using the mass and dimensions of the samples after preparation. This is an internal consistency check, and shows that no damage was done during sample preparation. At the end of the hydrostatic phase, densities were higher of course (red dots), but there was no significant increase in density during the non-hydrostatic phase up to C’, where densities actually began to decrease as shown in Error! Reference source not found..
76
Figure 19. Pressure-vs.- ρnorm for the hydrostatic phase of all tests (left axis), overlaid with the bulk modulus K (right axis). Large dots are used to indicate the moduli for the test plotted in the same color using solid lines, while small dots represent the moduli for tests plotted using dashed lines. See text for explanation of outliers above the main trend line.
CIP ZnO2 137 MPa S21 70 MPa S1 55 MPa S3 50 MPa S9 43 MPa S7 36 MPa S11 30 MPa S14 20.5 MPa S17
σ11
300
200
100
0
-0.1 -0.05
0
0.05
0.1 0.15 ε33 ε11
0.2
0.25
0.3
Figure 20. ε11 and ε33 as a function of σ11 showing initial compaction (right trending) up to the test pressure, followed by further compression for ε11, but changing to expansion for ε33 (left leaning).
77
CIP ZnO2 137 MPa S21 70 MPa S1 55 MPa S3 50 MPa S9 43 MPa S7 36 MPa S11 30 MPa S14 20.5 MPa S17
σ11
300
200
100
0
0
0.05
0.1 εkk
0.15
0.2
0.25
Figure 21. Volume strain, εkk, exhibiting compaction (right trending) during the hydrostatic phase, and continuing to compact into the shear phase. All samples reached a state where the compaction ceased, and the sample began to expand under increasing axial stress, as indicated by the trend to the left.
CIP ZnO2
σ11 (MPa)
300
200
137 MPa S21 70 MPa S1 55 MPa S3 50 MPa S9 43 MPa S7 36 MPa S11 30 MPa S14 20.5 MPa S17
100
0
2.8
3
3.2
3.4 ρ (g/cc)
Figure 22. Density calculated from the volume strains.
78
3.6
3.8
4
CIP ZnO2
σmean (MPa)
200 150
137 MPa S21 70 MPa S1 55 MPa S3 50 MPa S9 43 MPa S7 36 MPa S11 30 MPa S14 20.5 MPa S17
100 50 0
0.5
0.55
0.6 ρnorm
0.65
0.7
Figure 23. Density normalized to the theoretical density 5.67 g/cc, plotted against the mean stress.
CIP ZnO2 225.00
Peak Stress c'
200.00
σ D (MPa)
175.00 150.00 125.00 100.00 75.00 50.00 25.00 0.00 0
25
50
75
100
125
150
Confining Pressure (MPa)
Figure 24. Peak stress difference (approximate, see text) and C’ as a function 79
of the confining pressure for the eight tests.
CIP ZnO2 175
σ mean (MPa)
150 125 100
ρ post-CIP ρ pretest ρ hydrostatic ρ at c'
75 50 25 0 2.75
3.25
3.75
ρ (g/cc)
Figure 25. Densities for all tests after CIP, and before testing, at the end of the hydrostatic phase, and at C’ when compaction ceased. As was done in the hydrostatic phase, small (10-20 MPa) unload-reload loops were performed during the non-hydrostatic phase to measure Young’s modulus, E, parallel to the sample axis, and Poisson’s ratio, ν. For clarity, the loops have been removed from the plotted stress-strain data. In an attempt to determine the functional relationships between the experimental parameters and the evolving moduli, several different ways of plotting the moduli were tried. Tabulated values for the moduli are contained in Error! Reference source not found.. Error! Reference source not found. through Figure 15 show various permutations of variables that were tried. In all of these plots, the right hand axis is used to plot the modulus. The left hand axis plots experimental variables that were chosen to give clear picture of the relationship between the stage of the test and the modulus measured at that stage. Initially, it was expected that E, measured parallel to the sample axes, would be most influenced by the axial strain, ε11. This was based on the assumption that E is most affected by closing crack-like porosity oriented perpendicular to the direction along which E was measured. As Error! Reference source not found. shows, there was not a strong relationship between E and ε11. As will be discussed a little later, the shear strain, ε11 - ε33, is a good predictor of Poisson’s ratio, but was not found to be any better at predicting E than ε11 (not shown).
80
The other parameter that controls closure of crack-like porosity is the axial stress σ11. Since the relationship between ε11 and σ11 is non-linear, the plot of E as a function of σ11 (Error! Reference source not found.) contains different information. The left hand axis plots the density normalized to the pre-test density to show clearly the progression from increasing density to C’, where density begins to decrease. E has a linear relationship to σ11, increasing from 5 to 15 GPa, with the linear trends offset by the confining pressure PC = σ33. Examination of the linear trend for an individual test shows that the transition from compaction to dilation (ρ increasing to ρ decreasing) was not reflected in the moduli. This is consistent with a model where dilation is due to the increasing dominance of a micromechanism producing lateral strain over the micromechanism responsible for axial shortening and increasing E. The dilation mechanism does not affect the axial shortening mechanism, and so does not affect the Young’s modulus.
Figure 26. Stress difference (left axis) and Young’s modulus, E, (right axis) as a function of axial strain. Large dots correspond to the solid line of the same color, and small dots correspond to the similarly colored, dashed lines.
81
Figure 27. Density normalized to its pre-test value (left axis) and Young’s modulus, E, (right axis) as a function of axial stress. Large dots correspond to the solid line of the same color, and small dots correspond to the similarly colored, dashed lines
Figure 28. Density normalized to its pre-test value (left axis) and Young’s modulus, E, (right axis) as a function of stress difference. Large dots correspond to the solid line of the same color, and small dots correspond to the similarly colored, dashed lines
82
Since the linear trends for moduli from separate tests plotted in Error! Reference source not found. are offset due to the inclusion of PC in σ11, it is reasonable to replot the data using the stress difference in σD = σ11 - PC. Removing the offset due to PC results in a fairly simple relationship between σD and E as shown in Error! Reference source not found.. The exercise was repeated for Poisson’s ratio, ν with the results shown in Error! Reference source not found. through Error! Reference source not found.. Because ν is a function of both the lateral and the axial strain, a more complex relationship was expected between it and the experimental parameters. Error! Reference source not found. is analogous to Error! Reference source not found. and shows a similar set of linear relations between σ11 and ν as was observed between σ11 and E. An expanded view (Error! Reference source not found.) emphasizes that, for each sample, ν increased linearly as a function of σ11. An attempt to remove the effect of PC was less successful than a similar attempt for E (compare Error! Reference source not found. and Error! Reference source not found.). The reason appears to be that the slope of the ν versus σ11 lines is not a constant; in particular the slope is much less for S21, the test conducted at 137 MPa. A striking difference was observed when ν was plotted as a function of the shear strain, ε11 - ε33 (Error! Reference source not found.). In contrast to what was found for E as a function of shear strain, ν is well predicted by the shear strain for all tests. The reason for the difference is not understood, although one might speculate that the dependence of ν on both ε11 and ε33 may be part of the explanation. A novel aspect of the evolution of ν is that, for each test, ν > 0.5 for much of the test. It might be expected that this is a result of the transition from compaction to dilation at C’, which forces abs(dε33/ dε11) > 0.5. However this is not the value for ν that is plotted in the various figures. The plotted value is the slope of the unload loops, which are almost never parallel to the stress-strain curves. Thus, in general, the plotted values for ν, derived from the loops which are assumed to represent an elastic process, are not equal to the local slope of ε33 versus ε11. Poisson’s ratios above 0.5 are the result of the rather counter intuitive behavior of dilatant materials; reducing the axial stress causes the material volume to decrease. Related behavior is exhibited by some materials, such as Goretex, which has a negative Poisson’s ratio. The key to the anomaly is the micromechanism responsible for dilation. In geomaterials, increasing shear stress causes slip on cracks and grain boundaries, resulting in lateral strains that exceed half of the axial strains, resulting in a net volume increase. When the shear stress is lowered, the micromechanism can reverse, leading to a decrease in material volume, even though the stress is decreasing. Another surprising result is found in Error! Reference source not found.. The left axis corresponds to the solid and dashed lines which show the change in density as the axial stress was increased, and the right axis shows ν. The dotted horizontal line marks ν = 0.5. Using this plot it is easy to determine the transition from compaction to dilation. For example, data for S21 (solid blue line) show that the transition occurs at about 250 MPa. The surprising observation is that, by interpolating between the points where ν was
83
measured, we see that ν ∼= 0.5 at that same value, and similarly for the other test. There is no obvious reason why this should occur. Again, speculation points to the micromechanism, but further work would be required to understand this coincidence. Finally, a bulk modulus can be calculated from E and ν using K = E/(3*(1-2ν)). This should be treated cautiously due to the stress-induced anisotropy, and the issues related to ν > 0.5. Results of the calculation are plotted in Error! Reference source not found. and Error! Reference source not found. along with the bulk moduli measured during the hydrostat. At this scale, K values during the hydrostatic phase are a linear function of axial stress, as emphasized by the line added to Error! Reference source not found. connecting just those data points. When shear stress is applied, calculated values of K increase rapidly by factors of 4 or more.
Figure 29. Density normalized to its pre-test value (left axis) and Poisson’s ratio ν (right axis) as a function of axial stress. The horizontal dotted line marks ν=0.5, implying an incompressible material. Large dots correspond to the solid line of the same color, and small dots correspond to the similarly colored, dashed lines.
84
Figure 30. Expanded view of the lower stress portion of Error! Reference source not found. showing the trend of increasing ν more clearly in the plot of density normalized to its pre-test value (left axis) and Poisson’s ratio ν (right axis) as a function of axial stress. Large dots correspond to the solid line of the same color, and small dots correspond to the similarly colored, dashed lines.
Figure 31 Density normalized to its post-CIP value (left axis) and Poisson’s ratio ν (right axis) as a function of stress difference. Large dots correspond to the solid line of the same color, and small dots correspond to the similarly colored, dashed lines
85
Figure 32. Stress difference (left axis) and Poisson’s ratio ν (right axis) as a function of shear strain. Large dots correspond to the solid line of the same color, and small dots correspond to the similarly colored, dashed lines
Figure 33. Density normalized to pre-test value (left axis, lines) and bulk moduli (right axis, dots) as a function of axial stress. Large dots correspond to the solid line of the same color, and small dots correspond to the similarly colored, dashed lines.
86
Figure 34. Stress difference history (left axis, lines) and bulk moduli (right axis, dots) as a function of mean stress. Large dots correspond to the solid line of the same color, and small dots correspond to the similarly colored, dashed lines. The black line connects K values measured during the hydrostats. Other values of K are calculated.
Appendix D
87
Operated for the U.S. Department of Energy by
Sandia Corporation Albuquerque, New Mexico 87185-0847
8/20/2006
date:
Distribution
to:
from:
A. F. Fossum (6117)
subject:
MS0751
GeoModel fits and parameters for 94% alumina, 99.5% alumina, and zircoa p1 ceramic powders
Introduction This memorandum summarizes my efforts to fit the Sandia GeoModel (generalized visco-plasticity model for porous materials as described in [1]) to experimental data obtained for 94% alumina, 99.5% alumina, and zircoa p1 ceramic powders. Previously, these ceramic powders were fitted with the Sandia Cap Model, a simple two-surface cap plasticity model. The Sandia GeoModel provides much more generality than its predecessor and is thus capable of providing a more accurate representation of the powder compaction process. By taking advantage of the latest developments, a number of shortcomings of the earlier cap plasticity model have been overcome. In addition, all of the work presented here is based on a logarithmic strain measure as opposed to the engineering strain measure used previously. This is warranted because of the relatively high (~30-50 %) values of strain measured during the tests. In this work, a nonlinear bulk modulus (not available previously) was used to model the elastic portion of the compaction process that resulted in a better fit not only for the hydrostatic load path, but also for the triaxial compression load path following hydrostatic load up. In addition, the GeoModel provided a smooth transition of the volumetric strain deformation from a compaction-dominated response during pore collapse to a volume-expansion-dominated response that occurs during intra-granular microcracking. This was not possible with the earlier cap plasticity model. Moreover, the GeoModel included a new and more realistic ‘pressure-volume’ response function to be used for powder-to-solid deformation. In the earlier work a power-law function was used to match the highly compactable pressure-volume response of the powder
88
and was used in place of the usual exponential spline. It was found in the current study, however, that the power-law function, because it does not allow the inelastic volumetric strain to asymptote to the initial porosity, did not result in very good volumetric strain predictions during the non-hydrostatic portions of the triaxial compression experiments. Therefore, a new ‘pressure-volume’ function was used that can adequately match the data and allow the inelastic volume strain to asymptote to the initial porosity. These issues, nonlinear elastic behavior in bulk, pressure-volume response, and transitioning from inelastic compaction to dilatation are important ones because they would affect the predictions of density gradients in green compacts. In the remainder of this memo, I will show the model predictions, for each of the powders, of shear failure followed by volumetric strain response versus the data for the triaxial compression experiments in which the hydrostatic portion of the experiment is the initial powder compaction. This is the critical predictive capability from the standpoint of modeling the pressing process in which the goal is to analyze the causes for density gradients in green compacts. Each axial stress versus volumetric strain prediction will be followed by a table of the parameters as they are found in JAS3D.
94% Alumina Powder 9000 8000 7000
5000 4000
J2
1/2
(psi)
6000
3000 94% Alumina Data GeoModel
2000 1000 0 0
-10000
-20000
-30000
-40000
-50000
I1 (psi)
Figure 1 GeoModel peak shear predictions versus data from shear-failure experiments on 94% alumina ceramic powder
89
-30000 GeoModel 94% Alumina Data
Axial Stress (psi)
-25000
-20000
-15000
-10000
-5000
0 0.00
-0.10
-0.20
-0.30
-0.40
-0.50
-0.60
-0.70
Volume Strain
Figure 2 GeoModel stress-volumetric strain predictions versus data from triaxial compression experiments on 94% Alumina ceramic powder
Table 4 Input parameters for 94% Alumina powder
! ! ! ! ! ! ! ! ! ! ! ! ! ! ! ! ! ! ! ! ! !
Material model input parameters: B0 B1 B2 (psi) (psi) (psi) 3.5000E+04 1.0000E+06 1.0000E+04
B3 (psi) 0.0000E+00
B4 G0 G1 G2 G3 G4 (ndim) (psi) (psi) (ndim) (1/psi) (ndim) 0.0000E+00 1.0707E+05 0.0000E+00 0.0000E+00 0.0000E+00 0.0000E+00
RJS RKS RKN (in) (psi/in) (psi/in) 0.0000E+00 0.0000E+00 0.0000E+00
A1 (psi) 3.5259E+04
A2 (1/psi) 5.9661E-06
P3 (1) 5.7945E-01
CR (ndim) 3
RK (ndim) -1
RN (psi) 0.0000E+00
HC CUTI1 CUTPS (psi) (psi) (psi) 0.0000E+00 3.0000E+06 1.0000E+06
T4 (1/s) 0
T5 (psi) 0
T6 (s) 0
T7 (psi) 0
J3TYPE (ndim) 2
SP01 (-) 0
SP02 (-) 0
SP03 (-) 0
SP04 (-) 0
SP05 (-) 0
SP06 (-) 0
CN1 (psi/in) 0
CN2 (psi/in) 0
CN3 (psi/in) 0
VM1 (in) 0
VM2 (in) 0
VM3 (in) 0
ST2 (psi/in) 0
ST3 (psi/in) 0
! ! ********************************************
90
A3 A4 P0 P1 P2 (psi) (psi) (rad) (1/psi) (1/psi^2) 3.5074E+04 0.0000E+00 -1.0000E-10 2.6000E-04 0.0000E+00 T1 (s) 0
T2 (1/s) 0
T3 (ndim) 0
CRPF (ndim) 3
RKPF (ndim) -1
SUBX
SP07 (-) 0
SP08 (-) 0
SP09 (-) 0
SP10 (-) 0
SP1 (in) 0
SP2 (in) 0
SP3 (in) 0
ST1 (psi/in) 0
A2PF A4PF (1/psi) (rad) 5.9661E-06 0.0000E+00
1
99.5% Alumina Powder 10000 9000 8000 7000
J2
1/2
(psi)
6000 5000 4000 3000
99% Alumina data GeoModel
2000 1000 0 0
-10000
-20000
-30000
-40000
-50000
I1 (psi)
Figure 3 GeoModel peak shear predictions versus data from shear-failure experiments on 99.5% alumina ceramic powder
91
-30000 GeoModel 99.5% Alumina Powder
Axial Stress (psi)
-25000
-20000
-15000
-10000
-5000
0 0.00
-0.10
-0.20
-0.30
-0.40
-0.50
-0.60
Volume Strain
Figure 4 GeoModel stress-volumetric strain predictions versus data from triaxial compression experiments on 99.5% Alumina ceramic powder
Table 5 Input parameters for 99.5% Alumina powder
! ! ! ! ! ! ! ! ! ! ! ! ! ! ! ! ! ! ! ! ! !
Material model input parameters: B0 (psi) 3.5000E+04
B1 (psi) 3.00E+06
B2 (psi) 2.50E+04
B3 (psi) 0.00E+00
B4 (ndim) 0
G0 (psi) 3.140E+05
G1 (ndim) 0
RJS (in) 0.00E+00
RKS (psi/in) 0.00E+00
RKN (psi/in) 0.00E+00
A1 (psi) 3.0066E+04
A2 (1/psi) 7.9986E-06
A3 (psi) 3.0063E+04
A4 (rad) 0.00E+00
P3 (1) 0.44974235
CR (ndim) 3
RK (ndim) -1
RN (psi) 0.00E+00
HC (psi) 1.00E+03
CUTI1 (psi) 3.00E+06
CUTPS (psi) 1.00E+06
T4 (1/s) 0.00E+00
T5 (psi) 0.00E+00
T6 (s) 0.00E+00
T7 (psi) 0.00E+00
J3TYPE (ndim) 2
SP01 (-) 0
SP02 (-) 0
SP03 (-) 0
SP04 (-) 0
SP05 (-) 0
SP06 (-) 0
CN1 (psi/in) 0
CN2 (psi/in) 0
CN3 (psi/in) 0
VM1 (in) 0
VM2 (in) 0
VM3 (in) 0
ST2 (psi/in) 0
ST3 (psi/in) 0
! ! ********************************************
92
G2 (1/psi) 0
G3 (psi) 0
G4 (ndim) 0
P0 P1 P2 (psi) (1/psi) (1/psi^2) -1.000E-10 4.0000E-04 0.0000E+00 T1 (s) 0.00E+00
T2 (1/s) 0
T3 (ndim) 0
CRPF (ndim) 3
RKPF (ndim) -1
SUBX
SP07 (-) 0
SP08 (-) 0
SP09 (-) 0
SP10 (-) 0
SP1 (in) 0
SP2 (in) 0
SP3 (in) 0
ST1 (psi/in) 0
A2PF A4PF (1/psi) (rad) 7.9986E-06 0.0000E+00
1
Zircoa P1 Powder
12000
10000
6000
J2
1/2
(psi)
8000
4000 GeoModel Zircoa P1 Powder
2000
0 0
-10000
-20000
-30000
-40000
-50000
I1 (psi)
Figure 5 GeoModel peak shear predictions versus data from shear-failure experiments on Zircoa P1 ceramic powder
-30000
-25000
Axial Stress (psi)
-20000
-15000
-10000
-5000
0 0.00
-0.10
-0.20
-0.30
-0.40
-0.50
-0.60
Volume Strain
Figure 6 GeoModel stress-volumetric strain predictions versus data from triaxial compression experiments on Zircoa P1 ceramic powder
93
Table 6 Input parameters for Zircoa P1 powder
! ! ! ! ! ! ! ! ! !
Material model input parameters: B0 (psi) 3.000E+04
B1 (psi) 2.00E+06
B2 (psi) 9.00E+03
B3 (psi) 0.00E+00
B4 (ndim) 0
G0 (psi) 1.523E+06
G1 (ndim) 0
RJS (in) 0.00E+00
RKS (psi/in) 0.00E+00
RKN (psi/in) 0.00E+00
A1 (psi) 2.3744E+04
A2 (1/psi) 1.1370E-05
A3 (psi) 2.3743E+04
A4 (rad) 0.00E+00
P3 (1)
CR (ndim) 3
RK (ndim) -1
RN (psi) 0.00E+00
HC (psi) 1.00E+03
CUTI1 (psi) 3.00E+06
CUTPS (psi) 1.00E+06
T4 (1/s) 0
T5 (psi) 0
T6 (s) 0
T7 (psi) 0
J3TYPE (ndim) 2
SP01 (-) 0
SP02 (-) 0
SP03 (-) 0
SP04 (-) 0
SP05 (-) 0
SP06 (-) 0
CN1 (psi/in) 0
CN2 (psi/in) 0
CN3 (psi/in) 0
VM1 (in) 0
VM2 (in) 0
VM3 (in) 0
ST2 (psi/in) 0
ST3 (psi/in) 0
0.47 ! ! ! ! ! ! ! ! ! ! ! !
G2 (1/psi) 0
G3 (psi) 0
G4 (ndim) 0
P0 P1 P2 (psi) (1/psi) (1/psi^2) -1.000E-10 2.7000E-04 0.000E+00 T1 (s) 0
T2 (1/s) 0
T3 (ndim) 0
CRPF (ndim) 3
RKPF (ndim) -1
SUBX
SP07 (-) 0
SP08 (-) 0
SP09 (-) 0
SP10 (-) 0
SP1 (in) 0
SP2 (in) 0
SP3 (in) 0
ST1 (psi/in) 0
A2PF A4PF (1/psi) (rad) 1.1370E-05 0.000E+00
1
! ! ********************************************
Discussion The Sandia GeoModel did a remarkably good job in being able to characterize the volumetric strain behavior during hydrostatic and triaxial compression experiments on the three powders, which in the case of the 94% alumina powder reached 60% strain. Notable in these calculations is the ability of the model to capture the classic ‘turn around’ of the stress-strain curve after the pore space has been depleted. The ability of the model to represent the volumetric strain accurately should enhance our overall capability to analyze the causes for density gradients in “green” bodies. Distribution: J.G. Arguello (1525) D.H. Zeuch (0241) K. Ewsuk (1815) T.W. Pfeifle (6117)
MS0376 MS0415 MS1349 MS0751
94
References 1. Fossum, A.F. and Brannon, R.M. (2004). “The Sandia GeoModel: theory and user’s guide,” Technical report No. SAND2004-3226 UC-405, Sandia National Laboratories, Albuquerque
95
Distribution 1
MS1349
Kevin Ewsuk, 1815
2
MS9018
Central Technical Files, 8945-1
2
MS0899
Technical Library, 4536
1
MS0123
D. Chavez, LDRD Program, 1011
96
97