Advanced Supercomputing Technology for Big Data Science Bo-Wen Shen, Ph.D.
[email protected] Department of Mathematics and Statistics Center for Climate and Sustainability Studies Computational Science Research Center San Diego State University Templo Room, Conrad Prebys Aztec Student Union San Diego State University 7 March 2015 Supercomputing Technology for BDS
1
San Diego State Univ. Mar 07, 2015
Outline
1. Introduction 2. Concurrent Visualization (and Supercomputing Technology) for Effective Data Presentation 3. Parallel Ensemble Empirical Mode Decomposition (PEEMD) for Multiscale Data Analysis and Scientific Insights 4. High-order Lorenz Models to Reveal Negative Nonlinear Feedback 5. Summary and Future Tasks
Supercomputing Technology for BDS
2
San Diego State Univ. Mar 07, 2015
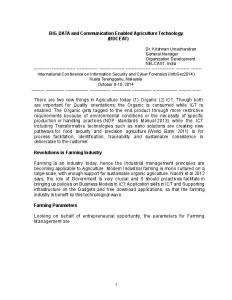
Simulations of Global Tropical Cyclones
Hurricane France Hurricane Howard Tropical Storm Phoebe Super typhoon Sonda Supercomputing Technology for BDS
3
San Diego State Univ. Mar 07, 2015
Volume, Variety, and Velocity • • • •
Global Multi-dimensional (3D) multivariate, High temporal-spatial resolution
2D Grid Cells vs. Grid Spacing
Resolution
x
y
Grid cells
2.5o (~280km)
144
91
13K
1o (~110km)
288
181
52 K
0.5o (~55km)
576
361
208 K
0.25o (~28km)
1000
721
721 K
0.125o (~14km)
2880
1441
4.15 M
0.08o (~9km)
4500
2251
10.13 M
MMF (2D CRM)
144x64
90
829 K
Supercomputing Technology for BDS
4
San Diego State Univ. Mar 07, 2015
NASA Supercomputing and Visualization Systems Pleiades Supercomputer (as Nov. 2014) • Large-scale visualization system • one of a few petascale supercomputers – 8x16 LCD tiled panel display • Rmax of 3,375 teraflops (LINPACK); – 245 million pixels Rpeak of 3,988 teraflops • 128 nodes with 1024 cores and 128 GPUs • 160,768 cores in total; • InfiniBand (IB) interconnect • 532 TB memory; 3.1 PB disk space
Supercomputing Technology for BDS
5
San Diego State Univ. Mar 07, 2015
Global Mesoscale Modeling on NASA Supercomputers
A
B D
Sonda
C
Frances
G
F E
5-day forecasts of total precipitable water initialized at 0000 UTC 1 September, 2004 with the 1/12o fvGCM
F: Madden-Julian Oscillation (MJO) G: African Easterly Wave (AEW)
D: Asian Mei-Yu Front E: Twin Tropical Cyclones
A: Atlantic Hurricanes B: Catalina Eddy C: Hawaiian Lee Wakes
Concurrent Visualization
for Effective Data Presentation
1. Large time-varying simulations generate more data than can be saved – Problem gets worse as processing power increases – Models increase spatial and temporal-resolution 2. Saving data to mass storage consumes a significant portion of runtime 3. Only a small fraction of timesteps are typically saved and important dynamics may be missed
process huge data efficiently
1. Extract data directly from running simulation for asynchronous processing • Add instrumentation to the simulation code, usually quite minimal 2. Simultaneously produce a series of visualizations • Many fields; • Multiple views 3. Generate and store images, movies, and “extracts” 4. Send visualizations of current simulation state almost anywhere, including web • Images of current state kept up-to-date in web browser • Stream progressively growing movies to remote systems 5. Use hyperwall-2 for parallel rendering and asynchronous I/O
generate visualizations while model is still running Supercomputing Technology for BDS
7
San Diego State Univ. Mar 07, 2015
M-on-N Concurrent Visualization Model
• M-on-N model takes advantage of new Pleiades-hyperwall-2 IB network topology • Uses the simulation’s parallel decomposition • These new features enable Large-scale 3D Concurrent Visualization Green, B., C. Henze, B.-W. Shen, 2010: Development of a scalable concurrent visualization approach for high temporal- and spatial-resolution models. AGU 2010 Western Pacific Geophysics Meeting, Taipei, Taiwan, June 22-25, 2010.
Supercomputing Technology for BDS
8
San Diego State Univ. Mar 07, 2015
Concurrent Visualization: Benefits • Higher temporal resolution than post-processing – Avoids disk space and write speed limits – Output typically 10-1000x greater than standard I/O • See current state of simulation as its running – Application monitoring or steering – Detect serious job failures that might otherwise cause waste of system resources • Minimal impact to application – Data is offloaded to vis cluster for concurrent processing • Reveals features not otherwise observable – Has consistently revealed previously unknown dynamics Supercomputing Technology for BDS
9
San Diego State Univ. Mar 07, 2015
Concurrent Visualizations: Butterfly Effect?
Green, B., C. Henze, B.-W. Shen, 2010: Development of a scalable concurrent visualization approach for high temporal- and spatial-resolution models. Eos Trans. AGU, 91(26), West. Pac. Geophys. Meet. Suppl., Abstract A23B-142. AGU 2010 Western Pacific Geophysics Meeting, Taipei, Taiwan, June 22-25, 2010. Shen, B.-W., B. Nelson, W.-K. Tao, and Y.-L. Lin, 2013a, "Advanced Visualizations of Scale Interactions of Tropical Cyclone Formation and Tropical Waves," Computing in Science and Engineering, vol. 15, no. 2, pp. 47-59, March-April 2013, doi:10.1109/ MCSE.2012.64 Supercomputing Technology for BDS
10
San Diego State Univ. Mar 07, 2015
Coupled Modeling and Visualization Systems: Why? Model form
Representation of solutions
Remarks
Mathematical equations (linear)
Analytical solutions
math symbols or functions
Mathematical equations (nonlinear)
numerical solutions (contour lines)
complicated functions; graphics
Numerical models (one component)
data; Complicated graphics; 2D visualizations
graphics
Coupled models (multiple components)
huge data; (local) 3D visualizations
visualizations with a zoomedin view
(loosely or tightly) coupled numerical model with visualization systems
massive data; (global) “Live” 3D visualizations;
Visualizations with both zoomed-in and zoomed-out views, the latter of which focus the relationships between local and remote events
Supercomputing Technology for BDS
(a “live” visualization refers to as the one at high spatial and temporal resolutions)
11
San Diego State Univ. Mar 07, 2015
Live 3D Visualizations: Benefits • Inspire and motivate young students and researchers, who live in the world full of fancy visualizations, to investigate hurricanes dynamics; • Improve the public understanding of hurricane dynamics and predictions, namely the understanding of hurricane dynamics by non-experts; • Help numerical modelers quickly understand the dependence of TC simulations on the changes of model’s grid spacing, physics parameterizations, and land surface processes etc; • Promote the “integrative” (global; non-local) view on the scale interactions of hurricane dynamics and scale dependence of predictability among hurricane experts in Earth Science community, including the horizontal interactions (termed as “horizontal phasing”) between two approaching systems; and processes that lead to vertical coherence (termed as “vortex phasing” for TCs). Supercomputing Technology for BDS
12
San Diego State Univ. Mar 07, 2015
Architecture of the CAMVis v1.0
(the Coupled Advanced Multiscale modeling and concurrent Visualization systems; Shen e al. 2011)
Multi-scale Modeling with “M” nodes
Current Visualization with “N” nodes
Real-time Display
GMM
Large Scale Intra-communication
Parallel I/O Search for the predictability limits
RDMA MMF Coupler • data regridding; Inter-communication • data input and output
Intra-communication
Cloud Scale mgGCE
Simulation Simulation Supercomputing Technology for BDS
Parallel Transfer Extraction
Visualization Visualization 13
comparison Discovery with satellite MPEG generation San Diego State Univ. Mar 07, 2015
Empirical Mode Decomposition (EMD) for Multiscale Data Analysis and Scientific Insights
1. HHT (Hilbert Huang Transform, Huang et al., 1998; Huang and Shen, 2005,2014) consists of Empirical mode decomposition (EMD) and Hilbert Transform. 2. The data-driven EMD method is Complete, Orthogonal, Local, and Adaptive (COLA), which is ideal for the local and nonlinear analysis. 3. EMD generates a set of intrinsic mode functions (IMFs), each of which has features with comparable scales (Wu and Huang 2009, and references therein). 4. EMD performs like a filter bank (e.g., a dyadic filter); the unique feature suggests a potential for hierarchical multiscale analysis.
Supercomputing Technology for BDS
14
San Diego State Univ. Mar 07, 2015
Fourier, Wavelet and EMD/HHT Analysis
Fourier a priori
Wavelet a priori
Hilbert/EMD adaptive
Frequency
convolution: global, uncertainty
convolution: regional, uncertainty
differentiation: local, certainty
Presentation
energy-frequency
energy-timefrequency
energy-timefrequency
Nonlinearity
no
no
yes
Nonstationarity
no
yes
yes
Feature extraction
no
discrete: no, continuous: yes
yes
Theoretical base
theory complete
theory complete
empirical
Basis
Huang (2005); Huang et al., (1998); Note: The above table with the major change (highlighted in blue) is updated based on the more recent table of Huang (2005). In addition, the uniqueness of the EMD method is indicated by the recent study of Daubechies et al (2011) who developed the synchrosqueezed wavelet transform, a special kind of wavelet method, to capture the flavor and philosophy of the EMD approach. Supercomputing Technology for BDS
15
San Diego State Univ. Mar 07, 2015
Benchmark with the Three Level Parallelism The 3-Level parallelism is achieved with the fine-grain OpenMP inside all the N members in each M process. M Groups
. . .
mp_eemd()
Speedup
1D domain decomposition
mp_eemd()
ensemble decomposition
eemd()
eemd()
N
N
…
…
…
…
OpenMP OpenMP Processes Processes
Decomp in Ensemble
Supercomputing Technology for BDS
…
…
Loop decomposition
OpenMP OpenMP Processes Processes
M 2 2 4 4 25 100 100
N 1 2 2 4 4 4 16
OMP1 OMP2 OMP4 1.99 3.66 6.28 3.79 6.33 10.92 7.46 12.52 21.57 13.72 21.65 33.99 80.40 127.79 200.50 286.35 459.04 721.30 449.16 100 nodes
Multiple runs for the MRG case with 1001x1001 points and en=1000 were performed on Pleiades. Sandy processors were used; each CPU has 8 cores, and each node has 16 cores. Using 100 nodes, the MPI-OMP hybrid parallelism produces the best performance.
Decomp in Ensemble
16
San Diego State Univ. Mar 07, 2015
Four-level Parallelism in EEMD The EEMD method requires large computational resources that are linearly proportional to the number of ensemble trials. A parallel version is proposed to extend the 1D EEMD to multi-dimensional EEMD for multiple fields at different heights.
2D domain decomposition
ensemble decomposition
loop decomposition
“Grid-Ensemble-OpenMP” 4 levels Parallelism. Supercomputing Technology for BDS
17
San Diego State Univ. Mar 07, 2015 17
PEEMD: Scaling of 5000 Cores MRG Case, Grid:1000x1000 (400MB), Ivy Bridge Processors 4-Level Parallelization SGI MPT library is used
10000 Time (secs)
Grid DELayout I J 5 6 10 10 10 10 20 20 20 20 25 40 25 20 25 25 25 25 50 50
1000
100 10
100
1000
Total processors used
Supercomputing Technology for BDS
Ens OMP Total 2 60 2 200 4 400 2 800 4 1600 2 2000 2 2 2000 4 2500 4 2 5000 2 5000
Time (secs.) 6543.56 1983.25 1021.10 531.36 289.42 231.69 251.21 200.60 129.68 123.85
Speed Up 1.0 3.3 6.4 12.3 22.6 28.2 26.0 32.6 50.4 52.8
Parallel efficiency: 2000 cores, 28.2/(2000/60)=84.6% 5000 cores, 52.8/(5000/60)=63.4% 18
San Diego State Univ. Mar 07, 2015
Decompositions of an MRG wave with the PEEMD Analytical Solutions
U’
WWB
Total
IMFs IMF6
IMF9
(an oscillatory mode)
(a trend mode)
Supercomputing Technology for BDS
19
San Diego State Univ. Mar 07, 2015
Correlation Plots
Supercomputing Technology for BDS
20
San Diego State Univ. Mar 07, 2015
Ensemble Empirical Mode Decomposition (EEMD) Implementations • R Implementation – Designed for education & experimentation purposes (prototyping release) – Easier to use – Easier to setup – More Portable – 10 files with 1155 lines (with four test cases)
• FORTRAN Implementation – – – – –
Designed for research purposes (production release) Fast, Scalable 250x faster than R implementation (using the MRG case with 101x101 grid points) Used in PEEMD 52 files with 5497 lines (including four standard tests)
Supercomputing Technology for BDS
21
San Diego State Univ. Mar 07, 2015
Summary data transfer
Big Data Global Multiscale Modeling
Big Science Supercomputing & Visualization
Satellite Data
Butterflies
Multiscale Analysis
Predictability
Scalable framework for global EMD, ensemble EMD
Parallel Ensemble Empirical ensemble Mode Decomposition (PEEMD) and, multi-dimensional EMD Supercomputing Technology for BDS
22
San Diego State Univ. Mar 07, 2015
Butterfly Effect vs. Multiscale Processes • Lorenz’s studies suggested finite predictability and nonlinearity as the source of chaos. • Increased degree of nonlinearity (e.g., multiscale interactions) can stabilize solutions and thus improve simulations (Shen, 2014a,b; 2015). r=25
Lorenz Model
High-order Lorenz Model
Lorenz (1963)
Shen, B.-W., 2014a
Negative Nonlinear Feedback
Shen, B.-W., 2014a: Nonlinear Feedback in a Five-dimensional Lorenz Model. J. of Atmos. Sci. 71, 1701–1723. doi: http://dx.doi.org/10.1175/JAS-D-13-0223.1 Shen, B.-W., 2014b: On the Nonlinear Feedback Loop and Energy Cycle of the Non-dissipative Lorenz Model. Nonlin. Processes Geophys. Discuss., 1, 519-541, 2014. www.nonlin-processes-geophys-discuss.net/1/519/2014/ Shen, B.-W., 2015: Nonlinear Feedback in a Six-dimensional Lorenz Model. Impact of an Additional Heating Term. (submitted to Nonlin. Processes Geophys; accepted as a discussion paper, March 2, 2015) Supercomputing Technology for BDS
23
San Diego State Univ. Mar 07, 2015


![([PDF]) Data Analytics: Master The Techniques For Data Science, Big ...](https://m.moam.info/img/260x300/pdf-data-analytics-master-the-techniques-for-data-_64784819097c474c228cf5ea.jpg)
![([PDF]) Data Analytics: Master The Techniques For Data Science, Big ...](https://m.moam.info/img/260x300/pdf-data-analytics-master-the-techniques-for-data-_64785933097c474c228d0962.jpg)