Advances in Terrain Augmented Geometric Pairing Algorithms for Operational Test SUBMITTED FOR
MODELING AND SIMULATION WORKSHOP DECEMBER 12-15, 2005, LAS CRUCES, NM by Wolfgang Baer Associate Professor Department of Information Science, Code IS, Naval Postgraduate School, Monterey, CA 93943;
[email protected]; Tel 831-656-2209. Nikolaus Baer Nascent Systems Inc. ,380 W. Carmel Valley Rd. Carmel Valley Ca 93924;
[email protected]; Tel/Fax 831- 6590432 Wm. D. Powell Transformation Technology Directorate, USAOTC, 91012 Station Avenue, Fort Hood, TX 76544-5068;
[email protected]; Tel 254-288-9977. Mr. James Zografos DYNCORP c/o TESCO, Building 94020,West Fort Hood, Texas 76544;
[email protected]
Abstract Geometric paring (GP)systems are being developed by AOTC Ft. Hood to augment or replace laser-pairing instrumentation for long-range and unconventional weapon tests. Such systems require terrain-augmentation to rapidly calculate accurate line-of-sight (LOS) algorithm accommodating vegetation and obscurants and non linear trajectory prediction through complex near earth terrain. At one meter resolution, both vegetation types and terrain elevation uncertainty complicate the LOS calculations. We will present advances in statistical LOS algorithm for calculating LOS probabilities, which accounts for elevation measurement errors and a varying vegetation density along the LOS path. The use of PVNT deterministic partial visibility calculations is presented as low cost algorithm test methodology. Then the results of several accuracy vs. speed studies using this method are presented. In addition requirement for small, rugged, lightweight equipment capable of being unobtrusively carried by dismounted infantry has generated the necessity to develop wide-area, 1-meter resolution, compact terrain database formats and LOS algorithms suitable for execution in small commercially available hand held devices. We will describe a Heirarchical LOS culling technique designed to increase the speed of LOS calculations suitable for execution in small devices. Keywords: line-of-sight, geometric pairing, terrain database, battlefield digitization, elevation uncertainty Topic area: 3) High Performance Computing in T&E or 6) M&S Tools
Form Approved OMB No. 0704-0188
Report Documentation Page
Public reporting burden for the collection of information is estimated to average 1 hour per response, including the time for reviewing instructions, searching existing data sources, gathering and maintaining the data needed, and completing and reviewing the collection of information. Send comments regarding this burden estimate or any other aspect of this collection of information, including suggestions for reducing this burden, to Washington Headquarters Services, Directorate for Information Operations and Reports, 1215 Jefferson Davis Highway, Suite 1204, Arlington VA 22202-4302. Respondents should be aware that notwithstanding any other provision of law, no person shall be subject to a penalty for failing to comply with a collection of information if it does not display a currently valid OMB control number.
1. REPORT DATE
3. DATES COVERED 2. REPORT TYPE
DEC 2005
00-00-2005 to 00-00-2005
4. TITLE AND SUBTITLE
5a. CONTRACT NUMBER
Advances in Terrain Augmented Geometric Pairing Algorithms for Operational Test
5b. GRANT NUMBER 5c. PROGRAM ELEMENT NUMBER
6. AUTHOR(S)
5d. PROJECT NUMBER 5e. TASK NUMBER 5f. WORK UNIT NUMBER
7. PERFORMING ORGANIZATION NAME(S) AND ADDRESS(ES)
Naval Postgraduate School,Department of Information Science,Code IS,Monterey,CA,93943 9. SPONSORING/MONITORING AGENCY NAME(S) AND ADDRESS(ES)
8. PERFORMING ORGANIZATION REPORT NUMBER
10. SPONSOR/MONITOR’S ACRONYM(S) 11. SPONSOR/MONITOR’S REPORT NUMBER(S)
12. DISTRIBUTION/AVAILABILITY STATEMENT
Approved for public release; distribution unlimited 13. SUPPLEMENTARY NOTES
Modeling and Simulation Conference, 2005 Dec 12-15, Las Cruces, NM 14. ABSTRACT
Geometric paring (GP)systems are being developed by AOTC Ft. Hood to augment or replace laser-pairing instrumentation for long-range and unconventional weapon tests. Such systems require terrain-augmentation to rapidly calculate accurate line-of-sight (LOS) algorithm accommodating vegetation and obscurants and non linear trajectory prediction through complex near earth terrain. At one meter resolution, both vegetation types and terrain elevation uncertainty complicate the LOS calculations. We will present advances in statistical LOS algorithm for calculating LOS probabilities, which accounts for elevation measurement errors and a varying vegetation density along the LOS path. The use of PVNT deterministic partial visibility calculations is presented as low cost algorithm test methodology. Then the results of several accuracy vs. speed studies using this method are presented. In addition requirement for small, rugged, lightweight equipment capable of being unobtrusively carried by dismounted infantry has generated the necessity to develop wide-area, 1-meter resolution, compact terrain database formats and LOS algorithms suitable for execution in small commercially available hand held devices. We will describe a Heirarchical LOS culling technique designed to increase the speed of LOS calculations suitable for execution in small devices. 15. SUBJECT TERMS 16. SECURITY CLASSIFICATION OF: a. REPORT
b. ABSTRACT
c. THIS PAGE
unclassified
unclassified
unclassified
17. LIMITATION OF ABSTRACT
18. NUMBER OF PAGES
Same as Report (SAR)
16
19a. NAME OF RESPONSIBLE PERSON
1. Introduction The Mobile Automated Instrumentation Suit (MAIS)1 is an advanced instrumentation system that supports the testing of U.S. Army weapon systems and tactical doctrine. MAIS provides a realistic battlefield environment for simulated force-on-force engagements, real-time casualty assessment (RTCA), and reconstruction of events for posttest analysis. RTCA requires knowledge of who shoots at whom, that is, pairing. Substituting laser pulses for bullets and equipping engagement participants with pulse detectors performed traditional pairing, as shown in figure 1. Though laser-pairing systems have served the operational test community well for decades, problems in maintenance, accuracy, safety, mismatch in obscurant specific bulletversus-pulse propagation characteristics, and its inability to characterize smart and guided weapons systems have lead to the investigation of alternatives. One such alternative is the Geo-Pairing (GP) system being developed at USAOTC at Ft. Hood Tx. GP systems use global positioning system (GPS) position and pointing sensors as input in order to calculate weapon-firing trajectories. . Their potential advantages include low maintenance, no radiation hazard, potentially higher accuracy, and the possibility of including advanced capabilities in the pairing algorithms. Examples of capabilities that could be included are detection algorithms and ordinance-specific obscurant calculations. In short GP enables the MAIS to overcome most of the limitations of laser pairing, that is,
engaging a target through smoke, rain, fog, and foliage and at longer ranges than are safe with a laser. In order to fully realize the potential of a GP system, knowledge of the terrain must be included in the calculations. Without terrain knowledge, a trajectory calculated only from a shooter’s position and pointing angles would penetrate through all obstacles in the path. This would make the system useless. Terrain knowledge at a level of fidelity commensurate with the weapons system effects is, therefore, required to calculate a realistic trajectory on an actual battlefield. Such trajectories apply to the path of the projectiles as well as to the path of photons used in sensing devices to facilitate detection, aim, and fire operations. The latter is referred to as the LOS problem, and literature describing the Department of Defense standards and algorithms are available.3, 4 The theory of LOS calculations in terrain when terrain elevation and obscuring material is taken into account was presented at the 2003 ITEA Symposium, in, Lihue, Kauai, Hi. Methods were presented for calculating LOS probabilities when, in addition to elevation, the terrain is characterized by vegetation height (vgh), vegetation identification (vid), and an undercut index (uci) The uci specifies the height of a clear area under tree branches or overhangs through which visual signals can propagate. The geometric definition of these parameters are shown in the lower left of figure 4. The remaining vegetation identification parameter applies to
the 1sq. m element encountered on the top of the ground material or bottom of the sky. Databases containing the four parameters have so far bee been built in five locations shown on the map insert of Figure 4. These database were built by the Perspective View Nascent technologies (PVNT) described in the sister paper presented at this conference. PVNT is a low cost PC based systems designed to address the generation and utilization of 1 meter resolution terrain in large area tactical battlefield simulations. The Naval Postgraduate School, TRADOC, OTC Ft. Hood and Nascent Systems Inc have developed the package as a research project. It’s major advantages are that it runs on a Laptop PC, contains an extremely efficient ray trace algorithm, performs real time rendering, handles complex surface features for low angle oblique views, and is freely available to DOD users. It should be pointed out that even with tools available and/or being developed the construction of metrically accurate databases at the one-meter resolution level over such large geographic areas is an expensive undertaking that has generally been funded only for the parameters actually required for specific operational tests. Hence not all parameters are accurately available for all areas. Inclusion of vegetation layer and underlayment penetration probabilities7 required for probabilistic LOS are ongoing efforts and parameters for additional regions will be recorded as funding constraints permits. The Probabilistic LOS algorithms have been implemented in a PC104 based terrain server and tested at Ft. Hood when deployed on vehicles and tanks. The timing constraints of the MAIS system requires that an LOS calculation be performed in less than 10 millisecond including request message and response message overhead. Additionally the required geographic areas over which such systems are expected to operate have been expanded to include air-to-ground and long range smart/guided weapons systems. On top of that the host system in which such LOS algorithms operate should be reduced in size in order to allow dismounted infantry to be instrumented without excessive weight burdens. This has lead to the development of new LOS algorithms, which utilize smaller memories, execute faster, and address larger geographic areas than previously possible. The remainder of this paper presents the design and implementation details of these new LOS algorithms capable of supporting the Terrain Augmaneted Geometric Pairing mission.
2. LOS Algorithm in Uncertain Terrain The theory and mathematical formulation of the basic LOS algorithm capable of handling multiple vegetation layers in uncertain terrain was presented5 at the Test&Evaluation of Advanced Technology Systems Conference , Nov. 17-21, 2003, Lihue, Kauai, Hi. This section will summarize the algorithm and present some test results methodologies. Presented results will provide the rational for a next generation hierarchical design intended to minimize the execution speed requirements and allow the algorithm to run over large areas in order to make it suitable for long range engagements encountered in modern weapons testing. 2.1) Basic LOS Probability Algorithm: The geometry of the situation is exemplified in figure 5. Here, the terrain correlation cell is divided into smaller steps of size ∆s, and the ray is slanted. At each step, the composition of the terrain layers changes. Hence, the penetration probability through the cell is no longer horizontally homogeneous. If there were no terrain error, the ray would enter the correlation cell at 101 meters, travel through two steps of vegetation, and hit solid ground in the third step at elevation 99 meters. The penetration probability, Pp(t ,s), of penetrating to step s from the observer in the correlation cell t is the product of the individual penetration probability through each step.
z – zt F(z(t),zt(t), σt (t))
P(z(t), zt(t), σt(t))
z
+2
103
+1
102
0
101
-1
100
-2
99
-3
98
-4
97
Fig 5 - LOS Probability Through a Three-Step Correlation Cell With a Slanted Ray
Formatted
Formatted
zt vgh zr
Formatted
Formatted
Formatted
The most useful form for our algorithm is the recursive form; hence, the final expression of the LOS probability is given in terms of calculation step size as: Eq. 1-
Losp(s) = Losp((int) s * ∆s / ∆t)
∫
+∞
* P(z(t), zt(t), σt(t)) * 2 -∞
-Σ∆S / cos(el) * S1/2(e(s), n(s), zr(s) - e)
* de
where: e = the terrain error equal to z - zt s = length in step sizes from viewer to target ∆s = step size inside the correlation cell t = correlation cell distance from viewer to target ∆t = size of a terrain correlation cell Cos(el) = the cosine of the elevation angle zt(t) = elevation of terrain as a function of terrain correlation cells σt(t)= error of terrain as a function of terrain correlation cells S1/2(e(s), n(s), zr(s) = the half penetration distance as a function of easting e(s), northing n(s), and ray altitude zr(s) Σ = the sum to be carried out from the first step in the correlation cell s = t * ∆t / ∆s to the step s inside the correlation cell
2.1.1 Algorithmic Explanation To help visualize the algorithm being described lets look again at the diagram of the basic LOS problem shown in figure 5. The center dark line is the nominal ground value. The colored bands are error bound bins each of which corresponds to a probability that the terrain error is within the bin. P P P P P Error Pc PP P c P P P P probabilit 0 c c P y 0 .5 1 0 0 0 .02 0 0 0 0 0 1 2 0 0 0 .09 3 0 0 .5 . 4 .2 1 . . 5 5 0 .22 5 5 . .5 1 5 1 .5 5 1 .29 1 1 1 1 1 1 1 1 .22 1 .09 Figure 6 – Probabilistic Algorithms Picture
The algorithm has calculated the probability of the ray reaching the left side of this terrain correlation bin. Lets say this is LOS_T = .75. In the first step the ray is three bins high. In order for the ray to be stopped the terrain must have a + 3 bin error. If this were the case the ray would actually go through a vegetation layer with a step penetration probability of .5. The mask shown as a transparent rectangle shows the probability values for penetrating this step. All are 1 except the top hence the probability of penetrating this far is the mask multiplied by the terrain error probability added together. This is.5*.02+ 09+.22+.29+.22+.09 = .92. We then multiply this by the probability of entering the terrain correlation area to get the line of sight probability for penetrating all the way through step 1. Next the second step is taken. The ray is lower and the left side rectangle shows the step penetration mask. Since the ray is lower the terrain errors above +1 bin would make the ray invisible hence the two upper bins get zeros. The cumulative probability (PC) of penetrating through the second step is shown on the right rectangle and is simply a multiplication of the current penetration probability with the previous cumulative probability. The third step the ray is one bin above the nominal vegetation layer. If a terrain error of one bin is made the penetration probability is .5. If the error is higher the probability is 0. Hence the cumulative probability lowers the .5 by one bin. The fourth step the ray is still in the same bin. Now the penetration probability of .5 if a plus one bin error is made is multiplied with the previous cumulative probability to get a .25 for this bin. The last bin the ray has moved down to the vegetation layer. Hence the step penetration probability mask has moved the .5 down to this bin. If no errors are made in the nominal terrain altitude then the ray will have a 50% chance of getting through this step. The cumulative probability of getting through is zero unless either no error or a negative error is made in the terrain. The probability of getting through the five steps is .5*.29+.22+.09 = .455. The ray is partial blocked in the last step. If the terrain had fallen here then the Pp mask would have ones in the higher bins and the ray penetration probability would remain identical to the previous bin. It can be seen that the penetration probability is determined by the highest obstruction the ray passes over. Probabilities between terrain correlation areas are AND’d hence if LOS_T was .75 to get to the left side of the probability of going through all the way to the right is .455*.75 = .34125. 2.2) Algorithm Characteristics Implementing Basic LOS Probability Algorithm requires the definition of the variables defined in table 2-1. Shown are the program variables in the first column, the definition in the second column, and the mathematical symbol from equation 1 in the last column. We are assuming a four layer terrain includes sky, vegetation, under cut , and bare earth. The height of these layers are defined in the database for each 1 meter element the penetration value applied are input variables set at runtime.
S_HALF Vegetation penetration half distance(m) S1/2(e(s), n(s), zr(s) U_HALF Vegetation undercut half distance(m) S1/2(e(s), n(s), zr(s) T_SIGMA Terrain sigma error value σt(t) DELTA_T Terrain correlation cell length(m) ∆t DELTA_Z Size of terrain elevation bins , vertical resolution Not def. PROBABILISTIC-EXIT – Stop calculation when Probability is less than this value Not def. Table 2-1 Main LOS Probability Algorithm Parameters Though many tests were performed to characterize the algorithms with changes in input values the two most significant are the terrain sigma error value and the vertical resolution of the probability function (see P(z(t), zt(t), σt(t))in figure 5). The significance of the terrain error can best demonstrated using a high-resolution terrain simulator PVNT, as a low cost alternative to field trials which should be of special interest to the test community.
2.2) PVNT Partial Visibility Vs. Probabilistic LOS Test The PVNT program generates line of sight values based upon a deterministic ray trace algorithm. The default places a 2x2meter rectangle centered at the target point and calculated the fractional visibility of the rectangle from the view point. The fractional visibility is defined as the fraction of the rectangle visible divided by the total area. In practice the ration of visible to total pixels in the view is used. The fractional visibility for a set of reference test points calculate in PVNT are listed in table 3-1 below. Also shown are the perspective view to the target rectangle from the view point. Four test points are from a helicopter position at point_21 (elevation 362m) while two more are from helicopter position at point_22(elevation 321m). The points were chosen because the target rectangles were close to obscuration and hence represent border line visibility cases which are of most interest. Easting and northing coordinates are shown in the screen print out above while parameters are shown in the box on the right. The terrain Sigma value was varied from 1 meter to 10 meters to show the effect of terrain error on probability calculations. In order to get a better feel for the meaning of the probabilities we
From Point 21 To Point 8
T_SIGMA= 1;
T_SIGMA= 2;
T_SIGMA= 3;
T_SIGMA= 5;
T_SIGMA= 10;
U 362.0
U 362.0
U 362.0
U 362.0
U 362.0
L 0.996
L 0.748
L 0.674
L 0.438
L 0.362
L 0.995
L 0.827
L 0.744
L 0.539
L 0.273
L 0.640
L 0.382
L 0.314
L 0.214
L 0.125
L 0.110
L 0.112
L 0.183
L 0.153
L 0.091
U 321.0
U 321.0
U 321.0
U 321.0
U 321.0
L 0.007
L 0.010
L 0.010
L 0.010
L 0.011
L 0.98
L 0.555
L 0.351
L 0.130
L 0.033
PVNT Vis. 93.75
From Point 21 To point 9 PVNT Vis. 84.38
From Point 21 To Point 14 PVNT Vis. 42.19
From Point 21 To Point 16 PVNT Vis. 23.44
From Point 22 To Point 3 PVNT Vis. 0.0
From Point 22 To Point 10 PVNT Vis. 76.56
Table 2-2 PVNT Fractional Visibility Vs. Probabilistic LOS for Various Terrain error sigma values
placed these values along side the perspective views of the target rectangles as seen from the viewpoints. These are shown in table 2-2. The right column shows the fractional visibility and the perspective. At the center of each view is a red target rectangle. This can be partially obscured by intervening terrain. Comparing the fractional with the probabilistic calculations one can notice the expected trends. At low terrain sigma the visible points in general are very visible with probabilities close to one. As the terrain becomes uncertain the probable visibility decreases since there is a high likelihood that some terrain point is high enough to be in the way. For grazing point cases such as point_16 the fraction of the target visible is 23% if the terrain is perfect as modeled in the database. The center point of the target is below the intervening trees and is not visible. Hence at 1 sigma error it is very likely that the center point is obscured and the calculated probability of visibility is 11%. As the terrain becomes more uncertain the probability increases that the center point is visible. Hence at 3 sigma the we get 18% closely matching the fractional visibility. At 10 sigma however the probability that some intervening terrain feature causes a blockage rises and the LOS probability moves toward zero. The trend for probabilistic LOS to go to zero when terrain sigma gets large is due to the statistical mathematics. Some terrain element will statistically stick up and block the view. Though correct algorithmically it is counterintuitive. As the terrain becomes uncertain one might expect the LOS probability to approach 50%. 2.3 Speed Vs. Probabilistic Accuracy A four kilometer calculation with the main parameters shown in the last section consumed approximately 6 milliseconds. The distance and the size of terrain elevation bins or vertical resolution probability parameter DELTA_Z . In the next section we will introduce a hierarchical algorithm to reduce the run time dependence on distance. Here we note that the vertical resolution probability parameter can also be reduced to increase speed at the cost of accuracy. DELTA-Z sets the elevation integration increment for the probability numerical integration. Since this integration is performed in the inner loop decreasing the step size and reduces the run time by a proportional amount. The easiest way to trade off speed with accuracy is to change DELTA_Z. In order to get a good ground trace we need to select a ray path which is long enough to show results and along which the ray travels in a grazing direction so that reasonable values are observable. Values selected are FromE = FromN = FromZr = FromZT =
606000 3440000 320 313
toE ToN ToZr ToZt
= = = =
606400 3440400 340 343
Between these two points the ground rises gently from 313 meters at the view point to 343 meters at the target location. The target was placed 3 meters below the ground in order to show the probability calculation as the ray passes through the ground. Since
there are errors in the terrain we expect the probability for below ground rays to approach zero but not be zero immediately upon striking the earth. The following table 2-3 shows nine calculations performed from a view altitude 320 meters to terrain altitude at the target 342 meters. By raising the target from 2 meters below the ground to 1 and then 3 meters above the ground while varying DELTA Z the following measurements were found.
Relative speed ms 18 ms
Target Altitude -> DELTA_Z .5
340
343
345
.060
.598
.902
9 ms
1.0
.080
.664
.933
6 ms
1.5
.117
.749
.947
Table 2-3 LOS Probability vs Calculation Speed The execution speeds are relative and do not imply actual numbers over the 500meter distance but rather an equivalent 4km distance. Deviations in the worst case is .15 or 15% of the probability values. This is an extreme case encountered only for very small probability calculations when the ray has traveled within the nominal 1 meter terrain band. Delivered code is set to DELTA_Z=1.5. We believe this satisfies the immediate timing requirements for MAIS at adequate accuracies however clearly at longer ranges will prove inadequate. To overcome this run time restriction a new hierarchical LOS algorithm has been developed as described in the next section. .
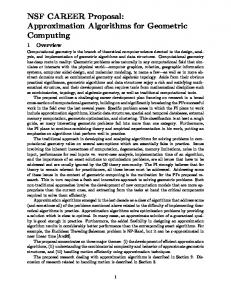
3. Hierarchical LOS Algorithm The basic LOS algorithm described in the last section is compute intensive. The longer the visibility lines between the viewer and the target the longer the compute time. Since this algorithm must execute in the 10msec time frame in order to fit into MAIS, it is important to develop techniques to minimize the distance dependence on execution time. In order to make the algorithm less sensitive to view distance we introduce a multi-resolution approach. Simply stated the LOS calculation can be done using 64 meter step sizes in order to provide a quick and approximate answer over long distances. Such a low resolution execution will identify those obscurant points along the path around which higher resolution calculations need to be performed.
LOS Ray in Space T Ground plane
V Obscuring Region LOS calculation on 64m grid
T
64 meter level
V
1 or 2 meter level
LOS calculation in 64 meter blocks
Figure 6 – Hierarchical LOS Algorithm Geometry
Implementation of the Hierarchical LOS Algorithm requires access to at least two terrain resolution databases. In our case the low resolution database consists of 64 meter posts while the high resolution post size is either 1 or 2meters on a side depending upon the configuration. The low resolution only requires 256 posts per sq. km and large areas of up to 64km easily fit into main compute memory requiring approximately 2Mbytes. However low resolution data will require several Gigabytes and will typically not fit into small machines especially hand held devices intended for use by dismounted infantry. Therefore memory management for large areas is required. 3.1) Memory Management for Large Area LOS The geographic LOS database problem is illustrated in figure 7. A pair of players labeled To(T) and From(F) are separated by a distance along which the LOS is to be calculated. In general terrain data along this distance will include a small area of high
resolution data, a larger area of low resolution data, and possibly an area for which no data is available. F L H PVDB_NORTH PVDB_NOR TH_LOW
T
MIN_NORTH UTM MIN_NORTH _UTM_LOW
PVDB_EAST_LO
MIN EAST UTM LOW
PVDB_EAST
MIN EAST UTM Figure 7 – Multi Resolution LOS Terrain Geometry The Hierarchical LOS Algorithm avoids distance dependent execution times by identifying a limited number of high resolution blocks in which the calculation is executed. The problem is that we do not F know which high resolution blocks are required. If there were no time constraint the obvious solution would be to allow the low-resolution calculation to identify the high-resolution blocks needed and retrieve them 1 from disk as required. Since it takes on the order of 2 milliseconds to retrieve data from disks this approach Visibility will not meet the timing High contours requirements. Hence some resolution T form of preloading is Blocks required. There are several algorithms, which may be used. The simplest is to load a rectangle of highFigure 8 – Multi Resolution LOS Terrain Geometry
resolution data around the target player location. The size of the rectangle can expand depending upon the amount of available memory. A better approach is to load only those blocks likely to contain an LOS ray obscurant. Figure 8 shows a hypothetical horizon contour map calculated around a potential target T. The outer line is the horizon as seen from T while the inner line surrounds a depression into which Load 64 meter data the T player cannot see. A small hilltop is also visible. Each of these visibility contour lines can be enclosed in a high-resolution Wait for Your own terrain block. All the blocks taken coordinates together then represent the total space within which LOS ray blockage is likely to occur. The actual LOS ray calculation from a Perform a visibility map calculation at viewer F to a potential target T 64m res can then only be obscured in those areas covered by the loaded blocks. Identify all blocks in So for our hypothetical the view shed area example a 64-meter LOS calculation would identify the hill(1), the ridgeline(2), and the area immediately around the Do all Cull blocks required target as potential areas in which high resolution calculation should y be performed. A block diagram for the load algorithm is shown in figure Is the next 9. The flow of logic assumes the required block in memory? algorithm is run in a thread that y waits for new self coordinates. Once triggered a low-resolution view shed calculation is made and Load the the number of blocks from the block total list of viewable blocks fitting into main memory are then loaded from the disk. Several culling Are all required y criteria can be employed. blocks in Distance from the target is the memory? simplest and most effective. The high-resolution blocks are then Figure 9 – Hierarchical LOS Load Algorithm ready for an LOS calculation when required.
The most important characteristic of the memory management scheme is its block structure. Data is not stored in large arrays but in blocks covering 256x256 meters in area. Thus a map is required to translate internal block location into easting and northing coordinates. The PVNT terrain database are already in the required block structure and resolutions from 1 to 64 are available. Interfaces are therefore built directly to the existing databases as shown in figure 10. PVNT
1 meter
LOS Server
4 meter 16 meter 64 meter
Figure 10 – Database transfer from PVNT
4. Conclusion The Basic LOS Probability Algorithm allowing calculations in uncertain terrain with multiple vegetation layers requires too much CPU time for long distance pairing. By introducing a multi resolution scheme and performing LOS ray traces at the 64 meter block size this problem can be eliminated. This makes high-resolution 1 meter terrain calculations feasible over large playing areas. In order to fit the required large amounts of high resolution data into limited memories available for dismounted applications a block structured terrain data scheme is used and only the required visible areas are loaded. This approach addresses both the high speed performance for large playing areas in limited memory hardware used by dismounted players.
References 1) GP is an enhancement project to the U.S. Army Operational Test Command’s (USAOTC's) RTCA, instrumentation system MAIS. 2) MAIS information page URL http://www.otc.army.mil/MaisInternet/index.html 3) TRAC-WSMR report (TR-95-032), “The Effects of Different Line-of-Sight Algorithms and Terrain Elevation Representations on Combat Simulations.”
4) SRD 151 Bresenham LOS Algorithm at www.amso.army.mil/standards/new-stds.htm
5) Wolfgang Baer, Todd Ross Campbell, and Bill Powell; “Accommodating Terrain Error and Vegetation Layer in a Statistical Line-of-sight Algorithm”, ITEA Symposium, Poster and Paper, “Test&Evaluation of Advanced Technology Systems”, Nov. 17-21, 2003, Lihue, Kauai, Hi. 6) Wolfgang Baer, Todd Ross Campbell, and Nikolaus Baer; “Battlefield Visualization and Database Creation System using One Meter Terrain”, MODELING AND SIMULATION WORKSHOP DECEMBER 12-15, 2005, LAS CRUCES, NM SEE HTTPS://WWW.TRAC.NPS.NAVY.MIL/PVNT/INDEX.HTML 7) Report #TRAC-WSMR-TR-02-001, TRADOC Analysis Center-White Sands Missile Range, NM 88002-5502, March 2002.
About the Authors Dr. W. Baer currently holds an Associate Research Professor position at the Naval Postgraduate School in Monterey, California, and teaches courses in networking and network programming. He is building high–speed, low-cost networked processing systems to integrate computer-intensive, real-time video realistic battlefield simulation and rapid terrain database creation problems, using office automation and Internet access tools on personal computer hardware. Department of Information Science, Code IS, Naval Postgraduate School, Monterey, CA 93943;
[email protected]; Tel 831-656-2209. Nikolaus Baer graduated from the University of California with a BS in Computer Engineering. He designs embedded circuits and builds computer based testing stations. He is involved with the extensive documentation of the PVNT system as well as the integration of PVNT onto increasingly portable cost effective platforms. Nascent Systems Inc. ,380 W. Carmel Valley Rd. Carmel Valley Ca 93924;
[email protected]; Tel/Fax 831- 6590432 Wm. D. Powell is a graduate of Cal Poly, San Luis Obispo, California. He has over 35 years of experience in operational testing and experimentation. He is currently working as an electronics engineer with U.S. Army Operational Test Command at Fort Hood, Texas. His area of interest is to protect the war fighter by providing the best possible equipment and training. Transformation Technology Directorate, USAOTC, 91012 Station Avenue, Fort Hood, TX 76544-5068;
[email protected]; Tel 254-288-9977. Mr. James Zografos Works as senior engineer for TESCo at Ft. Hood and is in charge of the Geometric Pairing Projects. DYNCORP c/o TESCO, Building 94020,West Fort Hood, Texas 76544;
[email protected] Acknowledgement : The authors wish to acknowledge the Transformation Technology Directorate, US Army Operational Test Command for funding support to develop the software and systems described herein.
Comment [sh1]: Page: 10 The information in notes 3 and 6 should be displayed in the same format.