Eos, Vol. 91, No. 41, 12 October 2010
VOLUME 91
NUMBER 41
12 OCTOBER 2010 EOS, TRANSACTIONS, AMERICAN GEOPHYSICAL UNION
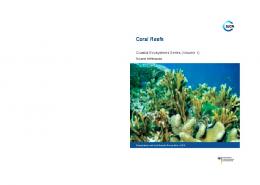
Advancing Ocean Monitoring Near Coral Reefs PAGES 369–370 Corals, the foundation of tropical marine ecosystems, exist in a symbiotic relationship with zooxanthellae (algae). The corals obtain much of their energy by consuming compounds derived from photosynthesis by these microorganisms; the microorganisms, which reside in the coral tissue, in turn use waste products from the corals to sustain photosynthesis. This symbiosis is very sensitive to subtle changes in environment, such as increased ocean acidity, temperature, and light. When unduly stressed, the colorful algae are expelled from the corals, causing the corals to “bleach” and potentially die [e.g., van Oppen and Lough, 2009]. Because of the sensitivity of corals to environmental factors, bleaching events are seen as indicators of the changing state of the world’s oceans as climate warms. In 1997– 1998, a worldwide bleaching event occurred. Since then, bleaching has been observed in every ocean basin with increased frequency and severity. For example, in 2010 reefs in southeastern Asia bleached at record levels, parts of the Hawaiian archipelago have experienced mild bleaching, and current monitoring and forecasts indicate significant to severe bleaching in the Caribbean. Observing the physical properties of ocean waters around coral reefs provides important insights for linking environmental changes to such biological consequences. Remotely sensed data are particularly valuable, providing broad spatial coverage in a timely fashion to inform actions by reef managers. However, there remain significant gaps in monitoring capability and scientific understanding of coral ecosystem responses to changes in the physical environment. Enhanced monitoring of relevant physical processes will be essential to reef management if the current trend of a warming
BY S. F. HERON, C. R. STEINBERG, M. L. HERON, A. MANTOVANELLI, J. B. D. JAFFRÉS, W. J. SKIRVING, F. MCALLISTER, P. RIGBY, D. WISDOM, AND S. BAINBRIDGE
climate continues. Established around a half century ago, the Heron Island and One Tree Island research stations in Australia’s Great Barrier Reef are internationally renowned facilities for coral reef research. Heron Island is also one of only four Centres of Excellence in the global Coral Reef Targeted Research and Capacity Building for Management program, a project of the World Bank’s Global Environment Facility. Studies at these stations combined with better characterization of the ocean properties around the reef will lead to a greater understanding of links between oceanography and ecosystem response that can inform science and management on reefs worldwide.
PAGES 369–380 Collaborations in Monitoring the Great Barrier Reef The volume of biological and ecological research undertaken in the southern Great Barrier Reef, Australia, and recent occurrences of bleaching (1998, 2002, 2004, and 2006) identify it as a prime location for targeted research into coral bleaching. The region also experiences physical and chemical influences of shelf and deep-ocean processes (e.g., tidal and major boundary currents, upwelling, and internal waves), which may be significantly altered by increased available energy due to climate change [Steinberg, 2007]. Recognizing that coral bleaching is a worldwide problem, an international collaborative study of oceanographic processes in this region was established in 2005 as part of a broader program maintained by several Australian universities, the Australian
Fig. 1. Snapshot of ocean surface radar currents at 0150 UTC, 6 May 2010, overlaid on a sea surface temperature (SST) composite for 5–6 May 2010. Currents (arrows) are generated at 4-kilometer resolution from a pair of high-frequency ground wave radars (yellow triangles); vectors are shown at a reduced sampling of 8 kilometers for clarity. Beige squares indicate mooring positions; green dots show positions of a biannual conductivity-temperature-depth transect across the shelf and slope. Two drifter tracks (pink) are shown for the week ending 6 May 2010 (the final location for each is marked with a white diamond).
Eos, Vol. 91, No. 41, 12 October 2010 Research Council (ARC), the Queensland state government, the Australian Institute of the Marine Science (AIMS), and the U.S. National Oceanic and Atmospheric Administration (NOAA). The study is enhanced by the recent expansion of capacity in this location by the Great Barrier Reef Ocean Observing System (GBROOS) node of the Australian Integrated Marine Observing System (IMOS). IMOS is a distributed infrastructure for the collection and free, timely delivery of data from the coastal and bluewater regions around Australia. Through GBROOS, several observing systems have been deployed in the southern Great Barrier Reef (Figures 1 and 2a) to monitor physical processes that influence ocean temperature, with all data publicly available through the IMOS ocean portal. These installations encompass the spatial scales relevant to coral reefs, from the small scale within individual reef lagoons and the exposed edges of reefs, to the broader scale of interstitial water on the continental shelf and deeper water at the shelf edge, to the synoptic scale of oceanic thermal anomalies. As such, they allow researchers to observe the influence of multiple processes in this region and translate findings to sites across the globe.
Satellite Monitoring Warm sea surface temperature (SST) anomalies during summer have long been linked to coral bleaching events; more recently, the influence of light has also been implicated in bleaching [van Oppen and Lough, 2009]. Satellite-derived SST is currently used in near real time, globally [Skirving et al., 2006a] and regionally [e.g., Maynard et al., 2008], to monitor patterns and accumulations of surface water thermal anomalies and thus identify ocean conditions conducive to coral bleaching [e.g., Liu et al., 2003] (see also http://www .coralreefwatch.noaa.gov) and disease outbreaks [Heron et al., 2010]. Satellite remote sensing provides spatially broad observations of SST (e.g., see Figure 1 for data from the Great Barrier Reef) and ocean color with spatial resolutions down to 1 kilometer. These data are acquired twice daily by several NOAA and NASA satellites and have been received at AIMS since 1987. Solar radiation incident at the ocean surface is also measured by satellite; however, determining how much light is transmitted through the water column to corals requires knowledge of the water column’s opacity. Quantitative ocean color products for shallow (e.g., shelf) areas continue to be developed; nonetheless, qualitative patterns provide information on mesoscale oceanic features, such as eddies, which can generate mixing, upwelling, and intrusions onto the continental shelf [Steinberg, 2007].
Water Column Properties Vertical mixing provides an efficient mechanism to redistribute surface heat through
Fig. 2. (a) Locations of oceanographic moorings (yellow squares) at the Great Barrier Reef Heron Island North (GBRHIN), Heron Island South (GBRHIS), and One Tree Island East (GBROTE). Onreef loggers (green plus signs) augment the sensor network (infrastructure is indicated by orange crosses, and sensors by purple dots). (b) Current and temperature profiles (purple arrows and red squares, respectively) from the GBROTE mooring at 1117 UTC, 13 April 2008, show the variability of these parameters with depth in the water column. Colocated surface data are from the ocean surface radar (green arrow) and satellite SST (pink square). Mooring schematic at right shows approximate placement of the acoustic Doppler current profiler (50 meters) and temperature loggers (5, 9, and 19 meters). (c) Directional pressure spectrum (in pascal-seconds, Pa-s) at 1600 UTC, 11 May 2008, from the GBRHIS mooring.Waves are predominantly from south-southeast, with two peaks evident, indicating that mixing is likely at the reefs facing this direction.
the water column, potentially mitigating thermal stress [Skirving et al., 2006b]. For the Great Barrier Reef, information on water column structure is provided by a series of moorings deployed since 2004 on the continental shelf and at the shelf edge in depths of 40–160 meters (Figures 2a and 2b). Moored instruments measure temperature, pressure (and thus depth), salinity, turbidity, dissolved oxygen, and chlorophyll fluorescence at specific depths, and also currents through the entire water column at least every 30 minutes. In addition, biannual cross-shelf transects of conductivity-temperature-depth (CTD) profiles (green dots in Figure 1) provide seasonal information on regional hydrographic conditions. These data are augmented by readings from instruments that log on-reef temperature in vertical profiles at Heron Island (to
15-meter depth) and at One Tree Island (to 10 meters) to monitor connections between the coral environment and deeper waters (Figure 2a). Sensor network infrastructure was installed across these reef flats in mid2008, allowing data from any instrument type to be transmitted via on-reef wireless networks and then broadband links to the mainland. At present, fixed transects and profiles of temperature and marine weather data are collected. These provide real-time information, particularly useful for reef users and managers during warm summer periods. Using surveys of the water column at the Great Barrier Reef, scientists are working to pinpoint exactly what changed before, during, and after coral bleaching events. Armed with information on the interactions between corals and oceanographic
Eos, Vol. 91, No. 41, 12 October 2010 processes, scientists can apply the relevant knowledge to less equipped reefs across the world.
Surface Dynamics Winds and currents invoke mixing due to frictional shear; wave-exposed edges of reefs will frequently experience vertical mixing as waves break. Currents can also advect patches of warm or cool water, respectively enhancing or mitigating thermal stress. To learn more about how surface dynamics affect reefs, a high-frequency (HF) phased-array radar system has mapped surface currents, significant wave height, wave spectra, and wind direction [Heron, 2005] over the southern Great Barrier Reef since 2007, providing near–real time coverage every 10 minutes at 4-kilometer resolution to a maximum range of 180 kilometers (Figure 1). Wave data are verified by an instrument located at the Great Barrier Reef Heron Island South (GBRHIS) mooring (Figures 2a and 2b). Additional applications of radar data include studies of physical connectivity between reef systems and Lagrangian tracking (e.g., pollutants, maritime safety). The spatial and temporal coverage of HF ocean radar also makes it possible to evaluate diffusion and dispersion hypotheses by tracking notional patches of surface water. Radar-derived particle tracks will be compared with tracks from surface drifters (Figure 1) to assess the radar performance in describing reef connectivity. In March– April 2010, ten satellite communications drifters were released across the region to investigate the surface circulation patterns on and between reef flats, continental shelf waters, and the deep ocean. Position data are transmitted from drifter-mounted Global Positioning System units every 10 minutes, eliminating the need for continuous at-sea monitoring and thereby significantly reducing the cost of field operations. Far-field deployments were made from AIMS research vessels and those in the vicinity of Heron Island from the University of Queensland’s research station.
Integrated Data and Hydrodynamic Models Because reefs are so sensitive to environmental factors, teasing out exactly what processes trigger bleaching events or what characteristics lead to improved reef health is a complicated task. While measurements on the Great Barrier Reef and elsewhere provide a window into variations of ocean properties at the surface or with depth, a four-dimensional (space-time) picture of the
ocean is needed to better understand how changes will manifest. These can be produced using hydrodynamic models, which can assimilate or be calibrated with data. The Australian Ocean Model Analysis and Prediction System (OceanMAPS) is an operational ocean forecast model of the BLUElink project [Brassington et al., 2007]. This model has an approximately 10-kilometer horizontal resolution and 10-meter vertical resolution in the surface waters in the Australian region [Oke et al., 2008]. Higher-resolution models have been nested within this model [Webster et al., 2007] to cell sizes of 30 meters in the vicinity of Heron Island, allowing high-level validation with on-reef data and providing detailed information on processes occurring around coral reefs. A near–real time model of the entire Great Barrier Reef is currently under development to allow operational applications.
The Search for Insight Through a combination of significant investment in long-term ocean-observing infrastructure and a targeted field survey program in the southern Great Barrier Reef, the influence of key physical processes that affect coral reef health, such as turbulent mixing and upwelling, is being revealed. While directly pertinent to monitoring the health of coral reefs in the region, and thus informing effective local management response and opportunistic science, this work allows the development of new tools that will have applicability to the understanding and management of coral reef ecosystems around the world.
Acknowledgments Funding and infrastructure support were provided through ARC linkage grants LP0562157 and LP0990575; the Queensland government; IMOS GBROOS (http://www .imos.org.au/gbroos.html); and the Australian government’s National Collaborative Research Infrastructure Strategy and Super Science Initiative. The manuscript contents are solely the opinions of the authors and do not constitute a statement of policy, decision, or position on behalf of NOAA or the U.S. government.
References Brassington, G. B., T. Pugh, C. Spillman, E. Schulz, H. Beggs, A. Schiller, and P. R. Oke (2007), BLUElink> Development of operational oceanography and servicing in Australia, J. Res. Pract. Inf. Technol., 39(2), 151–164.
Heron, M. L. (2005), The role of HF ocean surface radar in Australia as a long-term coastal ocean monitoring facility, in Proceedings of Coasts and Ports, 2005 [CD-ROM], Inst. of Eng., Aust., Barton, A. C. T., Australia. Heron, S. F., B. L. Willis, W. J. Skirving, C. M. Eakin, C. A. Page, and I. R. Miller (2010), Summer hot snaps and winter conditions: Modelling white syndrome outbreaks on Great Barrier Reef corals, PLoS ONE, 5(8), e12210, doi:10.1371/ journal.pone.0012210. Liu, G., A. E. Strong, and W. Skirving (2003), Remote sensing of sea surface temperatures during 2002 barrier reef coral bleaching, Eos Trans. AGU, 84(15), 137, 141. Maynard, J. A., et al. (2008), ReefTemp: An interactive monitoring system for coral bleaching using high-resolution SST and improved stress predictors, Geophys. Res. Lett., 35, L05603, doi:10.1029/2007GL032175. Oke, P. R., G. B. Brassington, D. A. Griffin, and A. Schiller (2008), The Bluelink ocean data assimilation system (BODAS), Ocean Modell., 21(1-2), 46–70, doi:10.1016/j.ocemod.2007.11.002. Skirving, W. J., A. E. Strong, G. Liu, C. Liu, F. Arzayus, J. Sapper, and E. Bayler (2006a), Extreme events and perturbations of coastal ecosystems: Sea surface temperature change and coral bleaching, in Remote Sensing of Aquatic Coastal Ecosystem Processes, edited by L. L. Richardson and E. F. LeDrew, pp. 11–26, Springer, New York. Skirving, W., M. Heron, and S. Heron (2006b), The hydrodynamics of a bleaching event: Implications for management and monitoring, in Coral Reefs and Climate Change: Science and Management, Coastal Estuarine Stud. Ser., vol. 61, edited by J. T. Phinney et al., pp. 145–161, AGU, Washington, D. C. Steinberg, C. (2007), Impacts of climate change on the physical oceanography of the Great Barrier Reef, in Climate Change and the Great Barrier Reef: A Vulnerability Assessment, edited by J. E. Johnson and P. A. Marshall, pp. 51–74, Great Barrier Reef Mar. Park Auth. and Aust. Greenhouse Off., Townsville, Queensl., Australia. van Oppen, M. J. H., and J. M. Lough (Eds.) (2009), Coral Bleaching: Patterns, Processes, Causes and Consequences, 178 pp., Springer, New York. Webster, I. T., R. Brinkman, J. S. Parslow, J. Prange, A. D. L. Stevens, and J. Waterhouse (2007), Review and gap analysis of receiving-water water quality modelling in the Great Barrier Reef, 137 pp., Commonw. Sci. and Ind. Res. Organ., Melbourne, Vict., Australia.
Author Information Scott F. Heron, Coral Reef Watch (CRW), NOAA, Townsville, Queensland, Australia; and School of Engineering and Physical Sciences, James Cook University (JCU), Townsville, Queensland, Australia; E-mail:
[email protected]; Craig R. Steinberg, AIMS, Townsville, Queensland, Australia, and AIMS@JCU, JCU; Mal L. Heron, Australian Coastal Ocean Radar Network (ACORN), Marine Geophysical Laboratory (MGL), JCU; Alessandra Mantovanelli and Jasmine B. D. Jaffrés, MGL, JCU; William J. Skirving, CRW, NOAA; and Felicity McAllister, Paul Rigby, Daniel Wisdom, and Scott Bainbridge, AIMS