Advertising on TV: Under- or Overprovision?∗ Hans Jarle Kind Norwegian School of Economics and Business Administration Bergen, Norway
[email protected]
Tore Nilssen Department of Economics University of Oslo Oslo, Norway
[email protected]
Lars Sørgard Norwegian School of Economics and Business Administration Bergen, Norway
[email protected]
19 November 2003
Abstract We consider a model where TV channels transmit advertising, and viewers dislike such commercials. We find that the less differentiated the TV channels’ programs are, the lower is the amount of advertising in equilibrium. Relative to the social optimum, there is underprovision of advertising if TV channels are sufficiently close substitutes. A dampening-of-competition merger between TV channels may improve welfare and lead to more advertising. But even after a merger there can be underprovision of advertising. A publicly owned TV channel can partly correct market distortions, in some cases by having a larger amount of advertising than a private TV channel. It may actually have advertising even in cases where it is wasteful per se. JEL classification: L82, M37 Keywords: Television industry; Advertising; Public policy; Mixed oligopoly
∗
We would like to thank the Research Council of Norway (the KIM programme) for its financial support through Institute for Research in Economics and Business Administration (SNF).
1
Introduction The welfare effects of advertising have been a longstanding issue in economics. Dixit
and Norman (1978), for instance, triggered a debate when they claimed that the market equilibrium provides an excessive amount of advertising from a social point of view (see Fisher and McGowan, 1979; Dixit and Norman, 1979; Shapiro, 1980; Dixit and Norman, 1980). However, with a few notable exceptions the existing studies do not discuss the role of media as a transmitter of advertising.1 This is a surprise, given the fact that a substantial fraction of advertising is transmitted through media firms.2 The purpose of this article is to show that the media firms’ role as transmitters of advertising is decisive for the amount of advertising that is provided. To fix ideas we consider an advertising-financed TV industry.3 It is claimed that advertising on TV is a nuisance to consumers, and for this reason Becker and Murphy (1993) provide some informal arguments that there is too much advertising on TV from the society’s point of view.4 Nonetheless, we find that competition between TV channels may lead to underprovision of advertising. Advertising-financed channels play a dominant role in the TV industry in many countries. However, this is a mixed blessing. On the one hand, TV commercials may be the most efficient way for firms to advertise their products, and can generate a surplus both for individual firms and for society as a whole. On the other hand, viewers may dislike being interrupted by commercials.5 We thus have an ambiguity 1
As noted by Bagwell (2003) in his recent survey on the economics of advertising, there is little work on the market for advertising as such. Anderson and Coate (2000) and Gabszewicz et al. (2000) are two studies that do encompass the role of the media firms in a welfare analysis of advertising (see below). 2 For example, in 2002 TV advertising in the US amounted to approximately $ 50 billion, out of a total of approximately $ 115 billion in advertising that was measured (see Advertising Age http://www.adage.com/images/random/lna03.pdf). 3 The mechanisms that we analyse are presumably present also in, say, competition between radio channels and between electronic newspapers. 4 ’And just as death, divorce, unemployment, and similar utility-reducing events often induce greater drinking, smoking, overeating, and similar changes in consumption, we believe so too do many advertisements lower utility and yet raise demand for the advertised goods. These ads produce anxiety and depression, stir up envious feelings towards the success and happiness of others, or arouse guilt towards parents or children’ (p. 962). 5 It is documented that viewers try to avoid advertising breaks, see for example Moriarty and Everett
1
that raises the question of whether there is over- or underprovision of advertising on TV, and of whether there is a need for some kind of public intervention in the sector. As for the latter question, it is noteworthy that different countries have chosen distinctly different public-policy measures towards the TV industry. For instance, some countries have publicly owned TV channels and restrictions on the amount of advertising on TV, while other countries do not intervene in the market at all.6 The TV industry is important both in terms of the time people spend watching TV and the amount of advertising it transmits.7 Nonetheless, as argued above, there are few studies of the role of advertising-financed TV. Early work focused mainly on how rivalry between TV channels affects program diversity, but advertising was not endogenized.8 There are some recent studies that model the interplay between the market for advertising and the market for TV audience in a more satisfactory way.9 As far as we know, there are only two studies that in detail study the question of whether there is over- or underprovision of advertising on TV. Anderson and Coate (2000) analyse a TV duopoly where each TV channel chooses one out of two different programs, while Gabszewicz et al. (2000) study two TV channels’ choices of program mix in a Hotelling model. In contrast to these two studies, we model a TV industry where the difference between channels, in terms of viewers’ preferences for program content, is kept exogenously fixed. This way we are able to focus on how the degree of product differentiation in the market for TV viewers affects the TV channels’ rivalry on advertising. (1994) and Danahar (1995). 6 In many European countries, there are restrictions on the average number of advertising minutes per hour. The limit is 6 minutes per hour in France, 7 minutes in the United Kingdom, and 9 minutes in Germany (see Motta and Polo, 1997). In the US, the National Association of Broadcasters once set an upper limit. In 1981, this was found to violate antitrust laws (see Owen and Wildman, 1992, ch. 5, and Hull, 1990). No restrictions (except for advertising on children’s programs) exist in the US today. 7 In 1999 the average adult in the US spent approximately four hours a day watching TV (see Anderson and Coate, 2000). 8 The seminal work is Steiner (1952). For a review of the early literature, see Owen and Wildman (1992). 9 See Anderson and Coate (2000), Gabszewicz, et al. (2000), Barros, et al. (2002), Gal-Or and Dukes (2003), Dukes and Gal-Or (2003), and Nilssen and Sørgard (2003).
2
We consider a TV industry with two TV channels, both financed by advertising revenues. Producers spur the sales of their products by advertising on TV. Consumers like watching programs on TV, but they dislike advertising. We find that the less differentiated the TV channels are, the less advertising occurs in equilibrium. To understand this, note that a TV channel with few commercials is more attractive for consumers who dislike advertising than a channel with many commercials, other things equal. TV channels that compete to attract viewers will therefore be forced to have less advertising the closer substitutes their program contents are perceived to be. We find that there is too little advertising from a social point of view if the TV channels offer programs that are sufficiently close substitutes. This implies that even in a model where media firms act as transmitters of advertising there might be underprovision of commercials. This is a surprise, since advertising is typically a nuisance to viewers. But the driving force for our result is, as explained, the competition between TV channels. Note that in earlier studies - such as Dixit and Norman (1978) and Becker and Murphy (1993) the role of the media firms as transmitters of advertising was not taken into account. This suggests that by ignoring the role of the media one might predict overprovision in some cases where in fact there would be underprovision. The potential for underprovision of advertising suggests that restrictions on the amount of advertising, the policy measure chosen in many European countries, can be misguided. In particular, this is likely to be true if the TV channels are close substitutes. In such a case, it may be welfare improving to permit an anticompetitive merger, because this will lead to an increase in the level of advertising and higher welfare. In many European countries there are mixed oligopolies with both publicly and privately owned TV channels.10 The government can partly correct for the distortions in the market for advertising by having a public TV channel compete with a privately owned TV channel. We show that, for sufficiently differentiated TV channels, the 10
See Motta and Polo (1997) for a survey of the media industry in Europe.
3
public TV channel sells less advertising space than the private channel, thereby partly correcting for the overprovision of advertisements in a system with only privately owned TV channels. Conversely, the public TV channel advertises more than the private one if the TV channels are sufficiently close substitutes. In fact, we find that a welfare maximizing public TV channel advertises even in some cases where advertising is per se wasteful (i.e., where the disutility of viewers exceeds the surplus that the advertising generates for the producers). This article is organized as follows. The formal model is presented in the next section, and in Section 3 we derive the equilibrium outcomes. In Section 4 we find social optimum, and in Section 5 we compare market equilibrium and social optimum. In Section 6 we analyze the consequences of having a welfare maximizing TV channel that is owned by the public sector, and we offer some concluding remarks in Section 7.
2
The model
There are two TV stations, channel 1 and channel 2, and a continuum of 1 identical viewers. Denote by Vi the time that each viewer spends watching TV programs on channel i = 1, 2, and let the utility function be given by 1 U = V1 + V2 − 1+b
µ
¶ V12 V22 + + bV1 V2 . 2 2
(1)
The parameter b ∈ [0, 1) is a measure of product differentiation: The higher the value of b, the closer substitutes are the two TV channels from the viewers’ point of view. As will be clear below, our formulation ensures that the parameter b only captures product differentiation and has no effect on market size. Note that we may interpret Vi both as the time that each viewer spends watching channel i and as the number of viewers, since we have normalized the population size to 1. We consider TV channels that are financed by advertising and that can be watched free of charge. However, consumers have a disutility of being interrupted by commer4
cials. To capture this, we assume that the viewers’ subjective cost of watching channel i is Ci = γAi Vi , where Ai is the level of advertising per time unit Vi and γ > 0 is a parameter that measures the consumers’ disutility of being interrupted by commercials. A viewer’s consumer surplus is thus given by
CS = U − γ(A1 V1 + A2 V2 ). Setting ∂CS/∂Vi = 0, we find that optimal viewer behavior implies
Vi = 1 − γ
Ai − bAj . 1−b
(2)
Defining V ≡ V1 + V2 and A ≡ A1 + A2 , we see from equation (2) that V = 2 − γA.
(3)
The total time the viewers spend watching the two TV channels is thus strictly decreasing in the aggregate advertising level and the viewers’ marginal disutility of commercials. Equation (3) further makes it clear that the size of the market - measured in terms of TV viewers or time spent watching TV programs - is independent of b for any given level of total advertising A. TV channel i charges the price Ri per advertising slot. The direct cost of inserting an advertising slot is set equal to zero, so that the profit level of channel i is
Πi = Ri Ai .
(4)
Let Aik denote producer k’s advertising level on channel i. We assume that the marginal gain for the firm from advertising is proportional to the number of viewers of the commercials. This implies that the net gain for producer k from advertising on TV equals π k = (A1k V1 + A2k V2 ) − (A1k R1 + A2k R2 ) . 5
(5)
With a slight abuse of terminology, we label π k the profit of producer k. There are n P identical producers, and we let π A ≡ nk=1 π k denote aggregate profit for these firms. We consider the following two-stage game:
Stage 1: TV channels set advertising levels. Stage 2: Advertisers choose amounts of advertising to buy. One noteworthy feature of our set-up is that the TV channels are quantity setters in advertising.11 If program choice on TV is inflexible in the short run - with a given amount of time between each program - such an assumption is plausible. However, there might be arguments indicating that TV channels are more flexible concerning the amount of advertising.12 If so, price setting on advertising is a more natural choice. It can be shown that our main results still hold if we assume price rather than quantity setting among TV channels.13 Unless otherwise stated, we assume that the TV channels act non-cooperatively.
3
Equilibrium outcomes
We solve the game by backward induction. At stage 2 the advertisers simultaneously determine how much to advertise on the two channels, taking advertising prices as given. Solving ∂π k /∂A1k = ∂π k /∂A2k = 0 simultaneously for the k producers, and P then using that Ai = nk=1 Aik , we find that demand for advertising equals 1 Ai = γ
µ
n n+1
¶· ¸ Ri + Rj b 1− , 1+b
11
i = 1, 2.
(6)
Our set-up is analogous to models of successive oligopoly, such as Salinger (1988), where producers and retailers set quantities sequentially. 12 When transmitting newscasts or sport events the TV channel is quite flexible in its choice of the amount of advertising. Moreover, to accommodate a small amount of advertising a TV channel can fill in with advertising for its own programs (’tune-ins’). For details concerning tune-ins, see Schachar and Anand (1998). 13 Barros et al. (2002) formulate a model where media firms set prices of advertising rather than quantities. The equilibrium outcomes they find are analogous to the ones we report here. For a more detailed discussion of price versus quantity competition in the market for TV advertising, see Nilssen and Sørgard (2003).
6
As expected, we thus have a downward-sloping demand curve for advertising (∂Ai /∂Ri < 0). More interestingly, we see that demand for advertising on each channel is decreasing also in the other channel’s advertising price (∂Ai /∂Rj < 0). This follows from the fact that advertising on the two channels are complementary goods if the consumers dislike being interrupted by commercials (γ > 0). To see why, suppose that Rj increases. Then the advertising level on channel j falls. Consequently, this channel becomes more attractive for the viewers, while channel i becomes relatively less attractive. The latter in turn means that channel i will have a smaller audience, which translates into a lower demand for advertising. Using (6) we can write the inverse aggregate demand for advertising on channel i as Ri = 1 − γ
µ
n+1 n
¶µ
¶ Ai − Aj b . 1−b
(7)
Note that Ai − Aj ∂Ri = −γ (n + 1) . ∂b n (1 − b)2 This means that the willingness to pay for advertising on channel i is increasing in b if and only if the advertising level on that channel is lower than on the other channel (Ai < Aj ). This reflects the fact that the less differentiated the TV stations, the more prone are consumers to shift from a channel with much advertising to a channel with little advertising. The TV channels set their advertising levels non-cooperatively at stage 1. (For collusion, see below.) Solving ∂Πi /∂Ai = 0, i = 1, 2, subject to (7) we find the equilibrium advertising level equals (with superscript M for market equilibrium):
AM i
1 = γ
µ
n n+1
¶µ
¶ 1−b . 2−b
(8)
The advertising level is thus decreasing in the viewer disutility of advertisements (γ),
7
which is quite natural (see also Anderson and Coate (2000)). We further see that ∂AM 1 i =− ∂b γ
µ
n n+1
¶µ
1 2−b
¶2
< 0,
which means that the equilibrium advertising level is lower the less differentiated the TV channels are. To understand this result, note that a TV channel attracts viewers by having a limited amount of advertising. The better substitutes the viewers perceive the two TV channels to be, the more sensitive they are to differences in levels of advertising. A high b thus gives each TV channel an incentive to set a relatively low advertising level in order to capture viewers from the other channel. Note also that 1−b ∂AM i = > 0. ∂n (n + 1)2 γ (2 − b)
(9)
The larger the number of advertisers, the less market power they will have relative to the TV channels. An increase in the number of advertisers thus increases the demand for advertising. It is then optimal for the TV channels to offer more advertising space. We thus have Proposition 1 Non-cooperative equilibrium levels of advertising on TV are smaller (i) the less differentiated the TV channels’ programs are perceived to be; (ii) the higher the viewers’ disutility of advertising; and (iii) the lower the number of advertisers. Inserting for AM i in (8) into the expressions for profit in (4) and (5), we find the equilibrium profit levels of TV stations and advertisers:
ΠM i
1 = γ
µ
n n+1
1−b 2 1 (1 − b)2 M and π k = . γ (n + 1)2 (2 − b)2 (2 − b)2
(10)
We see that profits are decreasing in both γ and b. Higher disutility for consumers from watching advertising leads to less advertising, which is disadvantageous for both the TV channels and the advertisers. A higher b will, as explained above, lead to less advertising and, again, both TV channels and advertisers are worse off. It can further 8
be verified from (10) that an increase in the number of advertisers leads to higher profits for the TV channels, but lower profits for the advertisers. This is because the market power of the advertisers relative to the TV channels falls (so that the advertising price increases for any given advertising level). We summarize our results concerning profits: Proposition 2 The non-cooperative equilibrium profit levels for the TV channels and for the advertisers are higher (i) the more differentiated the TV channels’ programs are perceived to be; and (ii) the lower the viewers’ disutility of advertising. The larger the number of advertisers, the higher the profit level of the TV channels and the lower the profit level of the advertisers. Finally, let us consider collusion between the TV channels. If b = 0, the TV channels are by definition independent, and collusion has no effect at all. At the other extreme, we know that the TV channels compete away (almost) all advertising and have close to zero profits when b approaches 1. This is a prisoners’ dilemma situation, where the firms would have been jointly better off with more advertising on both channels. This suggests that collusion between the TV channels leads to more advertising than in the non-cooperative equilibrium for all b > 0, and more so the less differentiated the TV channels. Formally, we can derive the first-order conditions for a collusive outcome from the TV channels’ joint profit maximization problem. We then find that the equilibrium advertising level for channel i equals (with superscript C for collusion):
AC i =
1 n 2γ n + 1
(11)
Note that differentiation as such does not make any difference if the TV channels collude. The reason for this is that a reduction in differentiation has no competitive effect in a collusive outcome, and therefore does not trigger any change in the chosen level of advertisements. By substituting AC i into the expressions for profit in (4) and (5), we find that profits
9
for the TV channels and the advertisers, respectively, are:
ΠC i =
1 1 n 1 , and π C . k = 4γ n + 1 2γ (n + 1)2
The following can now be verified: Proposition 3 For any b > 0, advertising levels and profits are higher when the TV channels collude than when they act non-cooperatively, and are independent of the degree of product differentiation between the TV channels’ programs. Advertising levels and profits respond to changes in viewer disutility of advertising and the number of advertisers in the same way as when TV channels act non-cooperatively. Proposition (3) suggests that any anti-competitive measure between TV channels increases the amount of advertising. An anti-competitive merger, for instance, will trigger more advertising. Below, we show that this has some interesting welfare implications.
4
Social optimum
We express welfare as W = CS + Π1 + Π2 + π A .
(12)
With a total of A1 + A2 advertising slots on the two TV channels, the advertisers have an aggregate gain from advertising on TV equal to A1 V1 + A1 V2 . The moneyequivalent consumer disutility from this advertising equals γ (A1 V1 + A1 V2 ) . Since a main purpose of this paper is to show that the market may underprovide advertising, we assume that no additional consumer surplus is generated by the sales of products triggered by this advertising.14 Thereby we have ”minimized” the social gains from 14
Suppose, for instance, that all consumers have the same willingness to pay for each unit of the goods. The producers will then charge the consumers a price equal to their reservation price; see also Anderson and Coate (2000).
10
advertising. Accordingly, we can express welfare as
W = U + (1 − γ) (A1 V1 + A2 V2 ) . From the welfare function we immediately see that advertising on TV is socially beneficial with if and only if γ < 1. In contrast, there will be advertising in market equilibrium even when γ ≥ 1. Formally, by solving ∂W/∂Ai = 0 (i = 1, 2) we find that the socially optimal advertising level equals
A∗i
=
1−γ , γ(2−γ)
0,
if 0 < γ < 1
(13)
if γ ≥ 1
Note that the socially optimal amount of advertising is independent of how close substitutes the TV channels are (i.e., independent of b). This is natural, since commercials are equally disturbing for the consumers regardless of the extent of horizontal differentiation between the TV channels. The optimal level of advertising is thus only a function of γ, the viewers’ disutility parameter. Differentiation of (13) further shows the intuitively obvious result that A∗i is decreasing in the consumers’ disutility of advertisements for all γ ∈ (0, 1) . Inserting for A∗i we find that welfare in social optimum equals
∗
W =
1 , γ(2−γ)
1,
if 0 < γ < 1
(14)
if γ ≥ 1.
From (14) we see that ∂W ∗ /∂γ < 0 for γ ∈ (0, 1) . The reason for this relationship is two-fold. First, consumer surplus is decreasing in γ. This is a direct effect. Second, there is an indirect effect through the disutility parameter’s effect on the advertising level. We know that higher disutility leads to a lower amount of advertising in social optimum (∂A∗i /∂γ < 0 for γ ∈ (0, 1)). This results in a reduction in society’s use of value-enhancing TV commercials. 11
To sum up, we have Proposition 4 In social optimum, advertising levels and welfare are decreasing in viewers’ disutility from watching advertising, and there is no advertising in optimum if this disutility is sufficiently high (γ ≥ 1). Welfare is independent of the degree of product differentiation and the number of advertisers.
5
A Comparison
As noted above, the equilibrium outcome depends on whether TV channels compete or collude. Let us therefore first compare the social optimum with the non-collusive equilibrium, and then with the collusive equilibrium.
5.1
Non-collusive equilibrium vs. social optimum
Using equations (12) and (8), we can express welfare in the non-collusive equilibrium as WM =
[γ (n + 1) + (1 − b) (γ + 2n)] (2 + n − b) . γ (2 − b)2 (n + 1)2
(15)
Let us start out with the limiting case where n → ∞ (recall that the socially optimal level of advertising is independent of n). Denoting values in this case with a bar (e.g., A¯M ≡ limn=∞ AM ), we have 2 (1 − b) ¯ M = 2 (1 − b) + γ . , and W A¯M = γ (2 − b) γ (2 − b)2
(16)
Using equations (13) and (16) we find that the difference between advertising levels in social optimum and equilibrium equals A¯∗ − A¯M = −2
γ−b . γ (2 − γ) (2 − b)
(17)
We see that there is too much advertising in the market equilibrium if and only if 12
γ > b. The driving force behind this result is the fact that the TV stations have high market power over their viewers if the channels’ program contents are perceived to be poor substitutes. The TV channels will exploit this market power by selling a larger amount of advertising slots to the producers, even though this reduces the viewers’ utility from watching TV. However, competition for consumers forces the TV channels to have less advertising the closer substitutes their program contents are. We have shown that independent of the viewers’ disutility of being interrupted by commercials, the equilibrium advertising level equals zero in the limit as b approaches one. This is obviously below social optimum if γ < 1. More generally, competition between the TV channels will be socially destructive if b > γ, in which case there will be underprovision of advertising in equilibrium. With a finite number of advertisers, there will be a downward shift in demand for advertising (c.f., equation (9)). This means that there is less scope for overprovision of advertising, and the critical value of b will be below γ. By differentiating (15) with respect to b and n we have that:
M
∂W ∂b
=−
³ ´ 2n (n + γ − 1) b − ˆb 2
3
γ (n + 1) (2 − b)
M
, and
∂W = ∂n
³ ´ 2 (1 − b) (n + γ − 1) b − ˆb γ (n + 1)3 (2 − b)2
, (18)
where ˆb ≡ γ(n + 2) − 2 . n+γ−1
(19)
There is too much advertising in market equilibrium if b < ˆb. In this case an increase in b or a reduction in n results in higher welfare, since less product differentation or a smaller number of advertisers would result in less advertising. Likewise, more product differentiation and a larger number of advertisers would be welfare improving if b > ˆb, since in that case there will be too little advertising from a social point of view. Moreover, it can also be shown that there will be underprovision of advertising 13
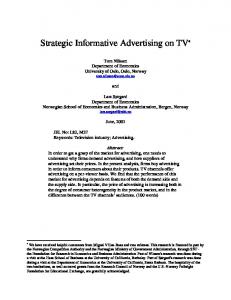
in market equilibrium if the viewers’ disutility from advertising is sufficiently low.15 The relationship between advertising in the non-cooperative equilibrium and in the social optimum is illustrated in the left-hand side panel of Figure 1. The curve labelled AM n=4 corresponds to the case of n = 4 advertisers, while the curve labelled A¯M considers the limit value as n → ∞.16 For all b < 1 the latter curve has the higher values. This is because the equilibrium level of advertising is increasing in n (while the social optimum is independent of n). The right-hand side panel of Figure 1 shows the corresponding relationship between channel differentiation and welfare. Note in particular the inefficiency of the market economy for high values of b. 1.4
2.0
A
M
W
*
1.5 1.0
1.3 Wn=4
*
W Welfare
Advertisement levels
M
A
A M= 4 n
M
1.2
1.1
0.5 0.0 0.00
bˆ
0.25
γ
b
0.50
0.75
1.00
1.0 0.00
γ
bˆ
0.25
0.50
b 0.75
1.00
Channel differentiation
Channel differentiation
Figure 1: Comparision between social optimum and market equilibrium. We can summarize our results as follows: Proposition 5 In an equilibrium where the TV channels act non-cooperatively, there is too much advertising if b
γ(n+2)−2 n+γ−1
≡ ˆb.
Collusive equilibrium vs. social optimum
Finally, let us compare the collusive outcome with the social optimum. When the TV channels collude, they are able to counter the effect of product differentiation. Therefore advertising levels will be independent of b. This is true also for social optimum, and by comparing (11) and (13) we find: 15
By rearranging (19) we find that there will be underprovsion of advertising if γ < γ L ≡ 16 The curves are given by equations (8) and (16), respectively.
14
ˆ b(n−1)+2 . n+2−ˆ b
Proposition 6 In an equilibrium in which the TV channels collude, there is too much advertising if γ >
2 n+2
and too little advertising if γ
ˆb. Consistent with this, we have
AP1
−
AP2
³ ´ (1 − b) (n + γ − 1) ˆ b−b . = γ (n + 1) (2 − b2 ) (2 − γ)
This means that the publicly owned TV channel will advertise more than the private, profit-maximizing TV channel if b > ˆb. This is quite natural, since by doing so it partly corrects for the underprovision of advertising which would have been the case if both channels had been private, profit maximizing entities. Figure 2 illustrates the difference between the advertising levels when γ = 1/2 for the limit case n → ∞ (where ˆb = γ). In the neighborhood of b = γ = 1/2 we see that the public channel advertises increasingly more than the private channel the closer substitutes the TV stations are. However, since the Bertrand-paradox-style result that there will be no advertising in the limit as the channels are about to become perfect substitutes is still present, the curve is downward-sloping when b approaches 1.
17
A1P − A2P 0.1 0.0 0.00
b 0.25
0.50
0.75
1.00
-0.1 -0.2 -0.3 -0.4
Figure 2: Difference in advertisements between public and private channel.
Suppose that γ > 1, in which case there will be no advertising in social optimum. Does this mean that a public TV channel in a mixed duopoly should carry no advertis, ing? No, not necessarily. From equation (20) we find that A1 > 0 if γ < γ˜ ≡ 2 1+(1+b)n 2+(2+b)n where γ˜ is strictly increasing in b and n. Since γ˜ is generally greater than 1, we see that the government may find it optimal to allow advertising on its own channel even when advertising as such is wasteful. This is because such advertising has an indirect positive effect on the surplus generated by the private TV channel. To see this, consider the limit case where n → ∞. If γ = 1, advertising has neither a positive nor a negative social value per se. The direct effect of a marginal increase in A1 is to generate some profit for TV1 that is exactly matched by a loss of consumer surplus. However, the indirect effect of the increase in A1 is to make TV2 relatively more attractive for any given advertising level A2 . Thereby TV2 will observe a positive shift in demand for advertising and thus have a non-marginal increase in profits. The net effect of the higher A1 is thus to improve welfare due to the higher profit level for TV2 . From this it follows that it must be optimal to set A1 strictly positive if γ = 1. By continuity, the same must be true also if γ is somewhat larger than 1.20 20
Note that there is no reason to set A1 > 0 if γ ≥ 1 and b = 0. This is because the two TV channels
18
If γ > γ˜ the publicly owned T V 1 sets AP1 = 0. Inserting for this, we can then use equations (4) and (7) to find that profit maximizing behavior by TV2 implies
AP2
1 = γ
µ
n n+1
¶µ
¶ 1−b . 2
(22)
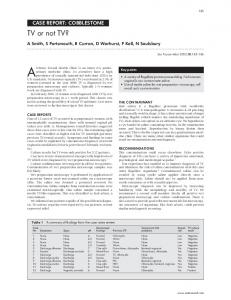
In this case there is obviously too much advertising from a social point of view. From equation (22) we further see that the advertisement level is decreasing in b and increasing in n, as is the case in the market equilibrium where both TV stations are profit maximizing firms. We can summarize our results as follows: Proposition 7 In a mixed duopoly, the public TV channel will have the higher advertising level if and only if b > ˆb. Moreover, the public TV channel may carry advertising even when advertising is socially wasteful, which happens for 1 < γ < γ˜ . Proposition 7 is illustrated graphically in Figure 3 for γ = 1.1 and n → ∞.
Advertisement levels
0.4
A2P
0.3 0.2 0.1 0.0 0.00
A1P b 0.25
0.50
0.75
1.00
Figure 3: Advertisement levels when advertisement is intrinsically wasteful. are then completely unrelated, so that the advertising level on TV1 does not have any indirect effect on the profit level of TV2 .
19
7
Some concluding remarks
In contrast to most of the existing literature, we have modeled the media firm as an intermediate player that transmits advertising to consumers. It turns out that such a modeling approach is decisive for the answer to the question of whether there is overor underprovision of advertising. Our starting point is that advertising-financed TV is a mixed blessing. Advertising is good for the sales of products because it generates a surplus, and bad for viewers because they typically dislike being interrupted by commercials on TV. However, our main point is that underprovision of advertising may happen, and is more likely the less differentiated the TV channels’ programs are. In such situations, restrictions on the amount of advertising can be detrimental to welfare. In fact, it might actually be welfare enhancing to allow an anti-competitive merger between TV channels. We also point to the fact that the nature of competition as such might be crucial for whether there is over- or underprovision of advertising on TV. If there is collusion on advertising, the perceived product differentiation between TV channels makes no difference for the amount of advertising that is provided. Collusion on advertising means that they succeed in having a rather large amount of advertising on TV. Since advertising is observable and deviation therefore easy to detect, there might be scope for such a collusive behaviour. If one observes that TV channels advertise a lot even in a situation where they are perceived as rather close substitutes, this is an indication that there might be collusion on advertising. An alternative to imposing restrictions on advertising might then be to let the anti-trust authorities scrutinize the TV channels. Note that the TV channels can compete along some dimensions, such as for example programming investments, and despite that collude on advertising. This implies that it is not enough to study whether the TV channels compete or not; one must look in detail at the nature of competition on advertising as such.
20
8
References
Anderson, S. P. and S. Coate (2000), "Market Provision of Public Goods: The Case of Broadcasting", Working Paper 7513, National Bureau of Economic Research. Bagwell, K. (2003), "The Economic Analysis of Advertising", unpublished manuscript, Columbia University. Barros, P. P., H. J. Kind, T. Nilssen, and L. Sørgard (2002), "Media Competition when the Audience Dislikes Advertising: A Theory of Vertical Alliances on the Internet", unpublished manuscript, Universidade Nova de Lisboa, Norwegian School of Economics and Business Administration, and University of Oslo. Becker, G. S. and K. M. Murphy (1993), "A Simple Theory of Advertising as a Good or Bad", Quarterly Journal of Economics, 942-64. Buchanan, J.M. (1969), "External Diseconomies, Corrective Taxes, and Market Structure", American Economic Review 59, 174-177. Cremer, H., M. Marchand, and J.-F. Thisse (1991), "Mixed Oligopoly with Differntiated Products", International Journal of Industrial Organization 9, 43-53. Danaher, P.J. (1995), "What Happens to Television Ratings During Commercial Breaks?", Journal of Advertising Research 35, 37-47. De Fraja, G. and F. Delbono (1989), "Alternative Strategies of a Public Enterprise in Oligopoly", Oxford Economic Papers 41, 302-11. Dixit, A. and V. D. Norman (1978), "Advertising and Welfare", Bell Journal of Economics, 9, 1-17. Dixit, A. and V. D. Norman (1979), "Advertising and Welfare: Reply", Bell Journal of Economics, 10, 728-729. Dixit, A. and V. D. Norman (1980), "Advertising and Welfare: Another Reply", Bell Journal of Economics, 11, 753-754. Dukes, A. and E. Gal-Or (2003), "Negotiations and Exclusivity Contracts for Advertising", Marketing Science 22, 222-245. Fisher, F. M. and J. J. McGowan (1979), "Advertising and Welfare: Comment", Bell Journal of Economics, 10, 726-727. Gabszewicz, J., D. Laussel, and N. Sonnac (2000), "TV-Broadcasting Competition and Advertising", Discussion Paper 00/6, CORE, Université Catholique de Louvain. Gal-Or, E. and A. Dukes (2003), "Minimum Differentiation in Commercial Media Markets", Journal of Economics and Management Strategy 12, 291-325. Hull, B.B. (1990), "An Economics Perspective Ten Years After the NAB Case", Journal of Media Economics 3, 19-36.
21
Moriarty, S.E. and S.-L. Everett (1994), "Commercial Breaks: A Viewing Behavior Study", Journalism Quarterly 71, 346-355. Motta, M. and M. Polo (1997), "Concentration and Public Policies in the Broadcasting Industry: The Future of Television", Economic Policy 25, 294-334. Nilssen, T. (2000), "Risk Externalities in a Payments Oligopoly", Memorandum 10/2000, Department of Economics, University of Oslo. Nilssen, T. and L. Sørgard (2002), "A Public Firm Challenged by Entry: Duplication or Diversity?", Regional Science and Urban Economics 32, 259-274. Nilssen, T. and L. Sørgard (2003), "TV Advertising, Programming Investments, and Product-Market Oligopoly", unpublished manuscript, University of Oslo and Norwegian School of Economics and Business Administration. Owen, B.M. and S.S. Wildman (1992), Video Economics, Cambridge, MA: Harvard University Press. Salinger, M.A. (1988), "Vertical Mergers and Market Foreclosure", Quarterly Journal of Economics 103, 345-356. Shachar, R. and B.N. Anand (1998), "The Effectiveness and Targeting of Television Advertising", Journal of Economics and Management Strategy 7, 363-396. Shapiro, C. (1980), "Advertising and Welfare: Comment", Bell Journal of Economics, 11, 749-752. Steiner, P.O. (1952), "Program Patterns and Preferences, and the Workability of Competition in Radio Broadcasting", Quarterly Journal of Economics 66, 194-223.
22