ments of the semivariance response curve are computed to create images which relate significant portions of in- than 3 (Wulder et al., 1996b). Image texture may ...
Aerial Image Texture Information in the Estimation of Northern Deciduous and Mixed Wood Forest Leaf Area Index (LAI) Mike A. Wulder,* Ellsworth F. LeDrew,* Steven E. Franklin,† and Mike B. Lavigne‡
L
eaf area index (LAI) currently may be derived from remotely sensed data with limited accuracy. This research addresses the need for increased accuracy in the estimation of LAI through integration of texture to the relationship between LAI and vegetation indices. The inclusion of texture, which acts as a surrogate for forest structure, to the relationship between LAI and the normalized difference vegetation index (NDVI) increased the accuracy of modeled LAI estimates. First-order, secondorder, and a newly developed semivariance moment texture are assessed in the relationship with LAI. The ability to increase the accuracy of LAI estimates was demonstrated over a range of forest species, densities, closures, tolerances, and successional regimes. Initial assessment of LAI from spectral response over the full range of stand types demonstrated the need for stratification by stand type prior to analysis. Stratification of the stands based upon species types yields an improvement in the regression relationships. For example, deciduous hardwood stands, spanning an LAI range from ≈1.5 to 7, have a moderate initial bivariate relationship between LAI and NDVI at an r2 of 0.42. Inclusion of additional texture statistics to the multivariate relationship between LAI and NDVI further increases the amount of variation accounted for, to an R2 of 0.61, which represents an in-
* Waterloo Laboratory for Earth Observations, Department of Geography, University of Waterloo, Waterloo, Ontario, Canada † Department of Geography, The University of Calgary, Calgary, Alberta, Canada ‡ Canadian Forest Service, Natural Resources Canada, Maritimes Forest Research Centre, Fredericton, New Brunswick, Canada Address correspondence to M. A. Wulder, Waterloo Laboratory for Earth Observations, Department of Geography, University of Waterloo, Waterloo, Ontario, N2L 3G1, Canada. Received 12 March 1997; revised 13 October 1997. REMOTE SENS. ENVIRON. 64:64–76 (1998) Elsevier Science Inc., 1998 655 Avenue of the Americas, New York, NY 10010
crease in ability to estimate hardwood forest LAI from remotely sensed imagery by approximately 20% with the inclusion of texture. Mixed forest stands, which are spectrally diverse, had an insignificant initial r2 of 0.01 between LAI and NDVI, which improved to a significant R2 of 0.44 with the inclusion of semivariance moment texture. Elsevier Science Inc., 1998 INTRODUCTION Leaf area index (LAI), the leaf area per unit ground area, is a dimensionless index usually defined in units of m2 m22. It is an important structural attribute of forest ecosystems because of its potential to be a measure of energy, gas, and water exchanges. For example, physiological processes such as photosynthesis, transpiration, and evapotranspiration are a function of LAI (Pierce and Running, 1988). Accordingly, estimation of LAI from remote sensing instruments is of wide interest and significance, prompting Running et al. (1986), to comment that LAI is “the single variable which may be derived from remote platforms that is of greatest importance for quantifying energy and mass exchange by plant canopies over landscapes.” Furthermore, understanding the relationship between spectral response and LAI at the forest level may allow for the future determination of LAI by remote sensing at a global level. This may facilitate calculation and global modeling of canopy photosynthesis and evapotranspiration in a synoptic and repeatable fashion (Spanner et al., 1990; Gutman, 1991; Bonan, 1993). Increased accuracy in the estimation of LAI in high resolution situations may provide insight to the assessment of LAI at coarser regional resolutions. The estimates may then be used to drive biogeochemical models, such as BIOME-BGC, which characterize the primary productiv0034-4257/98/$19.00 PII S0034-4257(97)00169-7
Texture in the Estimation of LAI
ity of large areas (Running and Coughlan, 1988; Running and Gower, 1991; Running and Hunt, 1994). The remote determination of LAI may be based upon previously mapped data and known relationships stored and assessed in a geographic information system; this is known as predictive vegetation mapping (Franklin, 1995), which extrapolates LAI from existing information. Alternatively estimates of LAI may be based upon new data collected from remote sensing instruments. Various techniques to derive LAI from remotely sensed sources have been attempted, such as, Beers Law inversion techniques (Monteith, 1972), multisource remote sensing through the fusion of optical and SAR data (Franklin et al., 1994), and pixel decomposition in conjunction with geometrical optical modeling (Hall et al., 1995). Complex canopy radiation models have been developed (Li and Strahler, 1985; Wu and Strahler, 1994) to assess forest canopies which take into account the effects of solar elevation, diffuse and direct radiation, and spectral quality through the modeling of the relationship between shaded and sunlit portions of a conifer forest canopy and understory. Empirical studies involving spectral reflectance values are the most frequently and successfully applied technique in the estimation of LAI (Nemani et al., 1993). Spectral indices are empirical, relatively simple, and offer regression-based relationships between remotely sensed radiance indices and LAI. The application of empirical spectral indices is an accessible research technique with a large body of literature spanning a variety of techniques on an array of different sensors (Tucker, 1977; Asrar et al., 1984; Running et al., 1986; Peterson et al., 1987; Curran and Williamson, 1987; Baret et al., 1988; Spanner et al., 1990; Gong et al., 1992; Price, 1993; Spanner et al., 1994; Wulder et al., 1996a). In this study we use empirical spectral indices to assess the information content of vegetation indices and texture in the estimation of LAI. Spectral Estimation of Leaf Area Index Spectral indices are empirical measures, often analyzed by regression, from which we seek relationships between remotely sensed radiance or reflectance and LAI. Vegetation indices, such as the normalized difference vegetation index (NDVI), may be viewed as a surrogate for scene vegetation content, and applied in an attempt to relate remotely sensed data to physical measures of vegetation, such as LAI (Wulder et al., 1996a). A difficulty in estimation of LAI from vegetation indices is the asymptotic relationship between LAI and NDVI which results in limited variation in NDVI values for LAI values greater than approximately 3 (Asrar et al., 1984; Running et al., 1986; Franklin, 1986; Baret et al., 1988; Spanner et al., 1990; Baret and Guyot, 1991; Smith et al., 1991; Spanner et al., 1994). The vegetation index values are of a limited range as a consequence of being derived from
65
a remote platform which may only view the horizontal expression of a stand. The vertical structure is related to the tree height distribution and the horizontal distribution pertains to stand density and spatial distribution of the trees (St-Onge and Cavayas, 1995). As the vertical structure of a stand becomes more complex, LAI values increase and the amount of vegetation overlap also increases resulting in variation that is difficult to measure from a nadir viewing remote sensing platform. Accordingly, stands with varying vegetation composition and structure may have similar vegetation index values due to a similar horizontal expression (Wulder et al., 1996a). From observation it has been found that it is below an LAI of 3 that the estimates from spectral response are quite strong (Gong et al., 1992); accordingly, any improvements that can be made at extending the ability to estimate LAI at higher values from spectral response is valuable. The spatial resolution dependency of the horizontal expression of a stand must also be considered. As image spatial resolution decreases, the amount of interpixel variation also will decrease, providing less structural information. Conversely, the image extent decreases as the spatial resolution increases resulting in detailed information which covers a small ground area. As a result, the use of high spatial resolution airborne sensor data in this study will result in relationships that are different than those found previously with lower resolution data, such as Landsat TM (Franklin, 1986). The effect of canopy closure will be altered; a low density canopy will no longer have the characteristics of the understory, but will be represented by pixels actually sensing the understory. Just as the lower resolution data forest stand digital numbers are altered by the understory or soil, the texture of high resolution stand data will be altered. As the pixel values in the lower resolution imagery are moderated by the combining of various objects in the pixel (Cohen et al., 1995), the high resolution imagery, which has a number of pixels to represent an object, has a greater range of textural information as the variance is less suppressed (Strahler, et al., 1986; Woodcock and Strahler, 1987). Conifer forest stands have been the object of most previous work in the estimation of LAI from variations in image response (Peterson and Running, 1989; Nemani et al., 1993). Our study area in the Fundy Model Forest is located in the Acadian forest region of southeast New Brunswick, Canada, and is characterized by a mixture of broadleaf deciduous and coniferous trees. This generates a need for an understanding of the relationship between mixed forest and deciduous forest image response with LAI. The use of empirical spectral indices to develop regression-based relationships between remotely sensed reflectance values and LAI will increase the understanding of the relationship between LAI with NDVI and texture derivatives. Remotely sensed reflectance data are related to the fraction of incident photosynthetically active radia-
66
Wulder et al.
tion absorbed by the canopy (APAR), and are only related to LAI to the extent that APAR is related to LAI (Bonan, 1993; Wulder et al., 1996a). Texture in the Assessment of Forest Structure The dynamic nature of forest conditions limit the ability to predict LAI from a single information source, such as NDVI. As the NDVI is derived from image spectral values, any forest structural variability will be related in the computed NDVI values. For example, factors such as differences in crown closure, shadows, or stand density may result in markedly different stand structures, yet may still be represented by the same NDVI value based upon the ratio of red to infrared spectral data. Internal stand conditions, such as mutual shadowing, will actually result in a decrease in NDVI as LAI increases. Internal stand shade conditions may be detected in measures of image texture computed on imagery of a high spatial resolution. Texture may be used to provide structural information when the strength of the relationship between spectral information and LAI diminishes. Texture, in the context of digital image processing, is the spatial variability of image tones which describes the relationship between elements of surface cover. Therefore, it follows that texture contains structural information, as the variation in texture is related to changes in the spatial distribution of forest vegetation. The above-ground organization of forest elements or forest structure (Spurr and Barnes, 1980) is accordingly represented in texture. Texture measures are supplemental to the image data and provide an accessible, low cost, additional information source. Texture has also been demonstrated to have the ability to add structural information to the spectrally derived vegetation indices and improve estimates of LAI (Wulder et al., 1996a), especially for LAI values greater than 3 (Wulder et al., 1996b). Image texture may be related by a variety of statistics which characterize the relationship between neighboring pixels. For the purpose of this study, measures which may be computed for each pixel, which characterize the spectral response within a region or along a transect, are considered texture measures. First-order texture is derived from custom filters acting as a low-pass or lowfrequency spatial filter (Haralick, 1986), which calculate a representative statistical value for the central cell of a fixed moving window which is passed over the image. The central pixel of the fixed window is given a new value to represent the local area of that pixel. The statistical distribution of local properties in the spatial domain involving the calculation of second-order statistics are represented by the grey level cooccurrence matrix and related suite of statistics. The grey-level cooccurrence matrix (GLCM) can be defined as a matrix of relative frequencies for which two neighboring pixels that are separated by a user-defined distance and angle occur on
the image (Haralick et al., 1973). Textural values are determined by computing, for a particular distance and angle, statistics based upon how the values relate to one another. For example, homogeneity, contrast, and entropy are measures which relate to specific textural characteristics of the image. Dissimilarity, mean, and standard deviation characterize the complexity and nature of grey level transitions which occur in the image (Haralick, 1979). Even though these features contain information about the textural characteristics of the image, it is often hard to identify which specific textural characteristic is represented by each of these features. Semivariance Moment Texture (SMT) A variogram describes the magnitude, spatial scale, and general form of the variation in a given set of data (Matheron, 1963). Semivariograms are a graphical representation of the spatial variability, and provide a means of measuring the spatial dependency of continuously varying phenomenon (Curran, 1988; Cohen et al., 1990; Rossi et al., 1994; Brown and Bara, 1994). Image semivariance has been demonstrated to represent image structural information. St-Onge and Cavayas (1995; 1997) have utilized the information inherent in the directional variogram as a method to estimate parameters such as density, crown diameter, crown closure, and height of forest stands, which are all related to forest structure and LAI. It is proposed and demonstrated here that the directional variogram may be utilized to generate discrete values to represent image spatial variability. Semivariance moment texture (SMT) values are extracted from semivariance response curves that are computed for each image pixel along a 35 pixel transect at a 08 angle. These moments of the semivariance response curve are computed to create images which relate significant portions of information that are found on a variogram. The actual image characteristics, represented in digital numbers, based on the organization of scene elements produce the semivariance moment values. Different scene characteristics may be related through the five different SMT values that are extracted through the calculation of variograms. The computed spatial indicators, which act as surrogate measures of image texture due to the characterization of the spatial variability in tones, are the nugget, sill, range, slope, and mean semivariance. The nugget represents the initial variance, the sill represents the maximum semivariance, the range relates the number of lags required to reach the sill, the mean semivariance represents the average magnitude of the variance between nugget and sill, and the slope of the variogram represents the rate of change of the variance between nugget and sill, computed from sill divided by the range. These values relate to typical semivariance response forms, such as the classic, periodic, aspatial, periodic-classic, multifre-
Texture in the Estimation of LAI
67
ditions (Rowe, 1972) with stand ages ranging from regeneration to old growth. The Acadian forest region is characterized by a wide variety of forest species. Coniferous tree species are predominantly jack pine (Pinus banksiana), white spruce (Picea glauca), balsam fir (Abies balsamea), and red spruce (Picea rubens). The predominant deciduous species are red maple (Acer rubrum) and white birch (Betula papyrifira), with stands also including beech (Fagus grandifolia), striped maple (Acer pensylvanicum), trembling aspen (Populus tremuloides), long tooth aspen (Populus grandidentata), and sugar maple (Acer saccharum) (Wulder, 1996). The study area was centered near Sussex at 458439N and 658319W, with data collected immediately north and south of the town site. Stands were selected for inclusion in the study to represent a range of forest types, crown closures, stand densities, tree species, and LAI values (Table 1).
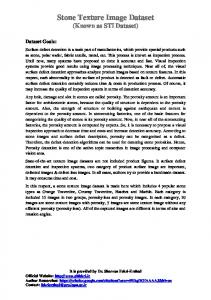
Figure 1. Location of the study area in southeastern New Brunswick, Canada.
quency, and horizontal forms presented in Curran (1988), Oliver et al. (1989), Bowers et al. (1994), and Woodcock et al. (1988). As the SMT values are computed from a variogram that is computed along a transect of pixel values, there is no potentially subjective decision concerning window size that is typical to most texture measures. METHODS Study Area The Fundy Model Forest (FMF) is a 420,000 ha working forest in southeast New Brunswick, Canada (Fig. 1). The model forest is located in the Acadian forest region and is composed of a variety of broadleaf deciduous and coniferous species and include a wide range of forest con-
Remotely Sensed Airborne CASI Imagery On 31 July 1995, at 13:00 local time, compact airborne spectrographic imager (CASI) imagery was acquired from a Cessna 310 aircraft at an elevation of 700 m and at a speed of approximately 55 knots utilizing the standard CASI 12.5 mm focal length (Anger et al., 1996). This configuration was selected to scan 1 m2 resolution imagery with five user-selected spectral bands to characterize the significant locations on a vegetation spectral response curve (Table 2). Two flight lines of approximately 10 km each in length were selected to image a range of LAI values having a variety forest types. The azimuth of both flight lines was approximately towards the sun to reduce changing illumination conditions and view angle effects. The sky was clear and the relative humidity was low reducing the effects of the atmosphere upon the imagery (Wulder et al., 1996c). Atmospheric Correction of Image Data Utilized in this field campaign was an ASD spectroradiometer (Analytical Spectral Devices, Inc., 1993) which
Table 1. Summary of Descriptive Statistics for Select Image and Field Data by Cover Type
2
No. of 10 m plots Min LAI Max LAI Mean LAI r LAI Min Stems/plot Max Stems/plot Mean Stems/plot r Stems/plot Min NDVI Max NDVI Mean NDVI r NDVI
Hardwoods
Softwoods
Mixed Woods
Combined
32 1.52 9.43 4.83 1.57 3 20 11.9 3.8 0.66 0.87 0.81 0.05
10 2.15 7.02 4.34 1.61 6 50 17.0 12.9 0.68 0.82 0.75 0.05
20 1.89 11.26 6.31 2.70 3 22 10.7 5.6 0.71 0.85 0.80 0.04
62 1.52 11.26 5.23 2.12 3 50 12.3 6.8 0.66 0.87 0.80 0.05
68
Wulder et al.
Table 2. Fundy Model Forest CASI Imagery Spectral Wavelength Channel Summary Name Channel Channel Channel Channel Channel
1 2 3 4 5
Location
Bandwidth (nm)
Center (nm)
Width (nm)
Green Red Red well Red edge Infrared
560.5–569.4 640.9–649.8 660.6–669.6 707.4–714.6 748.8–752.4
565.0 645.4 665.1 711.0 750.6
8.9 8.9 9.0 7.2 3.6
collects data from approximately 400 nm to 900 nm at a 1.8 nm recording interval. Collection of spectral data in situ enables characterization of the spectral characteristics of a sample object or surface free of atmospheric interference between the surface and the sensor. This characterization enables the comparison of spectra which are, in theory, undisturbed by the atmosphere between the sensor and surface and the airborne collected data which is subject to atmospheric interference. Objects which are present in remotely sensed imagery and in situ spectral calibration data act as pseudoinvariant features (PIFs) (Freemantle et al., 1992) for use in atmospheric correction of image data. Spectral information was recorded in the field concurrent with the CASI overflight to enable atmospheric correction of the CASI data. Paved roads, which intersect the flight lines at a number of known locations, are used as PIF targets. The spectroradiometer was operated using the procedure recommended by Peddle et al. (1995), utilizing Kodak grey cards to calibrate the incoming irradiance. The date, time, and geographic location in terms of latitude and longitude are noted during spectral sample collection to enable the computation of the solar zenith angle. Spectral and angular computation are based upon the provided sun angle/location/time/date combination, which yield a panel bidirectional reflectance factor (BRF) specific to the solar zenith angle present. Reflectance values may then be computed from the panel and target reflectance values with a panel calibration BRF specific to the solar zenith angle. Radiometric and Geometric Processing of Digital Image Data Image preprocessing of the CASI data is performed to radiometrically correct the data for the effects of scattered light, to remove instrument offsets, and to convert the digital numbers to standard radiometric units (Anger et al., 1995). General correction techniques which address visible and near-infrared image radiometry are often required for successful application of aerial and satellite remote sensing (Hall et al., 1991; Franklin and Giles, 1995). Accordingly, an initial bundle adjustment was undertaken to correct for the nonsystematic airborne imaging effects of roll, pitch, and yaw. Collection of global positioning system (GPS) ground data and flight locational data enabled differential correction and geometric
adjustment of the airborne imagery. The aircraft position and angular orientation was recorded for each scanline using the onboard GPS receiver and a two-axis vertical gyro. The geometric correction process utilized this aircraft attitude information and placed each pixel of the image on a georeferenced UTM grid (Cosandier et al., 1992; Schwarz et al., 1993; Anger et al., 1995; Price et al., 1995). The base station GPS receiver unit, located at a known geographic point, was used to correct the imagery acquired by the airborne GPS unit (Hoffman-Wellenhof et al., 1992). For this study locational data were collected with an L1 Carrier Phase Novatel GPS receiver unit at a 5-s epoch rate. Texture Processing of Digital Image Data The texture derivatives were calculated for the red and infrared channels (Table 3). When processing remotely sensed imagery to assess the texture a variety of factors need to be addressed, such as the algorithm to be employed, which channels will be assessed, and what is an appropriate quantization level for the analysis. In the case of second-order texture measures, such as the grey level cooccurrence matrices (GLCMs), the angle, direction, and step size for the comparison of values also needs to be addressed (Peddle and Franklin, 1991). The window size chosen for the analysis influences the resultant texture due to the amount of variance included. Digital image semivariance was calculated to predict best fit window sizes to be utilized in the processing of firstorder and second-order texture derivatives (Franklin et al., 1996). The visible channels dictated larger windows than the infrared channel, which is likely related to the smaller range and reduced variance of the visible channels in comparison to the infrared channel (Table 4). Field Measurement of LAI The pipe model theory, which is based upon the concept that a unit weight of tree foliage is serviced by a specific cross sectional area of conducting sapwood in the crown, is applied in this study (Kaufmann and Troendle, 1981; Lavigne et al., 1996). Nine to ten trees per species were harvested for red maple, trembling aspen, and white birch to establish locally valid allometric equations for estimating leaf area per tree (Lavigne, personal communication). Trees were selected from dissimilar stands to
Texture in the Estimation of LAI
Table 3. Complete Suite of Texture Derivatives Calculated for This Study Semivariance Moment Texture • • • • •
Nugget—measure of the initial variance Range—the distance (number of lags to the sill) Sill—recorded as first high point of variance in the variogram Slope—the rate of increase of semivariance per lag up to the sill Mean semivariance—mean semivariance response before the sill
First-Order Texturea • Mean—average reflectance within window • Standard deviation—standard deviation of reflectance within window • Min—minimum reflectance within window • Max—maximum reflectance within window • Range—the range (min–max) of reflectance results within window
Second-Order Coocurrence Textureb • • • • • •
Homogeneity Contrast Dissimilarity Mean Standard deviation Entropy
recorded for every tree in a plot. Sapwood cross-sectional area at breast height, total height, crown length, and crown width were measured on a representative sample of trees in the plot and used to estimate these values for all trees. Plot leaf area of the overstory was estimated from the sapwood cross-sectional areas of all trees and the allometric equations in Table 5. Distances and directions from plot corners to markers and prominent features were measured to aid locating plots on images. These detailed plot measurements allowed for the large field plots to be divided into sample sizes of 10 m2. Assessment of Regression Model Results To assess the significance of the coefficient of determination results, an F statistic is applied based upon the sample size and a significance level. Values that are above the computed critical level were considered significant in the analysis. The bivariate and multivariate critical values are computed by solving for the unknown coefficient of determination utilizing the following standard formulas: Bivariate, (r2)F test,
a
Calculated within semivariance customized windows specific to each wavelength. b Statistics derived from the grey level co-ocurrence matrix, GLCM; calculated within semivariance customized windows specific to each wavelength.
69
Multivariate, (R2)F test,
r2 N22 F5 · 12r2 1
(1)
R2 N2k22 , F5 · 12R2 1
(2)
where represent a wide range of leaf areas. Fresh weights of foliage and twigs were measured in the field for each third of a crown, and samples were taken to determine dry weights of each component and also leaf areas. With sapwood cross-sectional area at breast-height (1.3 m.), total height and crown length were measured. Relationships between leaf area per tree and sapwood cross-sectional area at breast-height are being used in this study (for example relationship, see Fig. 2). Allometric equations for other species encountered in this study were taken from the applicable literature (Table 5). When an equation was not available for a particular species, we used the equation of a related species. Bias and variations found in estimation of LAI from sapwood cross sectional areas are presented in Dean and Long (1986), Dean et al. (1988), and Woods et al. (1991). Fixed area plots were established in 20 stands on the flight lines. Plot size was 400 m2 in mature stands and 49 m2 or 100 m2 in young stands, depending on density. The species, diameter at breast-height, and location were Table 4. Window Sizes Suggested from Semivariance Range Computation Channel
k Range
Window Size
1 (green) 3 (red well) 5 (infrared)
560.5–569.4nm 660.6–669.6nm 748.8–752.4nm
11 9 7
F is taken from statistical table of F critical values, N is the number of cases, k is the number of independent variables, and the coefficient of determination is solved for based upon a particular significance level. In this study a significance level of 0.10 is applied. Overly influential variables and outliers were screened from the dataset. Screening criteria was based upon stem density, with the plots having a large number of stems per hectare being removed from the analysis. Of the 48 potential texture variables calculated, from the three spectral channels (green, red, and infrared) with the 16 texture derivatives (Table 3), Figure 2. Allometric relationship between leaf area and sapwood area for trembling aspen.
70
Wulder et al.
Table 5. Allometric Equations Applied To Derive LA of Study Plots Equationa
Species White birch (Betula papyrifira) Red maple (Acer rubrum) Trembling aspen (Populus tremuloides) Balsam fir (Abies balsamea)
a
Source
`
Red spruce (Picea Rubens)
LA50.04121 SA 1.325 LA50.6964 SA`0.8472 LA50.1418 SA`0.9921 LA5(163.05 SA`1.4081/ (202.16`1.40811SA`1.4081) LA5.1746 SA`1.266
White spruce (Picea glauca) Jack pine (Pinus banksiana) Sugar maple (Acer saccharum) Striped maple (Acer pensylvanicum) Beech (Fagus grandifolia) Eastern hemlock (Tsuga canadensis) Long tooth aspen (Populus grandidentata)
Use the equation LA50.25 SA Use the equation Use the equation Use the equation Use the equation Use the equation
Derived for this study Derived for this study Derived for this study Adapted from Lavigne et al. (1996) Adapted from Robichaud and Methven (1992)
for red spruce Adapted from Hungerford (1987) for for for for for
red maple sugar maple sugar maple balsam fir trembling aspen
SA is sapwood area at breast height in cm2, LA is leaf area in m2.
12 are presented in the analysis. Texture variables were removed from the analysis due to multicollinearity or complimentarity of information with other variables. The green texture derivatives were removed from the analysis due to weaker performance than the red and infrared channels. RESULTS AND DISCUSSION Linear Regression Results The relationship between LAI and NDVI is important to provide the vegetative characteristics of a stand. The relationship between LAI and NDVI is weak when considered over all study area stands simultaneously, due to the species related spectral variation between stands (Table 1). Table 6 demonstrates this decrease in model explanatory power as the variability between neighboring pixels increases. The relationships between LAI and NDVI are confounded by the different stand types, yet there are patterns to the distribution of individual stands. Accordingly, the study plots have been stratified by stand type, resulting in the greatest initial model coefficient of determination with the spectrally similar hardwood stands, demonstrating an r2 of 0.42 between LAI and NDVI (Table 6). The interspecific differences due to the mix of forest types in the complete sample is re-
sulting in the lack of trend in spectral response, resulting in the poor regression relationships. Stratification of the stands is necessary to extract the structural information specific to each stand type. The slope values of the relationships represent the rate of change of LAI with increasing NDVI, with a 1:1 conversion being ideal. Normally, a low slope value reflects a similarity of NDVI response with a limited range of LAI, whereas a high slope value relates a limited range of NDVI over a large range of LAI. When the mixed-woods and all stands data sets are assessed in the analysis, the relationships are insignificant, at 0.01 and 0.06, respectively. Mixed-wood stands contain both hardwoods and softwoods which have different spectral response characteristics which caused a weak relationship; therefore, the type of species that dominates the stand influence the spectral response and the local spectral signature. The weakness of the softwood relationship, at an r2 of 0.19, appears to be due to differing regeneration regimes between the softwood stands. The NDVI values differ between plantations and naturally regenerating stands with the plantation results lower (0.68–0.72) in comparison to the natural stands (0.79–0.81), which may possibly be due to factors such as regularity of shadows in the plantations or vigorous understory in the naturally regenerating stands. Once the softwoods are stratified for
Table 6. Bivariate Regression Relationships between LAI and NDVI, Including Regression Equationsa Stand Type
r2
SE
N
Crit. r2
Regression Equations
HW SW MW ALL
0.42 0.19b 0.01b 0.06b
1.01 1.54 1.62 1.39
26 10 13 49
0.11 0.30 0.23 0.06
17.35NDVI29.01 212.88NDVI113.99 25.21NDVI18.84 6.57NDVI20.472
a HW5hardwoods, SW5softwoods, MW5mixed-woods, ALL is all stand types combined, SE5standard error, N5sample size, and Crit. r25critical r2 value, and NDVI5normalized difference vegetation index. b Denotes not significant based upon critical r2 value.
71
Texture in the Estimation of LAI
Table 7. Stratification of Softwoods by Regeneration Regime, To Assess within Softwood Relationship between LAI and NDVI Regeneration Regime
r2
SE
N
Crit. r2
Regression Coefficients
Natural regrowth Plantation
0.96 0.50a
0.35 0.99
5 5
0.65 0.65
92.33NDVI270.39 73.85NDVI246.41
a
Denotes not significant based upon critical r2 value.
analysis by regeneration regime a strong 0.96 r2 relationship is found for the natural regrowth stands (Table 7), yet the coefficient of determination for the plantations is still lower at 0.50. The trees of a plantation are planted at regular intervals to provide each of the trees with the necessary space to absorb light, water, and soil nutrients. This tree planting pattern results in a strong regular textural component to the softwood stands. Introduction of select texture measures to the relationship between LAI and NDVI of softwood conifer stands increases the amount of variation explained. A series of red band texture derivatives demonstrates the textural qualities due to planting practices in Table 8. Texture increases the amount of variation in LAI explained from 0.50 to 0.93. The plantation example demonstrates the information content of texture in the estimation of LAI. The plantation with a distinctive texture acts as a control case to demonstrate an increase in accuracy with the inclusion of texture in the relationship between LAI and NDVI. The textural differences in the hardwood and mixed-wood stands are more subtle and do not increase the ability to estimate LAI by the same magnitude. Estimation of Mixed-Wood LAI The NDVI for a mixed-wood stand is likely influenced by factors such as the species mixture, crown closure, and understory contribution to spectral response. The relationship between LAI and NDVI is insignificant, at an r2 of 0.01, while the relationship between LAI and texture is stronger, up to a value of 0.39 for the semivariance texture nugget measure (Table 9). The high variation in spectral response due to species variation results in rich textural information. The semivariance based texture measures appear well related to the mixed-wood LAI values. The nugget of the red channel (nug-R) is a measure of the initial variance in the semivariance calculation, capturing information relating to the intrapixel Table 8. Softwood Plantation Multivariate Relationship between LAI and NDVI with a Series of Red Texture Measures Independent Variables
R2
NDVI1nugget of red channel NDVI1mean of red channel NDVI1dissimilarity of red channel
0.93 0.87 0.84
a See Table 3 for description of variables. Critical R2 value50.73 for N55, k52, a50.10.
variation of the mixed-wood stands. The semivariance slope measures, which also relate well to LAI, are providing information on the rate of change between pixel values. First-order texture measures are directly derived from the spectral values and as a result are not as sensitive to the changes in LAI of the mixed-wood stands, with a first-order texture high r2 relationship of 0.11 for max-R, which is below the critical r2 value of 0.23. The dissimilarity (DIS-R) measure is calculated from the GLCM with the interpixel arrangement of pixels within the window assessed, providing information on the relationship with LAI, with an r2 of 0.34, and being raised further to an R2 of 0.36 with the inclusion of NDVI in to the multivariate relationship. The nugget of the red channel (nug-R), when combined with NDVI, further increases from an r2 of 0.39– 0.44, demonstrating that the combination of the differing information sources when combined provide unique information to assist in the estimation of LAI. The firstorder texture relationships with the mixed-wood stands remains weak, with an insignificant maximum R2 of 0.11, even with the inclusion of NDVI as both are directly derived from the spectral values of the stands. The secondTable 9. Mixed-Woods and Hardwoods: Bivariate Regression Relationship between LAI and Texture Derivatives; Multivariate Relationship between LAI, Texture, and NDVI MixedWoods NDVI Semivariance texture derivatives nug-R slp-R nug-IR slp-IR First-order texture derivatives mean-R min-R mean-IR min-IR Second-order texture derivatives DIS-R SD-R DIS-IR SD-IR
Hardwoods
(r2)
(R2)
(r2)
(R2)
a
—
0.42
—
0.39 0.28
b
0.30
0.44 0.30 0.23 0.37
0.48 0.47 0.48 0.48
a
a
0.38
a
a
b
a
a
b
a
a
b
a
a
a
a
0.36 0.43
0.34
0.36
b
a
a
b
a
b b b
0.46 0.48 0.50 0.52 0.42 0.50 0.44 0.55
a Not significant with a critical r2 value of 0.23 or critical R2 value of 0.22 for N513, k52, a50.10. b Not significant with a critical r2 value of 0.11 or critical R2 value of 0.10 for N526, k52, a50.10.
72
Wulder et al.
order texture measures still performed inconsistently, but the dissimilarity measure on the infrared channel had an increase in accuracy and, with the inclusion of NDVI, an increase to an R2 of 0.36. The dissimilarity measure of the GLCM characterizes the complexity and nature of grey level transitions which occur in the image (Haralick, 1979), possibly capturing the complexity of the spectral response of the mixed-wood stands. The heterogeneity of the mixed-wood stands results in large variations between adjacent pixel values, which produces rich textural information. The semivariance measures are well suited to assessment of the interpixel transitions of the mixedwood stands. The first-order texture measures derived from the spectral information of the stand perform poorly due to the variance within the texture calculation window. The second-order texture measures, based upon the grey level transitions of the GLCM, vary in information based upon which statistic is being calculated. The dissimilarity measures of the GLCM respond well to the complexity of the mixed-wood spectral values. Estimation of Hardwood LAI The bivariate relationship between LAI and NDVI for deciduous hardwood stands is promising at an r2 of 0.42 (Table 9). The spectral information of the hardwood stands is varied within class by species yet is still consistent enough for a moderate relationship with LAI. The relationship between NDVI and LAI may be reduced by the variation in age class, height, species, stand density, and crown closure. The bivariate relationships between LAI and the texture variables is inconsistent, with the semivariance measures performing poorly, with an insignificant high r2 of 0.03, increasing with the first-order texture measures to a high r2 of 0.38, and a high r2 of 0.43 for the cooccurrence texture derivative of standard deviation. The broadleaf cover of the hardwood stands acts as a large leaf to interact with the insolation when the canopy is closed. An open canopy will allow the understory reflectance to be recorded as a representation of the stand. The open canopy may alter the spectral information yet still adds textural information. This textural information is adding to the relationship between LAI and NDVI. The multivariate combination of NDVI and texture in the estimation of the LAI of hardwood forest stand demonstrates an R2 of up to 0.55, which is an improvement upon the bivariate LAI/NDVI relationship, with an r2 of 0.42. The texture of the hardwood stands is complementary to the NDVI information. Semivariance texture measures, which were weak in the bivariate assessment, with LAI improve the relationship with NDVI, for example, the inclusion of the nugget of the infrared (nug-IR) increased the relationship to an R2 of 0.48. The secondorder texture statistics derived from the GLCM respond well to the regularity of the digital numbers of the hard-
Table 10. Hardwoods—Multivariate Relationship between LAI and NDVI with Mean Filtered Red Channel Data and the Texture Suitea LAI/NDVI1MEAN-R1 Texture Suite (R2) Field data STEMS CA/PA Semivariance texture derivatives nug-R slp-R nug-IR slp-IR First-order texture derivatives min-R max-R mean-IR min-IR max-IR Second-order texture derivatives DIS-R SD-R DIS-IR SD-IR a
0.52 0.54 0.50 0.49 0.54 0.55 0.49 0.48 0.57 0.52 0.49 0.46 0.55 0.48 0.61
Critical R2 value of 0.09 for N526, k53, a50.10.
wood stands. The cooccurrence measure of standard deviation on the infrared channel demonstrates an R2 of 0.55, in the multivariate estimation of LAI. Inclusion of additional texture statistics to the multivariate relationship between LAI and NDVI further increases the amount of variation accounted for, as demonstrated by the combination of NDVI, MEAN-R, and SD-IR with an R2 of 0.61 (Table 10). The improvement upon the initial relationship between LAI and NDVI, with an r2 of 0.42, to an R2 of 0.61 represents an increase in ability to estimate hardwood forest LAI from remotely sensed data by approximately 20% with the inclusion of texture. Empirical Models for the Estimation of LAI Once the strength of the relationships between the independent variables and LAI has been assessed, the strongest of the relationships may be applied to create models to estimate LAI. Tables 11 and 12 show the increase in the regression relationship strength with varying texture derivatives, which are sensitive to the particular characteristics of a stand type, and with inclusion of multivariate texture combinations. In empirical relationships of mixed-wood stands (Table 11), standard errors (SE) of approximately 1 are consistent throughout the estimates. A SE of 1 is acceptable considering that the majority of the stand LAI being estimated are above 4, where canopy closure has begun, and the difference between LAI in terms of production is low. The simplest model, with the highest R2 at 0.44, for the estimation of mixed-wood LAI is with a single semi-
Texture in the Estimation of LAI
73
Table 11. Empirical Models Derived from Spectral Response and Texture for the Dependent Variable LAI and Stated Independent Variables for Mixed-Wood Stands Ind. Variables NDVI NDVI1semivariance NDVI1first order NDVI1second order NDVI1semivariance 1second order a
R2 a
0.01 0.44 0.11a 0.36 0.51
Crit. R2
SE
0.23 0.22 0.22 0.22
1.62 1.29 1.62 1.37
25.21(NDVI)18.84 10.83(NDVI)23.937(NUG-R)21.02 21.17(NDVI)20.516(MAX-R)110.04 25.39(NDVI)10.047(DIS-IR)15.07
0.21
1.26
11.41(NDVI)20.078(DIS-IR)24.29(NUG-R)10.19
Model
2
Denotes not significant based upon critical r value, N513, a50.10.
variance texture derivative of the nugget of the red channel. A further increase in the coefficient of determination is illustrated with the inclusion of a second-order texture derivative to the relationship, to increase the relationship to an R2 of 0.51. The pattern demonstrated by the models for hardwoods stands (Table 12) is similar; with SE values generally below 1, the ability to estimate a range of LAI values is acceptable. The simplest model for the highest R2 value, at 0.55, in the determination of LAI is with NDVI and the second-order texture measure of standard deviation on the infrared channel. A further increase in model accuracy, to an R2 of 0.61, is demonstrated with the introduction of the nugget of the red channel to the relationship. These models may be applied in the estimation of image LAI based upon a stratification of stands by species (Franklin et al., 1997b; Wulder, 1997). The models derived at this high resolution may be used to provide new information to increase the accuracy of estimates of LAI derived at a lower resolution (Wulder et al., 1996d; Franklin et al., 1997a). The LAI estimates derived from CASI imagery at an accurate high resolution may be used to provide additional information to assess the subpixel characteristics of middle resolution data, such as Landsat TM. The contents of a single 30 m2 TM pixel may be composed of 900 1-m2 CASI pixels; this CASI digital information may be used to relate the subpixel characteristics of the lower resolution Landsat TM data (Wulder et al., 1996d). CONCLUSIONS The introduction of texture improved the empirical regression relationship between LAI and NDVI. Assess-
ment of LAI from spectral response over the fuller range of stand types demonstrated the need for stratification by stand type prior to analysis. Stratification of the stands based upon species types yields an improvement in the regression relationships. This study was based on the hypothesis that image spatial information is represented in texture, which is the result of the physical arrangement of scene objects on the ground, which is the actual structure of the forest. The vegetative characteristics of the forest are represented in the spectral information collected by the sensor. This spectral information, which is the result of the vegetation content, is quantified in a vegetation index, NDVI. The combination of the spatial (texture) and spectral (vegetation index) information is a surrogate for actual forest structural and vegetative information. The combination of these characteristics, assessed through statistical methods, is demonstrated to be valuable in the estimation of LAI. Based upon this understanding of vegetation indices providing information concerning the vegetation content of a location and texture providing information on the physical distribution of scene elements, the following assessments were made: • The nature of the relationship between vegetation indices and LAI is based on the spectral response characteristics of a particular stand. The spectral response of a stand is influenced by the complex assemblage of structural characteristics, such as stems per hectare, crown closure, and species. At lower LAI values, below ≈3, the canopy architecture is less complex, which enables the vegetative characteristics of the stand to provide a reasonable surrogate for vegetation amount. When the level of LAI increases, there
Table 12. Empirical Models Derived from Spectral Response and Texture for the Dependent Variable LAI and Stated Independent Variables for Hardwood Standsa
a
Ind. Variables
R2
Crit. R2
SE
NDVI NDVI1semivariance NDVI1first order NDVI1second order NDVI1semivariance 1second order
0.42 0.48 0.52 0.55
0.11 0.10 0.10 0.10
1.01 0.97 0.93 0.91
17.35(NDVI)29.01 20.56(NDVI)10.34(NUG-IR)212.83 24.29(NDVI)20.083(MIN-IR)212.44 23.79(NDVI)20.024(SD-IR)211.17
0.61
0.09
0.85
50.86(NDVI)20.059(SD-IR)11.15(NUG-IR)234.07
2
All significant based upon critical r value, N526, a50.10.
Model
74
Wulder et al.
•
•
•
•
is a greater amount of horizontal stratification of the forest which is difficult to discern with a remote sensing instrument that operates from a vertical perspective. The calculation of image texture provides a quantification of the spatial variability of scene elements. LAI, a measure of forest structural complexity, is a physical characteristic of an image that is represented in the resultant image texture. Texture added information that improved the prediction of LAI when used with NDVI. The increased empirical strength of the relationship between LAI and NDVI with the inclusion of texture demonstrates the utility of texture in the estimation of LAI. In cases where the spectral information is heterogeneous, such as mixed-wood stands, the textural information is of greater information content than the spectral information. The texture variables performed differently for different forest types. Homogeneous stands responded best with first-order texture measures, whereas the information content of heterogeneous stands was best extracted with second-order texture measures and semivariance moment texture. The use of semivariance moment texture is an attempt to develop a simple-to-derive, yet structurally robust, texture measure. The lack of a window-based constraint on the computation removes a potentially subjective user decision. The actual image characteristics, represented in digital numbers based on the organization of scene elements, produce the semivariance moment values. Different scene characteristics are being captured by the selection of semivariance moment texture derivatives of nugget, sill, range, slope, and mean semivariance. Semivariance moment texture measures also appeared to provide unique information based upon species, crown closure, and cover type. Empirical modeling of the relationship between LAI, NDVI, and texture is possible due to the complementary information content of texture and NDVI. The texture variables are sensitive to stand structural characteristics while the NDVI acts as a surrogate for vegetation content. The empirical models developed for this study demonstrated the ability to predict LAI from NDVI and texture. Multivariate models for the prediction of LAI provided the greatest amount of information when included texture values were calculated from differing spectral channels.
We would like to gratefully acknowledge the research funding provided by the Natural Science and Engineering Research
Council (NSERC), the Canadian Forest Service, the University of Calgary, and the University of Waterloo. Also, we would like to thank the two anonymous reviewers for their time and consideration in the provision of many helpful and insightful comments which improved this final manuscript.
REFERENCES Analytical Spectral Devices, Inc. (1993), Personal Spectroradiometer: Procedures Reference, ASD, Inc., Boulder, CO. Anger, C., Mah, S., Loch, C., and Renuncio, L. (1995), CASI data pre-processing methodologies: radiometric and geometric corrections. In Proceedings of the XVII Congresso Brasileiro de Cartografia, Salvador, Bahia, Brazil. Anger, C., Achal, S., Ivanco, T., Mah, S., Price, R., and Busler, J. (1996), Extended operational capabilities of the CASI. In Proceedings of the Second International Airborne Remote Sensing Conference and Exhibition, San Francisco, 24–27 June, Vol. I, pp. 124–133. Asrar, G., Fuchs, M., Kanemasu, E., and Hatfield, J. (1984), Estimating absorbed photosynthetic radiation and leaf area index from spectral reflectance in wheat. Agron. J. 76: 300-306. Baret, F., and Guyot, G. (1991), Potentials and limits of vegetation indices for LAI and APAR assessment. Remote Sens. Environ. 35:161–173. Baret, F., Guyot, G., Begue, A., Maurel, P., and Podaire, A. (1988), Complimentarity of middle infrared with visible and near-infrared reflectance for monitoring wheat canopies. Remote Sens. Environ. 26:213–225. Bonan, G. (1993), Importance of leaf area index and forest type when estimating photosynthesis in boreal forests. Remote Sens. Environ. 43:303–314. Bowers, W., Franklin, S., Hudak, J., and McDermid, G. (1994), Forest structural damage analysis using image semivariance. Can. J. Remote Sens. 20(1):28–36. Brown, D., and Bara, T. (1994), Recognition and reduction of systematic error in elevation and derivative surfaces from 71/2-minute DEMs. Photogramm. Eng. Remote Sens. 60(2): 189–194. Cohen, W., Spies, T., and Bradshaw, G. (1990), Semivariograms of digital imagery for analysis of conifer canopy structure. Remote Sens. Environ. 35:167–178. Cohen, W., Spies, T., and Fiorella, M. (1995), Estimating the age and structure of forests in a multi-ownership landscape of western Oregon, USA. Int. J. Remote Sens. 6(4):721–723. Cosandier, D., Ivanco, T., and Mah, S. (1992), The geocorrection and integration of the global positioning system with the compact airborne spectrographic imager. In Proceedings of the 15th Canadian Symposium on Remote Sensing, Toronto, Ontario, 1–4 June, pp. 385–390. Curran, P. (1988), The semivariogram in remote sensing: an introduction. Remote Sens. Environ. 24:493–507. Curran, P., and Williamson, H. (1987), GLAI estimation using measurements of red, near infrared and middle infrared radiance. Photogramm. Eng. Remote Sens. 53:181–186. Dean, T., and Long, J. (1986), Variations in sapwood area-leaf area relations within two stands of lodgepole pine. Forest Sci. 32(3):749–758. Dean, T., Long, J., and Smith, F. (1988), Bias in leaf area–
Texture in the Estimation of LAI
sapwood area ratios and its impact on growth analysis in Pinus contorta. Trees 2:104–109. Franklin, J. (1986), Thematic Mapper analysis of coniferous forest structure and composition. Int. J. Remote Sens. 7(10):1287–1301. Franklin, J. (1995), Predictive vegetative mapping: geographic modeling of biospatial patterns in relation to environmental gradients. Prog. Phys. Geogr. 19(4):474–499. Franklin, S., and Giles, P. (1995), Radiometric processing of aerial and satellite remote-sensing imagery. Comp. Geosci. 21(3):413–423. Franklin, S., Lavigne, M., Wilson, B., and Hunt, E. (1994), Empirical relations between Balsam Fir (Abies balsamea) forest stand conditions and ERS-1 SAR data in western Newfoundland. Can. J. Remote Sens. 20(2):124–130. Franklin, S., Wulder, M., and Lavigne, M. (1996), Automated derivation of geographic windows for use in remote sensing digital image texture analysis. Comp. Geosci. 22(6):665–673. Franklin, S., Lavigne, M., Deuling, M., Wulder, M., and Hunt, E. (1997a), Estimation of forest leaf area index using remote sensing and GIS data for modeling net primary productivity. Int. J. Remote Sens. 18(16):3459–3471. Franklin, S., Wulder, M., Lavigne, M., Deuling, M., and Hunt, R. (1997b), Classification of forest covertype for use in ecosystem models of net primary production. Can. J. Remote Sens. 23(3):243–251. Freemantle, J., Pu, R., and Miller, J. (1992), Calibration of imaging spectrometer data to reflectance using pseudo-invariant features. In The 15th Canadian Symposium on Remote Sensing, 1–4 June, Toronto, pp. 452–455. Gong, P., Pu, R., and Miller, J. (1992), Correlating leaf area index of ponderosa pine with hyperspectral CASI data. Can. J. Remote Sens. 18(4):275–282. Gutman, G. (1991), Vegetation indices from AVHRR: an update and future prospects. Remote Sens. Environ. 35:121– 136. Hall, F., Strebel, D., Nickeson, J., and Goetz, S. (1991), Radiometric rectification: Towards a common radiometric response among multidata, multi sensor images. Remote Sens. Environ. 35:11–27. Hall, F., Shimabukuro, Y., and Huemmrich, K. (1995), Remote sensing of forest biophysical structure using mixture decomposition and geometric reflectance models. Ecol. Appl. 5(4):993–1013. Haralick, R. (1979), Statistical and structural approaches to texture. Proc. IEEE 67(5):786–804. Haralick, R. (1986), Statistical image texture analysis. In Handbook of Pattern Recognition and Image Processing (T. Young and K. Fu, Eds.), Academic, Toronto, pp. 247–279. Haralick, R., Shanmugam, K., and Dinstein, I. (1973), Textural features for image processing. IEEE Trans. Syst. Man Cybern. SMC-3(6):610–621. Hoffman-Wellenhof, B., Lichtenegger, H., and Collins, J. (1992), Global Positioning Systems: Theory and Practice, Springer-Verlag, New York, 326 pp. Hungerford, R. (1987), Estimation of foliage area in dense Montana lodgepole pine stands. Can. J. For. Res. 17:320– 324. Kaufmann, M., and Troendle, C. (1981), The relationship of leaf area and foliage biomass to sapwood conducting area in four subalpine forest tree species. For. Sci. 27(3):477–482.
75
Lavigne, M., Luther, J., Franklin, S., and Hunt, E. (1996), Comparing branch biomass prediction equations for Abies balsamea. Can. J. For. Res. 26:611–616. Li, X., and Strahler, A. (1985), Geometric-optical modeling of a conifer forest canopy. IEEE Trans. Geosci. Remote Sens. GE-23(5):705–721. Matheron, G. (1963), Principles of geostatistics. Econ. Geol. 58:1246–1266. Monteith, J. (1972), Solar radiation and productivity in tropical ecosystems. J. Appl. Ecol. 9:747–766. Nemani, R., Pierce, L., Running, S., and Band, L. (1993), Forest ecosystem processes at the watershed scale: sensitivity to remotely-sensed leaf area index estimates. Int. J. Remote Sens. 14(13):2519–2534. Oliver, M., Webster, R., and Gerrard, J. (1989), Geostatistics in physical geography. Part I: theory. Trans. Inst. British Geog. N.S. 14:259–269. Peddle, D., and Franklin, S. (1991), Image texture processing and data integration for surface pattern discrimination. Photogramm. Eng. Remote Sens. 57(4):413–420. Peddle, D., White, H., Soffer, R., Miller, J., and LeDrew, E. (1995), Reflectance processing of field spectrometer data in BOREAS. In Proceedings of the 17th Canadian Symposium on Remote Sensing, 13–15 June, Saskatoon, Saskatchewan, Vol. I, pp. 189–194. Peterson, D., and Running, S. (1989), Applications in forest science and management. In Theory and Applications of Optical Remote Sensing (G. Asrar, Ed.), Wiley, New York, pp. 429–473. Peterson, D., Spanner, M., Running, S., and Teuber, K. (1987), Relationship of Thematic Mapper data to leaf area index of temperate coniferous forests. Remote Sens. Environ. 22: 323–341. Pierce, L., and Running, S. (1988), Rapid estimation of coniferous forest leaf area index using a portable integrating radiometer. Ecology 69(6):1762–1767. Price, R., Anger, C., and Mah, S. (1995), Preliminary analysis of CASI preprocessing methodologies. In Proceedings of the 17th Canadian Symposium on Remote Sensing, Saskatoon, Saskatchewan, Vol. II, pp. 694–699. Price, J. (1993), Estimating leaf area index from satellite data. IEEE Trans. Geosci. Remote Sens. 31(3):727–734. Robichaud, E., and Methven, I. (1992), The applicability of the pipe model theory for the prediction of foliage biomass in trees from natural, untreated black spruce stands. Can. J. For. Res. 22:1118–1123. Rossi, R., Dungan, J., and Beck, L. (1994), Kriging in the shadows: geostatistical interpolation for remote sensing. Remote Sens. Environ. 49:32–40. Rowe, J. (1972), Forest Regions of Canada, Canadian Forest Service Publication No. 1300, Environment Canada, Ottawa, Ontario, 172 pp. Running, S., and Coughlan, J. (1988), A general model of forest ecosystem processes for regional applications: I. Hydrologic balance, canopy gas exchange, and primary production processes. Ecol. Mod. 42:125–154. Running, S., and Gower, S. (1991), FOREST-BGC, a general model of forest ecosystem processes for regional applications. II. Dynamic carbon allocation and nitrogen budgets. Tree Phys. 9:147–160. Running, S., and Hunt, E. (1994), Generalization of a forest
76
Wulder et al.
ecosystem process model for other biomes, BIOME-BGC, and an application for global scale models. In Scaling Physiological Processes: Leaf to Globe (J. Ehleringer and C. Field, Eds.), Academic, Toronto, pp. 141–157. Running, S., Peterson, D., Spanner, M., and Teuber, K. (1986), Remote sensing of coniferous forest leaf area. Ecology 67(1):273–276. Schwarz, K., Chapman, M., Cannon, M., and Gong, P. (1993), An integrated INS/GPS approach to the georeferencing of remotely sensed data. Photogramm. Eng. Remote Sens. 59(11):1667–1674. Smith, N., Borstad, G., Hill, D., and Kerr, R. (1991), Using high-resolution airborne spectral data to estimate forest leaf area and stand structure. Can. J. For. Res. 21:1127–1132. Spanner, M., Pierce, L., Peterson, D., and Running, S. (1990), Remote sensing of temperate coniferous forest leaf area index: the influence of canopy closure, understory vegetation and background reflectance. Int. J. Remote Sens. 11(1): 95–111. Spanner, M., Johnson, L., Miller, J., et al. (1994), Remote sensing of seasonal leaf area index across the Oregon transect. Ecol. Appl. 4(2):258–271. Spurr, S., and Barnes, B. (1980), Forest Ecology, J Wiley, Toronto, 687 pp. St-Onge, B., and Cavayas, F. (1995), Estimating forest stand structure from high resolution imagery using the directional variogram. Int. J. Remote Sens. 16(11):1999–2021. St-Onge, B., and Cavayas, F. (1997), Automated forest structure mapping from high resolution imagery based on directional semivariogram estimates. Remote Sens. Environ. 61: 82–95. Strahler, A., Woodcock, C. and Smith, J. (1986), On the nature of models in remote sensing. Remote Sens. Environ. 20: 121–139. Tucker, C. (1977), Spectral estimation of grass canopy variables. Remote Sens. Environ. 6:11–26.
Woodcock, C., and Strahler, A. (1987), The factor of scale in remote sensing. Remote Sens. Environ. 21:311–322. Woodcock, C., Strahler, A., and Jupp, D. (1988), The use of variograms in remote sensing: I. scene models and simulated images. Remote Sens. Environ. 25:323–348. Woods, K., Feiveson, A., and Botkin, R. (1991), Statistical error analysis for biomass density and leaf area index estimation. Can. J. For. Res. 21:974–989. Wu, Y., and Strahler, A. (1994), Remote estimation of crown size, stand density, and biomass on the Oregon transect. Ecol. Appl. 4(2):299–312. Wulder, M. (1996), Airborne remote sensing of forest structure: Estimation of leaf area index, Masters thesis, University of Waterloo, Waterloo, Ontario, Canada, 101 pp. (unpublished). Wulder, M. (in press), The prediction of leaf area index from forest polygons decomposed through the integration of remote sensing, GIS, UNIX, and C. Comp. Geosci. Wulder, M., Lavigne, M., and Franklin, S. (1996a), High spatial resolution optical image texture for improved estimation of forest stand leaf area index. Can. J. Remote Sens. 22(4): 441–449. Wulder, M., Franklin, S., and Lavigne, M. (1996b), Statistical texture properties of forest structure for improved estimates of LAI from CASI. In Proceedings of the 26th International Symposium on Remote Sensing of the Environment and 18th Annual Symposium of the Canadian Remote Sensing Society, Vancouver, pp. 161–164. Wulder, M., Mah, S., and Trudeau, D. (1996c), Mission planning for operational data acquisition campaigns with the CASI. In Proceedings of the Second Annual Airborne Remote Sensing Conference and Exhibition, San Francisco, 23–27 June, Vol. III, pp. 53–62. Wulder, M., Franklin, S., Lavigne, M., Deuling, M., and Hunt, E. (1996d), Estimation of the net primary productivity of the Fundy Model Forest. In Proceedings of Eco-Informa ’96, Lake Buena Vista, FL, 4–7 November, Vol. 10, pp. 327–332.