causes an increase in cloud reflectivity and a summertime radiative forcing ..... cloud forcing due to changes in CDN is Ð0.7 W mÐ2 with a maximum negative ...
Click Here
GEOPHYSICAL RESEARCH LETTERS, VOL. 37, L02805, doi:10.1029/2009GL041320, 2010
for
Full Article
Aerosol climate feedback due to decadal increases in Southern Hemisphere wind speeds Hannele Korhonen,1 Kenneth S. Carslaw,2 Piers M. Forster,2 Santtu Mikkonen,1 Neil D. Gordon,2 and Harri Kokkola3 Received 9 October 2009; revised 9 December 2009; accepted 22 December 2009; published 27 January 2010.
[1] Observations indicate that the westerly jet in the Southern Hemisphere troposphere is accelerating. Using a global aerosol model we estimate that the increase in wind speed of 0.45 ± 0.2 m s 1decade 1 at 50– 65°S since the early 1980s caused a higher sea spray flux, resulting in an increase of cloud condensation nucleus concentrations of more than 85% in some regions, and of 22% on average between 50 and 65°S. These fractional increases are similar in magnitude to the decreases over many northern hemisphere land areas due to changes in air pollution over the same period. The change in cloud drop concentrations causes an increase in cloud reflectivity and a summertime radiative forcing between at 50 and 65°S comparable in magnitude but acting against that from greenhouse gas forcing over the same time period, and thus represents a substantial negative climate feedback. However, recovery of Antarctic ozone depletion in the next two decades will likely cause a fall in wind speeds, a decrease in cloud drop concentration and a correspondingly weaker cloud feedback. Citation: Korhonen, H., K. S. Carslaw, P. M. Forster, S. Mikkonen, N. D. Gordon, and H. Kokkola (2010), Aerosol climate feedback due to decadal increases in Southern Hemisphere wind speeds, Geophys. Res. Lett., 37, L02805, doi:10.1029/2009GL041320.
1. Introduction [2] The dominant aerosol sources over the remote Southern Hemisphere (SH) oceans are sea spray and sulfate particles derived from dimethylsulfide (DMS) gas emitted by phytoplankton [Murphy et al., 1998; Korhonen et al., 2008]. It has been proposed that climate-induced changes in DMS production in these remote regions could increase cloud condensation nuclei (CCN) concentrations, causing a negative radiative forcing and climate feedback [Charlson et al., 1987]. However, the negative forcing, if present at all, seems to be much smaller than the positive forcing of greenhouse gases [Carslaw et al., 2009]. On the other hand, the formation of whitecaps from wave breaking is strongly dependent on the wind speed at the ocean surface, thus changes in pressure fields in the marine atmosphere have been proposed as a negative climate feedback through increased sea spray in a warmer climate [Latham and Smith, 1990].
1
Department of Physics, University of Kuopio, Kuopio, Finland. School of Earth and Environment, University of Leeds, Leeds, UK. 3 Kuopio Unit, Finnish Meteorological Institute, Kuopio, Finland. 2
Copyright 2010 by the American Geophysical Union. 0094-8276/10/2009GL041320$05.00
[3] Since Latham and Smith’s [1990] study our understanding of how climate change affects wind speeds has improved. An analysis of SH climate shows significant changes in the Southern Annular Mode over recent decades [Thompson and Solomon, 2002; Son et al., 2008]. These changes have been attributed mainly to stratospheric ozone loss [Yang et al., 2007] but also to increases in greenhouse gases [Fyfe et al., 1999]. One manifestation of this trend is the intensification of spring and summer westerly winds. Here we quantify the impact of these changes in wind speed on SH aerosol and clouds.
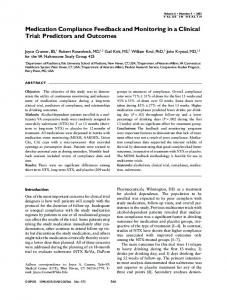
2. Methodology [4] To quantify the effect of wind speed changes on aerosol concentrations we used a global aerosol microphysics model driven by European Centre for Medium-Range Weather Forecasts (ECMWF) ERA-40 reanalyses [Uppala et al., 2005]. The ERA-40 reanalyses show a statistically significant summer (December – February) and autumn (March – May) wind speed increase in the latitude band 50 – 65°S from 1980 to 2002. The largest change has occurred in summer, with a mean increase of 7% and up to 27% in some regions (Figure 1). At 55– 60°S the increase has been approximately 0.45 ± 0.2 m s 1decade 1. [5] To reduce the computational expense of the global aerosol model we simulated only the summer, when the wind speed trend is most significant, and calculated the change in aerosol between 1980– 1982 and 2000 – 2002. According to a Wilcoxon rank sum test the wind speeds in the chosen periods can be considered representative samples of the two decades (p-values 0.18 and 0.22, respectively) and differences between the two periods were found significant (Wilcoxon test p-value 0.03). The wind speed change was considered statistically significant for latitudes where the confidence interval (Figure 1a whiskers) did not contain the value zero. [6] The GLOMAP aerosol model simulates the emission, transport, microphysical processes and removal of sizeresolved aerosol on a global scale with a horizontal resolution of 2.8° � 2.8° and 31 vertical levels [Spracklen et al., 2005]. The model has been shown to agree well with particle size distribution observations over the remote SH oceans [Spracklen et al., 2007] and to reproduce the seasonal cycle of CCN at Cape Grim, Tasmania [Korhonen et al., 2008]. The wind speed dependent sea spray flux was parameterised according to Ma˚rtensson et al. [2003] (20 nm –2 mm dry diameter) and Monahan et al. [1986] (>2 mm). Recent studies suggest that a fraction of submicron sea spray may be organic, rather than pure salt. Although mixed organic/salt flux parameterisations have
L02805
1 of 6
L02805
KORHONEN ET AL.: AEROSOL FEEDBACK DUE TO WIND SPEED
Figure 1. (a) Trend in summertime (December – February) zonal mean wind speed between 1980 and 2002 for the Southern Hemisphere oceans (based on ERA-40). Shaded bars show the slope of the trend and the whiskers the 95% confidence interval. (b) Wind speed anomalies for the 50– 65°S latitude band (relative to mean value). been constructed from observations in one ocean [O’Dowd et al., 2008], it is not known to what extent the dependence of flux on wind speed will depend on the variable organic content, nor how the organic fraction varies in different oceans. We therefore restrict our study to the Ma˚rtensson scheme for pure salt, which has been shown to agree well with size distribution measurements south of 45°S [Pierce and Adams, 2006]. The model also includes sulfate and carbonaceous aerosols from anthropogenic and biomass burning sources. We use emissions from AEROCOM (http://nansen. ipsl.jussieu.fr/AEROCOM) for 2000 – 2002 and GEIA (http://www.geiacenter.org/) for 1980– 82. Dimethylsulfide sea water concentrations [Kettle and Andreae, 2000] were assumed to be the same in both periods.
3. Results [7] Figures 2a –2d show the surface level wind speed and CCN concentration for summer 1980 – 82 and the changes
L02805
in sea spray emission flux and CCN concentration between 1980 – 82 and 2000 – 02. The CCN concentrations were calculated from the modeled aerosol assuming a fixed supersaturation of 0.2%. Surface-level CCN concentrations in the latitude band 50– 65°S increased by 19% over the two decades (Figure 2d), and in some regions by more than 60%. Absolute changes are as large as 26 cm 3 and the increase in CCN sized particles (>70 nm) is evident also from the zonal mean size distribution (Figure 3a). Moreover, at an approximate cloud base altitude of 1 km the mean increase in CCN is 22% and greater than 80% in some parts of the latitude band. To put this CCN increase in context, we note that it is approximately half of the decrease predicted by our model to have occurred over Europe over the same period (46%, not shown) due to substantial reductions in pollutant emissions. The direct and indirect effects of this change in European aerosol are estimated to have caused about two-thirds of the rapid regional warming of about 1°C since the 1980s [Philipona et al., 2009]. Thus, the climate-induced changes in natural CCN concentrations over the remote summertime SH oceans are comparable to substantial changes in the NH driven by reduced air pollution. [8] There is a clear correlation between the modeled changes in CCN concentration and wind speed at 50 – 65°S (Figure 3b). The sign of the change is the same for both quantities in 80% of the model grid boxes. However, CCN concentrations are determined by a complex interplay of emissions, transport and removal (principally by precipitation), all of which have changed somewhat in the ERA-40 re-analyses between 1980 – 82 and 2000 – 02. Therefore, while the largest increases in CCN concentration occur in regions with the largest changes in sea spray emission, concentrations are also predicted to have increased where changes in wind speed are relatively small (e.g., at 30°W – 20° E in Figures 2c and 2d). The correlation coefficient of CCN and wind speed to the power 3.41 (sea spray flux proxy) is R2 = 0.48 (n = 6876), so 52% of the variance in CCN is caused by other factors, but the single most important cause of changes between 1980 and 2000 is the wind-speed driven sea spray flux. [9] To isolate the effect of wind speed on the sea-air transfer of DMS, and hence sulfate aerosol, we repeated the baseline simulations for January 2000 but held the DMS emissions at 1980 values. This was achieved by replacing the 2000 6-hourly wind speed-dependent gridded DMS seaair fluxes with 1980 values, but using the 2000 meteorology for sea spray emission and aerosol transport. Figure 4a shows that the mean surface-level increase in CCN at 50– 65°S attributable to wind speed-induced changes in DMS flux is approximately 5%, much smaller than the total zonal mean change of 35% in January. However, CCN concentrations increase locally by up to 18% in this latitude band. South of 65°S over the Weddell Sea (10 – 60°W) the CCN increases by about 10% (and locally by up to 22%), accounting for 33% of the total increase in CCN there. The changes in DMS-derived CCN are not localised over regions of increased wind speed because DMS is transported in the free troposphere and forms CCN through particle nucleation and growth over many days [Korhonen et al., 2008]. We conclude that the effect of wind speed on DMS-derived sulfate aerosol is locally important, but on a
2 of 6
L02805
KORHONEN ET AL.: AEROSOL FEEDBACK DUE TO WIND SPEED
L02805
Figure 2. (a) Summer 1980 – 82 wind speed. (b) Modelled summertime CCN concentration at 0.2% supersaturation at the surface (1980 –82). (c) Change in sea spray emission flux proxy (surface wind speed to the power of 3.41 which is the wind speed dependence of sea spray and DMS emission fluxes) between 1980 – 82 and 2000 – 02. (d) Modelled change in CCN concentration at the surface between 1980 – 82 and 2000 – 02. (e) Modelled fractional change in cloud drop number concentration at cloud base (1 km altitude). (f) Cloud radiative forcing due to changes in cloud drop number. 3 of 6
L02805
KORHONEN ET AL.: AEROSOL FEEDBACK DUE TO WIND SPEED
L02805
converted into approximate changes in cloud drop number concentration (CDN). The CDN concentrations were calculated using the modeled aerosol and a parameterization of drop formation [Nenes and Seinfeld, 2003] assuming a Gaussian probability distribution for the updraft velocity (mean = 0 m s 1, standard deviation = 0.1 m s 1). The zonal mean increase in CDN at 1 km altitude at 50– 65°S is 11%, with local increases of up to 46% (Figure 2e). [13] Figure 2f shows the corresponding cloud radiative forcing between 1980 –82 and 2000 – 02. We used monthly mean cloud fields and surface albedo from ISCCP [Rossow and Schiffer, 1999] together with a radiative transfer model [Edwards and Slingo, 1996]. For the baseline runs liquid water paths for low level clouds were computed from ISCCP optical depth measurements assuming an effective drop radius of 10 mm. In the perturbed run liquid water paths were unchanged and drop size was altered according to the fractional change in CDN between the two periods. In the latitude band 50– 65°S the summertime zonal mean cloud forcing due to changes in CDN is 0.7 W m 2 with a maximum negative forcing of 2.2 W m 2 in some regions. The positive forcing seen in mid-latitudes (north of 50°S) is mainly due to changes in anthropogenic pollution from 1980s to 2000, but we showed above that these have negligible effect at 50– 65°S.
4. Discussion
Figure 3. (a) Zonal mean aerosol size distributions at 50– 65°S in the two periods. (b) Dependence of model CCN concentration on wind speed at 50– 65°S. Wind speed changes between the two periods are shown as Du3.41 (wind speed dependence of sea spray flux). Each point represents a monthly average for one oceanic model grid point. Simulated years were paired in the following way: 1980 vs. 2000, 1981 vs. 2001, and 1982 vs. 2002. hemispheric scale much less important than changes in sea spray. [10] To isolate the effect of increased SH pollutant emissions over the period, Figure 4b shows the change in CCN in a sensitivity test using 1980s anthropogenic emissions in the January 2000 run. Zonal mean CCN concentrations at 50 – 65°S are 0.4% higher, showing that the increased pollutant emissions had a negligible impact on CCN compared to the effect of wind speed on sea spray. [11] While the precipitation rate shows no significant difference between the two periods, also the timing and frequency of precipitation during aerosol transport affect the CCN concentrations. Therefore, separating or quantifying the influences of precipitation and transport is difficult. The increase in sea water temperature over the two decades is small (�0.1 K) and has not affected the spray emission fluxes. [12] The changes in aerosol calculated in the baseline simulations for summers 1980– 82 and 2000 –02 can be
[14] The calculated changes in SH aerosol represent a potentially important climate feedback in which anthropogenic emissions of greenhouse gases and ozone depleting substances alter the circulation of the atmosphere [Thompson and Solomon, 2002], which in turn induces greater emissions of sea spray that cause a negative radiative forcing through higher cloud drop concentrations in low level clouds. The annual mean positive forcing from all well mixed greenhouse gases at these latitudes (50 – 65°S) is �1 W m 2 over the two decades studied [Forster et al., 2007]. The only other important forcing at southern high latitudes is stratospheric ozone loss, the annual average of which has been estimated to be approximately 0.5 W m 2 since the late 1970s [Forster and Shine, 1997]. Thus, during the summer season over high latitude ocean the feedback on low level clouds through wind intensification ( 0.7 W/m2) together with ozone loss may have cancelled out the positive greenhouse gas forcing since the 1980s. [15] The changes in sea spray occur deep in the SH oceans away from any observation stations so it is not possible to confirm the model predictions directly. Nevertheless, the robust trends in wind speed and the established effect of wind speed on sea spray generation suggests that this feedback mechanism may be more important than that from possible increase in oceanic primary productivity and DMS emissions due to climate change. [16] The enhanced sea spray emissions provide a possible explanation for the observed increase in planetary reflectivity at 380 nm wavelength over open water in the 40°W – 80°E longitude segment of the Southern Ocean (south of 60°S) as well as over the Bellingshausen Sea (70 – 90°W) despite a decrease in sea ice over 1979 – 94 [Lubin et al., 2003]. We also attempted to verify the relationship between
4 of 6
L02805
KORHONEN ET AL.: AEROSOL FEEDBACK DUE TO WIND SPEED
L02805
Figure 4. (a) Fractional changes in CCN between 1980 and 2000 due to changes in wind speed-dependent DMS emissions alone. (b) Fractional changes in CCN between 1980 and 2000 due to changes in anthropogenic aerosol emissions. wind speed and CCN by examining time trends in observed cloud properties from the ISCCP [Rossow and Schiffer, 1999] but did not find any significant trend in cloud properties such as mean cloud reflectivity for 50– 65°S over the period of available satellite data (1984– 2004). However, recent studies [Evan et al., 2007] have demonstrated several instrument artifacts present in ISCCP cloud properties, which make the data difficult to use for studies of longterm trends in cloud properties and why trends in ISCCPderived cloud reflectivity might not be apparent. [17] The implications for future climate need to be evaluated. If, as recently suggested [Son et al., 2008], ozone depletion is the primary cause of wind speed increases, then this cloud forcing acts as a positive feedback on the ozone induced cooling. It more than doubles the negative radiative forcing from stratospheric ozone loss and suggests that future ozone recovery would cause a positive radiative forcing. [18] Acknowledgments. This work was funded by UK Natural Environment Research Council (UK-SOLAS programme) and Academy of Finland Centre of Excellence programme. We thank Dominick Spracklen and Stephen Arnold for useful discussions.
References Carslaw, K. S., O. Boucher, D. V. Spracklen, G. W. Mann, J. G. L. Rae, S. Woodward, and M. Kulmala (2009), Atmospheric aerosols in the Earth system: A review of interactions and feedbacks, Atmos. Chem. Phys. Discuss., 9, 11,087 – 11,183. Charlson, R. J., J. E. Lovelock, M. O. Andreae, and S. G. Warren (1987), Oceanic phytoplankton, atmospheric sulphur, cloud albedo and climate, Nature, 326, 655 – 661, doi:10.1038/326655a0. Edwards, J. M., and A. Slingo (1996), Studies with a flexible new radiation code. I: Choosing a configuration for a large-scale model, Q. J. R. Meteorol. Soc., 122, 689 – 719, doi:10.1002/qj.49712253107. Evan, A. T., A. K. Heidinger, and D. J. Vimont (2007), Arguments against a physical long-term trend in global ISCCP cloud amounts, Geophys. Res. Lett., 34, L04701, doi:10.1029/2006GL028083. Forster, P., et al. (2007), Changes in atmospheric constituents and in radiative forcing, in Climate Change 2007: The Physical Science Basis. Con-
tribution of Working Group I to the Fourth Assessment Report of the Intergovernmental Panel on Climate Change, edited by S. Solomon et al., pp. 129 – 234, Cambridge Univ. Press, Cambridge, U. K. Forster, P. M. de F., and K. P. Shine (1997), Radiative forcing and temperature trends from stratospheric ozone changes, J. Geophys. Res., 102, 10,841 – 10,857, doi:10.1029/96JD03510. Fyfe, J. C., G. J. Boer, and G. M. Flato (1999), The Arctic and Antarctic oscillations and their projected changes under global warming, Geophys. Res. Lett., 26, 1601 – 1604, doi:10.1029/1999GL900317. Kettle, A. J., and M. O. Andreae (2000), Flux of dimethylsulfide from the oceans: A comparison of updated data sets and flux models, J. Geophys. Res., 105, 26,793 – 26,808, doi:10.1029/2000JD900252. Korhonen, H., K. S. Carslaw, D. V. Spracklen, G. W. Mann, and M. T. Woodhouse (2008), Influence of oceanic DMS emissions on CCN concentrations and seasonality over the remote Southern Hemisphere oceans: A global model study, J. Geophys. Res., 113, D15204, doi:10.1029/ 2007JD009718. Latham, J., and M. H. Smith (1990), Effect on global warming of winddependent aerosol generation at the ocean surface, Nature, 347, 372 – 373, doi:10.1038/347372a0. Lubin, D., S. Lynch, R. Clarke, E. Morrow, and S. Hart (2003), Increasing reflectivity of the Antarctic ocean-atmosphere system: Analysis of Total Ozone Mapping Spectrometer (TOMS) and passive microwave data for 1979 – 1994, J. Geophys. Res., 108(D13), 4375, doi:10.1029/ 2002JD002702. Ma˚rtensson, M., D. Nilsson, G. de Leeuw, L. H. Cohen, and H.-C. Hansson (2003), Laboratory simulations and parameterization of the primary marine aerosol production, J. Geophys. Res., 108(D9), 4297, doi:10.1029/ 2002JD002263. Monahan, E., D. Spiel, and K. Davidson (1986), A model of marine aerosol generation via whitecaps and wave disruption, in Oceanic Whitecaps and Their Role in Air-Sea Exchange Processes, edited by E. C. Monahan and G. MacNiocaill, pp. 167 – 174, D. Reidel, Dordrecht, Netherlands. Murphy, D. M., P. K. Quinn, L. M. McInnes, F. J. Brechtel, S. M. Kreidenweis, A. M. Middlebrook, M. Posfai, D. S. Thomson, and P. R. Buseck (1998), Influence of sea-salt on aerosol radiative properties in the Southern Ocean marine boundary layer, Nature, 392, 62 – 64, doi:10.1038/32138. Nenes, A., and J. Seinfeld (2003), Parameterization of cloud droplet formation in global climate models, J. Geophys. Res., 108(D14), 4415, doi:10.1029/2002JD002911. O’Dowd, C. D., B. Langmann, S. Varghese, C. Scannell, D. Ceburnis, and M. C. Facchini (2008), A combined organic-inorganic sea-spray source function, Geophys. Res. Lett., 35, L01801, doi:10.1029/2007GL030331. Philipona, R., K. Behrens, and C. Ruckstuhl (2009), How declining aerosols and rising greenhouse gases forced rapid warming in Europe since the 1980s, Geophys. Res. Lett., 36, L02806, doi:10.1029/2008GL036350.
5 of 6
L02805
KORHONEN ET AL.: AEROSOL FEEDBACK DUE TO WIND SPEED
Pierce, J. R., and P. J. Adams (2006), Global evaluation of CCN formation by direct emission of sea salt and growth of ultrafine sea salt, J. Geophys. Res., 111, D06203, doi:10.1029/2005JD006186. Rossow, W. B., and R. A. Schiffer (1999), Advances in understanding clouds from ISCCP, Bull. Am. Meteorol. Soc., 80, 2261 – 2288, doi:10.1175/1520-0477(1999)0802.0.CO;2. Son, S. W., L. M. Polvani, D. W. Waugh, H. Akiyoshi, R. Garcia, D. Kinnison, S. Pawson, E. Rozanov, T. G. Shepherd, and K. Shibata (2008), The impact of stratospheric ozone recovery on the Southern Hemisphere westerly jet, Science, 320, 1486 – 1489, doi:10.1126/science. 1155939. Spracklen, D. V., K. J. Pringle, K. S. Carslaw, M. P. Chipperfield, and G. W. Mann (2005), A global off-line model of size resolved aerosol microphysics: I. Model evaluation and prediction of aerosol properties, Atmos. Chem. Phys., 5, 2227 – 2252. Spracklen, D. V., K. J. Pringle, K. S. Carslaw, G. W. Mann, P. Manktelow, and J. Heintzenberg (2007), Evaluation of a global aerosol microphysics model against size-resolved particle statistics in the marine atmosphere, Atmos. Chem. Phys., 7, 2073 – 2090.
L02805
Thompson, D. W. J., and S. Solomon (2002), Interpretation of recent Southern Hemisphere climate change, Science, 296, 895 – 899, doi:10.1126/ science.1069270. Uppala, S. M., et al. (2005), The ERA-40 re-analysis, Q. J. R. Meteorol. Soc., 131, 2961 – 3012, doi:10.1256/qj.04.176. Yang, X. Y., R. X. Huang, and D. X. Wang (2007), Decadal changes of wind stress over the Southern Ocean associated with Antarctic ozone depletion, J. Clim., 20, 3395 – 3410, doi:10.1175/JCLI4195.1. K. S. Carslaw, P. M. Forster, and N. D. Gordon, School of Earth and Environment, University of Leeds, Leeds LS2 9JT, UK. H. Kokkola, Kuopio Unit, Finnish Meteorological Institute, PO Box 1627, FI-70211 Kuopio, Finland. H. Korhonen and S. Mikkonen, Department of Physics, University of Kuopio, PO Box 1627, FI-70211 Kuopio, Finland. (hannele.korhonen@ uef.fi)
6 of 6