10.1
ASSESSING THE LAND ALBEDO MODEL OF THE NEW MODIS AEROSOL RETRIEVAL OVER LAND ALGORITHM FOR URBAN SCENES
Eduardo H. Hernandez, Min Min Oo, Leona Charles, Barry Gross, Margarita Mihailidi, Fred Moshary NOAA Crest Center, Optical Remote Sensing Laboratory, City College of New York New York, New York, 10031
1. INTRODUCTION The large variability of aerosol optical properties makes the determination of aerosol optical depth from satellite remote sensing measurements an extremely complex task. The ocean reflection signal can be taken as negligible in the Near-Infrared (NIR), and therefore, significant simplification occurs when measurements are taken over water. But unfortunately, over land, most of the signal can be attributed to ground reflectance. While conventional approaches look for “dark” pixels in an image to isolate aerosols, these pixels are subjected to increased noise. In this paper, we focus on the feasibility of the MODIS sensor to determine aerosol optical depth. In particular, an intercomparison between MODIS and CIMEL shows a significant trend for MODIS to overestimate optical depth. We show that this may be explained through an inaccurate assumption on the correlation between the visual (VIS) and NIR surface albedos. In particular, we show through an analysis of hyperspectral high resolution Hyperion data that the correlation coefficient assumption underestimates ground albedo resulting in an overestimate of the VIS optical depth. Preliminary radiative transfer calculations show that this mechanism can help explain the observed overestimation. The remote sensing of aerosol over the land stems follows from the relationship between the measured reflectance at the top of the atmosphere and the surface reflectance (assumed lambertian). Under the assumptions of small atmosphere – ground coupling, this relationship is given by Rm (θ s , θv ) = Ra (θ s , θv ) + Td (θ s )Rg Tu (θv ) ≡ Ra + Tatm (θ s , θv )Rg (1)
_____________________________________ * Corresponding author address: Barry Gross, City College of the City Univ. of New York, New York, NY, 10031; e-mail:
[email protected]
Where θ v is the satellite view direction, θ s is the solar zenith angle, Ra is the atmospheric reflectance, Rg is the ground reflectance and Td , Tu are the downward and upward total (direct + diffuse) atmospheric transmission respectively. From this formula, it is clear that for sufficiently small ground reflectance, the TOA reflectance would give a reasonable estimate to the atmospheric signal. Since many land covers (such as vegetation and some soils) are dark in the red (0.60-0.68 μm) and blue (0.4-0.48 μm) wavelengths, it is reasonable to use the darkest pixels in the image to probe the aerosol optical properties. However, in order to retrieve aerosol optical thickness, the surface reflectance of these dark pixels have to be estimated within a small uncertainty of ΔR g < ± .01 . This absolute accuracy makes absolute thresholding very difficult except over very dark surfaces. The first use of dark targets in an aerosol retrieval algorithm 1 was based on the detection of green forests as dark pixels using the vegetation index (NDVI) and the near IR reflectance. Dark vegetation was determined by a combination of high NDVI and low reflectance in the near IR. On the other hand, the surface reflectance across the solar spectrum is correlated to some extent. Soils usually have an increasing reflectance as a function of the wavelength with correlation between the reflectances slowly decreasing with an increase of the wavelength span. Parallel physical processes affect the reflectance in the 0.47 and 0.66 um channels and in the 2.1 and 3.8 um channels. For example, the presence of vegetation decreases the reflectivity in the visible channels due to chlorophyll absorption and in the mid-IR channels due to absorption by liquid water associated with the plant. In particular, wet soil has a lower reflectance in the visible channels due to light trapping, and in the 2.1 and 3.8 μm channels due to the liquid water absorption. Furthermore, surface roughness, shadows and angular orientations decrease the reflectance uniformly across the whole 2 solar spectrum and are a critical correlation mechanism for urban land cover where large
variations in shadowing and surface orientations exist. To utilize this correlation, it is necessary to observe that in the 2.1 and 3.8 μm channels, the aerosol signature is negligible and the TOA reflectance in the MIR can be taken as the ground reflectance. Using correlations based on a-priori estimates of land cover type, the 0.47 and 0.66 μm ground reflectances can be estimated thereby allowing an improved estimate of atmospheric reflectance3. Finally, as pointed out in6, the 3.8 μm channel is often contaminated by significant thermal emission and is therefore not used in the operational MODIS aerosol retrieval over land unless it is expected that large aerosol modes such as Saharan dust and/or smoke are present.
good model of the aerosol properties based on 4,5 measurements is required . In regions where the model is most applicable, we can expect the remote sensing procedure to be more accurate.
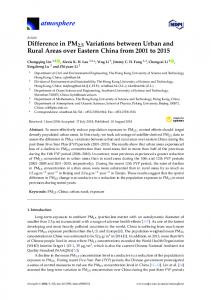
2. INTERCOMPARISONS BETWEEN MODIS AND AERONET While the above approach has been shown to be useful over dark and fairly uniform land cover types, there are inherent weaknesses which make the approach less useful for aerosol monitoring over urban areas. As pointed out in9, the northeast coast resulted in remarkably high MODIS overestimates. This is clearly seen in figure 1.
Based on these principles, the basic approach for an operational and unsupervised aerosol remote sensing algorithm for the MODIS sensor is described within the ATBD document7 for the case of urban aerosol where we ignore the aerosol contribution as 2.12 μm as 1. Determination of the presence of the dark pixels in the blue (0.47 μm) and red (0.66 μm) channels using their remotely sensed reflectance in the mid-IR channels (2.1 μm ). 2. Estimation of the surface reflectance of the dark pixels in the red and blue channels using the measurements in the mid-IR and information on surface type when possible. 3. Determination of the aerosol type using information on the global aerosol distribution and the ratio between the aerosol path radiance in the red and blue channels. 4. Inversion of the measured radiance at TOA into the aerosol optical thickness, volume (or mass) concentration and spectral radiative forcing using radiative transfer look-up tables. Finally, it is necessary to point out that even with accurate atmospheric reflectance values, aerosol retrieval is hardly straightforward. In order to derive the optical thickness from the atmospheric reflection, the aerosol size distribution, single scattering albedo and refractive index have to be assumed Sensitivity studies showed that in a general case these assumptions generate substantial errors in the derived aerosol optical thickness (~30%). To reduce the errors, a
τ MODIS
τ aeronet Figure 1. Intercomparison between AERONET and MODIS Aerosol Optical Depth.
Where the AERONET optical depth is compared to the MODIS optical depth. In this comparison, the red pixels denote the matchup between AERONET and the closest MODIS Pixel while the blue pixels represent the minimum AOT within a 40 km box. This matchup was based on the reasonable assumption that the minimum AOT will occur for pixels which are over dark surfaces such as dense vegetation. This assumption is clearly validated in figure 2 where we plot the location of the minimum AOD.
The image we use is given in figure 3a) in which the regions of supervised classification are given (urban, vegetation and water). The resultant segmentation is given in figure 3b)
*NY C
Figure 2 location of the minimum AOD.
In order to intercompare MODIS and AERONET data, it was imperative that only spatially homogeneous datasets are used. The spatial homogeneity of the CIMEL dataset was determined by using the criterion that a 5 hour interval surrounding the MODIS intercomparisons is stable within 10%. To ensure quality MODIS retrievals we have taken the prescription of using 3 x 3 cells of 10 km cells which must satisfy the property that at least 5 cells are cloud free and the deviation in these cells is less than 20% from the mean.
Figure 3 Hyperion Image: a) (left) Original Image with training regions. b) (above) Segmented image into water (green), vegetation (green) and buildings (red) regions.
3. URBAN GROUND ALBEDO CORRELATIONS As stated before, operational MODIS algorithms assume ground reflectance correlations between MIR and VIS channels are linearly correlated so that the visible channel surface albedo can be obtained from the MIR Channel. In the collection 4 algorithm, the correlations were of the form
ρ g ( 470) / ρ g ( 2160) ~ .25 ≡ c(470) ρ g ( 660) / ρ g ( 2160) ~ .50 ≡ c(660) However, when we analyze the hyper spectral measurements over NYC for the different pixel classifications, we obtain a significantly different correlation value depending on the surface
classification result. This is shown clearly in figure 4 where the mean correlation slopes for different levels of atmospheric correction are calculated for both channel wavelengths. In particular, we see that for the urban category, the MODIS Collection 4 coefficients are too low although the vegetation (grass) is seen to follow the MODIS correlation prescription. It is clear that such an error will lead to a MODIS underestimate of the optical depth.
It has been recognized by the MODIS development team that a universal ground albedo model connecting the MID-IR and VIS Channels is incorrect and urban scenes do not act like vegetation. The Collection 5 algorithm attempts to improve on surface model to account for variable surfaces (through the Short Wave Vegetation Index and account for possible angular effects). However, we see in figure 5 that the collection 5 algorithm provides very little improvement in the overestimation bias.
MODIS col4/CIMEL: AOT Correlation MODIS Col4 minimum distance AOT MODIS Col5 minimum distance AOT
1.2
MODIS AOT
1
0.8
0.6
0.4
0.2
0 0
0.2
0.4
0.6 0.8 CIMEL AOT
1
1.2
Figure 5 Intercomparison of MODIS Collection 4 and collection 5 AOD with AERONET values.
0.64 urban vegetation
0.62 0.6
R660/R2130
0.58 0.56 0.54 0.52 0.5 0.48 0.46
Figure 4 Correlation slopes for different levels of atmospheric correction are calculated for both channel wavelengths.
0
10
20
30 day
40
50
60
Figure 6 Collection 5 land albedo for both nearest pixel (urban) and minimum (vegetation) cases.
To understand why collection 5 does not significantly improve the aerosol retrieval, we plot (urban) and minimum (vegetation) cases. The results are presented in figure 6 and show a modest improvement in the correlation coefficient values but not sufficient to eliminate the bias. In figure 7, we clearly illustrate the dominant effect of the VIS reflection coefficient on the overestimation factor between MODIS and AERONET.
c ( 660 )
mod is τ 550 aeronet τ 550
Figure 7 Correlation between aerosol optical thickness estimation and reflection underestimate.
6. CONCLUSIONS We find that the Aerosol Optical Depth matchups between AERONET and MODIS show significant errors and bias. However the MODIS overestimated bias disappears when the AERONET measurements are instead correlated to the minimum AOD value in a 40km x 40km box. This fact is easy to understand since the minimum AOD is expected to occur only over the darkest pixels in the scene. This fact is explicitly illustrated by identifying all minimum AOT points to be north of the city which is comprised of vegetative pixels as demonstrated by the Hyperion high spatial resolution imagery. Using this imagery, we were able to identify the cause of the overestimated MODIS AOD to the fact that the ground albedo of the urban canopy is significantly underestimated by MODIS. We have tested the new collection 5 algorithm to see if the situation is improved but we find that a fairly small improvement over collection 4 is obtained which is traced to the fact that the urban albedo is only slightly improved.
ACKNOWLEDGEMENTS This work is supported by grants from NOAA – CREST #NA17AE1625 and NASA-COSI #NCC-103009.
REFERENCES 1. Kaufman, Y. J. and C. Sendra,: 'Algorithm for atmospheric corrections', Int. J.Rem. Sens., 9 , 1357-1381 (1988) 2. Kaufman, Y. J. and L. Remer: ‘Remote Sensing of Vegetation in the mid-IR: the 3.75 m channels’, IEEE J. Geosc. and Rem. Sens. 32, 672-683 (1994) 3. Holben B.N., Vermote E., Kaufman Y.J., Tanré D., Kalb V., Aerosols retrieval over land from AVHRR data- Application for atmospheric correction, IEEE Transactions on Geoscience and Remote Sensing, 30, 212-222, (1992). 4. Martins, J.V.,Tanre, D., Remer, L., Kaufman, Y., Mattoo, S., Levy, R. , ‘MODIS cloud screening for remote sensing of aerosols over oceans using spatial variability ‘; Geophysical Research Letters .29, no.12 : MOD4-1-4, (2002) 5. Remer, L.A.; Wald, A.E.; Kaufman, Y.J.; ‘Angular and seasonal variation of spectral surface reflectance ratios: implications for the remote sensing of aerosol over land’ ; IEEE Transactions on Geoscience and Remote Sensing 39, 275-83, (2001) 6. Kaufman, Y.J.; Wald, A.E.; Remer, L.A.; Bo-Cai Gao; Rong-Rong Li; Flynn, L.; ‘The MODIS 2.1mu m channel-correlation with visible reflectance for use in remote sensing of aerosol’; IEEE Transactions on Geoscience and Remote Sensing 35 1286-98, (1997) 7. Kaufman, Y.J.; Tanre, D. “Algorithm for Remote Sensing of Tropospheric Aerosol from MODIS” Mod04 ATBD Document (1998) 8. Knapp, K. R.; Vonder Harr, T. H. ; ’Aerosol optical depth retrieved from GOES-8: Uncertainty study and retrieval validation over South America’, JGR 107 (2002). 9. D. A. Chu, , Y. J. Kaufman, G. Zibordi, J. D. Chern, Jietai Mao, Chengcai Li, and B. N. Holben “Global monitoring of air pollution over land from the Earth Observing System-Terra (MODIS)”, JGR 108, 4661, (2003)