DISCUSSION PAPER SERIES
IZA DP No. 1816
Age Structure of the Workforce and Firm Performance Christian Grund Niels Westergård-Nielsen
October 2005
Forschungsinstitut zur Zukunft der Arbeit Institute for the Study of Labor
Age Structure of the Workforce and Firm Performance Christian Grund University of Bonn, RWTH Aachen, CCP and IZA Bonn
Niels Westergård-Nielsen CCP, Aarhus School of Business and IZA Bonn
Discussion Paper No. 1816 October 2005
IZA P.O. Box 7240 53072 Bonn Germany Phone: +49-228-3894-0 Fax: +49-228-3894-180 Email:
[email protected]
Any opinions expressed here are those of the author(s) and not those of the institute. Research disseminated by IZA may include views on policy, but the institute itself takes no institutional policy positions. The Institute for the Study of Labor (IZA) in Bonn is a local and virtual international research center and a place of communication between science, politics and business. IZA is an independent nonprofit company supported by Deutsche Post World Net. The center is associated with the University of Bonn and offers a stimulating research environment through its research networks, research support, and visitors and doctoral programs. IZA engages in (i) original and internationally competitive research in all fields of labor economics, (ii) development of policy concepts, and (iii) dissemination of research results and concepts to the interested public. IZA Discussion Papers often represent preliminary work and are circulated to encourage discussion. Citation of such a paper should account for its provisional character. A revised version may be available directly from the author.
IZA Discussion Paper No. 1816 October 2005
ABSTRACT Age Structure of the Workforce and Firm Performance* In this contribution, we examine the interrelation between corporate age structures and firm performance. In particular, we address the issues, whether firms with young rather than older employees are successful and whether firms with homogeneous or heterogeneous workforces are doing well. Several theoretical approaches are discussed with respect to these questions and divergent hypotheses are derived. Using Danish linked employeremployee data, we find that both mean age and dispersion of age in firms are inversely ushaped related to firm performance.
JEL Classification: Keywords:
M54, J21, L25
firm performance, corporate age structures, demographic change
Corresponding author: Christian Grund University of Bonn Department of Business BWL II Adenauerallee 24-42 D 53113 Bonn Germany Email:
[email protected]
*
The Danish Social Science Research Council and CCP have contributed financially to this research.
Age Structure of the Workforce and Firm Performance
1. Introduction An important task of human resource management is the development and retention of an efficient workforce. Therefore, applicants have to be checked, whether they are in line with the requirements of a certain job. Besides, the characteristics of employees may change over time and comparative advantages differ between young and older workers. Next to differences between young and older employees, the age-specific composition of the workforce is an important question. The productivity of a certain employee might be affected by her colleague. It might matter, whether this employee works together with a similar-aged colleague or with someone from a very different generation. It is important to know, whether firms with homogeneous rather than heterogeneous workforces are doing well.
In this contribution, we want to address the two questions: (1) “Are firms with young rather than older employees successful?” and (2) “Are firms with homogeneous rather than heterogeneous workforces successful?” There exist a bunch of theoretical arguments, from which hypotheses can be derived for these two issues. However, empirical evidence is rare. There are merely some cross-section studies of a very limited number of firms, which study implications of corporate age structures. The results include that changes in strategy are rather observable in firms with young top-management teams (Wiersema & Bantel, 1992), that the frequency of communication is positively associated with homogeneity in age (Zenger & Lawrence, 1989) and that labor turnover is negatively interrelated with both age and homogeneity in age (O’Reilly et al., 1989; Wiersema & Bird, 1993). Few papers also establish a relationship to some kind of measures for firm
1
performance. Pelled et al. (1999) analyze 45 teams of three firms and find a positive interrelation between age heterogeneity and group performance evaluated by the team manager. Kilduff et al. (2000) confirm this result using data of 159 managers playing a business game. In contrast, Simons et al. (1999) find a negative relationship between heterogeneity in age and growth of sales analyzing data of 57 manufacturing firms. Currently, Bellmann et al. (2003) ask managers of German firms for age-specific capacities of employees. A majority assigns advantages for older employees for the characteristics know-how, working morale and awareness for quality. In contrast, younger employees have advantages concerning ability and willingness to learn and physical resilience.
Previous work has not provided a satisfying answer concerning the addressed research questions so far. The previous studies only build on a very limited number of firms and the link to firm performance is not sufficiently examined. Therefore, we will address to the issues ‘young versus older employees’ and ‘homogeneous versus heterogeneous workforces’ using linked employer-employee data from Denmark. In particular, we analyze the relationship between firm performance – measured as value added per employee – and mean age and standard deviation of age of the firms’ workforces.
The paper proceeds as follows: First, we derive hypotheses concerning both research questions (‘young versus older employees’ and ‘homogeneous versus heterogeneous workforces’) with reference to several different theoretical approaches (Section 2). In Section 3, we describe the data and the variables, before we present our empirical results. Section 4 concludes.
2
2. Corporate Age Structures – Theoretical Considerations There is not a one and only theory of corporate age structures. Instead, it is possible to derive hypotheses from different theoretical approaches concerning the two questions ‘young versus older employees’ and ‘homogeneous versus heterogeneous workforces’. We take a short-term – point of time – approach and ask for theoretical hints, whether (1) firms with young rather than older employees are successful and (2) whether firms with homogeneous or heterogeneous workforces concerning age doing well.
Several approaches make a statement with respect to the first research question. First, Becker (1962) analyses (firm-) specific human capital, which – by definition – only enhances employees’ productivity in the original firm. He argues that firms and employees shall share costs and benefits of investments in specific human capital in order to avert the hold-up problem and – consequentially – under-investments in human capital (see Figure 1). Hence, firms with older employees are supposed to be successful, because productivity outweighs wages only for older employees.
Figure 1: Wages (W) and productivity (V) profiles with firm-specific human capital and deferred compensation
W
V2 W2
V
Alt
W1
Alt
V1
1
2
t
1
Specific human capital
Deferred compensation
Note: W = wage, V = productivity, Alt = alternative wage/productivity
3
2 t
Second, Lazear (1979) suggests some kind of deferred compensation in order to prevent employees from shirking. In this sense, some kind of wage bond is built up in the first part of an employee’s career (W1V2, see Figure 1). Comparing wages with productivity at one certain point of time again, firms with young employees are the successful ones.
Other approaches argue that there is incomplete information about employees’ ability at the beginning of their careers. As a consequence, young employees exert much effort in order to suggest high ability levels. Employees may avoid to work together with weaker colleagues (Akerlof, 1976) or try to increase future earnings and the external labor market takes the work result as a measure for unknown talent (Fama, 1980; Holmström, 1982/1999). This is therefore another argument for the hypothesis that firms with young employees are doing well. In contrast, job shopping (Johnson, 1978) speaks for the argument that firms with older employees are the successful ones. If employees do not know their exact abilities and requisitions of different jobs, they will test various jobs as long as they find a good match. Then, seniors are located at a good match with a higher probability.
The second issue is the question, whether firms with homogeneous rather than heterogeneous workforces are doing well. Hypotheses with respect to this question can also be derived from different theoretical approaches. Lazear (1998, pp. 169ff) argues that there are usually complementarities among the different kinds of human capital of young and older workers. Young employees have new ideas and skills on new technologies, whereas older employees have knowledge about the intra-firm structures and the relevant markets and networks. Usually, both kinds of human capital are necessary for firm productivity. Hence, a mixture of age groups seems to be beneficial. The effect of
4
complementarities in human capital can be illustrated by a formal example. A simple production function of a firm is given by
Π = αx + β(n − x) + γx(n − x) , where x represents the number of older employees and n-x the number of young employees so that n is the number of employees in the firm. The corresponding productivity parameters of older and young employees are given by α and β. The amount of complementarities among older and young employees is characterized by γ. The optimal number of older employees in this firm can easily be calculated by deriving the production function with respect to x: ∂Π = α − β + γn − 2 γx ∂x ⇔
xopt . =
!
=
0
α − β + γn . 2γ
Therefore, the optimal number of older employees is increasing in their productivity and decreasing in the productivity of the young employees. Furthermore, a heterogeneous workforce is beneficial, if complementarities are evident (γ>0). In the extreme case ( γ → ∞ ), the workforce will be divided in equal shares to young and older employees ( xopt . = n / 2 ). The implementation of this complementarities argument in practice is called diversity management, which is also a big issue in the management literature. It is argued that the conjunction of employees with divergent backgrounds (mainly race and gender are discussed next to age) can act as a strategic resource for firms (see e.g. Ely & Thomas, 2001, and Kochan et al., 2003).
In contrast, the organizational demography approach (Pfeffer, 1981, 1983, 1985) argues that social similarity is important for interaction, communication and cohesion. Therefore, social dissimilarities between co-workers lead to dissatisfaction, less communication and in conclusion to an alleviated efficiency of the organizations. Hence, organizational demography states that firms with homogeneous workforces are beneficial. A counter-
5
argument from social psychology is also discussed in the management literature. Social comparison theory (Festinger, 1954) argues that individuals have an innate tendency to compare and evaluate themselves with similar others. People then try to act better than this comparison group, what may lead to rivalry and conflicts among similarly aged persons (see Pelled et al., 1999, and the literature cited there). Hence, firms with heterogeneous aged workforces are supposed to be successful. However, it must not be neglected that the quality of decisions may improve, when rivals challenge their different views. Furthermore, there are arguments that also productive efforts increase in competitive situations (e.g. Lazear & Rosen, 1981). Another argument for having different age groups in a company comes from overlapping generations’ models. Cremer (1986) shows within an OLG-model with n evenly distributed age cohorts in a firm that this structure can lead to cooperation among age cohorts, who forbear from shirking in prisoner dilemma situations. In contrast, it would be individually rational for employees to free ride, if there were no overlapping generation structure.
3. Age Structures and Performance of Danish Firms
It should become clear that divergent hypotheses with respect to both research questions can be derived. Hence, it is an empirical question, which arguments prevail in practice. Therefore, the following empirical examination is a first attempt to analyze the link between corporate age structures and firm performance on a broad level. We do not test one certain theoretical approach against another, but check the relative importance of the arguments discussed above. Before we present the results, we will describe the data and the variables used. 3.1 Data
The data used in this study originate from two sources: The first is the IDA (Integrated Database for Labour Market Research) Register from Statistics Denmark. IDA contains information on labor market conditions for persons and workplaces in Denmark over the years 1980-1998. These data originate from various administrative registers. The
6
important feature of IDA is that it is possible to associate workplaces with the identity of all employees at a specific day in November each year. Employers are defined by their employer identification number, which is changed if ownership changes in a strictly legal sense.1 We have corrected for those cases where more than 50% of all employees are taken over by the new legal employer. In these cases, the workplace is said to continue.
Data on workplaces are subsequently aggregated to firms by Statistics Denmark for Center for Corporate Performance. For a sub-sample of firms with more than 20 employees, these data have been merged with data on financial information concerning profit, total revenue, total costs, investments and capital. These data cover the period 1992-1997.
The individual data include information on gender, age, education, occupational status and wage. For each firm and year, we are able to calculate descriptive statistics (means and standard deviations) of these variables. Thus, the great advantage of our data is that we can observe not only a sample of firms and/or employees, but the whole population of both sides of the Danish market. By aggregating the information of the employees and matching it to the firms, we get a data set where the firm/year is the unit. The data set results in some 30,000 observations.2 During the six-year period (1992–1997), there is information of about 7,000 different firms. Hence, we have an unbalanced panel. 3.2 Variables
We measure firm performance with the log of value added per employee. Value added is thereby defined as net revenue (after rebates and after tax) less purchase of goods (freight, raw and auxiliary materials, external wages). All observations are deflated with the consumer price index with the year 1997 as the base. One can argue that not value added but profit (defined as value added minus wage cost) matters. Using profit instead of value added does not change our results, though.
1
A detailed description of the data is given at http://data.ccp.asb.dk. We deleted some outliers (firms with extreme values of value added and with extreme variations in the numbers of employees). All results are robust with regard to this restriction of the sample. 2
7
The age structure of the workforce is captured by using the mean age and the standard deviation of the employees’ age. Some previous studies use the coefficient of variation, which is defined as the standard deviation divided by the mean, as their measure for the age heterogeneity of the workforce (see O’Reilly et al., 1989; Wiersema & Bantel, 1992; Wiersema & Bird, 1993; Pelled et al., 1999; Kilduff et al., 2000). They partly refer to Allison (1978), who argues that the coefficient of variation is a useful inequality measure for cardinal-scaled variables. We do not doubt that the coefficient of variation is a proper measure for wage inequality, for example. However, there are problems when analyzing age heterogeneity. The coefficient of variation will show the maximum heterogeneity if the workforce of the firm consists of one very old and n-1 very young employees. Besides, the coefficient of variation states decreasing age heterogeneity of firms, which employ exactly the same employees year by year, because the average age of such a workforce goes up while its standard deviation remains constant. In our view, there is a constant age heterogeneity in such a firm. Hence, we use the standard deviation instead of the coefficient of variation as our measure for heterogeneity with respect of age.3 The composition of the workforce with respect to other characteristics than age might also be linked to firm performance. We can control for tenure, schooling, percentage of females and blue collars. Additionally, wages still have to be paid from value added and there might be firm-size, industry and year effects. At last, firm performance might be associated to the age of the firm, when product lifecycles are relevant and market entry of goods and services is particularly observable for start-up firms. Table 1 summarizes the descriptive statistics of these variables. The firms generate an average value added per employee of DKK 430,000 (€ 58,000). The Danish economy is characterized by a large amount of small and medium-sized firms. Only about 10% of firms have more than 200 employees. The average mean age of firms’ workforces is 37 years and the average standard deviation slightly higher than 10 years.
3
Using the coefficient of variation instead of the standard deviation as the heterogeneity measure does not change the results, though.
8
Table 1: Descriptive statistics
Value added per employee (in 1,000 DKK) Mean age (in years) Standard deviation of age Percentage females Percentage blue collars Mean tenure Mean education (in months) Standard deviation of education Mean wage (in DKK) Firm age Firm size (Number of employees) Number of observations
Mean
Standard deviation
430.06 36.85 10.64 0.276 0.619 5.616 144.95 27.67 158.91 16.44 103.79
328.61 3.971 1.688 0.218 0.259 2.539 13.48 5.806 32.71 9.387 382.55 29,863
3.3 Results
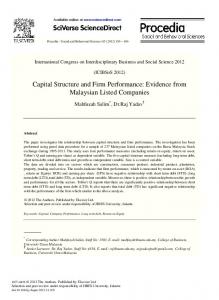
Analyzing the link between the age structure of the workforce and firm performance, it is first of all useful to generate scatter plots for both mean age and the standard deviation of age with value added per employee as the measure for firm performance (see Figures 2 and 3). We find a clear pyramidal or inversely u-shaped interrelation between mean age and firm performance. Highest values for value added per employee are found in firms with an average age of employees of a little less than 40 years (see Figure 2). This cannot be explained with one of the above-discussed theoretical approaches alone. However, this result is in line, for instance, with combined relevance of specific human capital and deferred compensation. If investments in specific human capital are important at the beginning of employees’ careers and deferred compensation is at the end, the resulting wage profiles are flatter (steeper) than the productivity profiles at the beginning (end) of careers.4 Then, firms with medium aged workforces are doing well. 4
Okazaki (1993) finds evidence for Japan that the productivity profile is steeper than the wage profile at the beginning of an employee’s career and the wage profile is steeper at its end. Figure A in the appendix illustrates this result.
9
Figure 2: Mean age and firm performance (value added per employee)
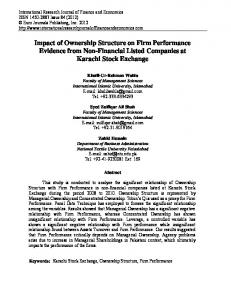
Figure 3: Age dispersion and firm performance (value added per employee)
10
There is also a pyramidal or inversely u-shaped link between age dispersion and firm performance. Firms with a standard deviation of about 10 years have the highest values for value added per employee (see Figure 3). In contrast, firms with either very homogeneous or very heterogeneous workforces with respect to age of employees have much lower value added. However, these bivariate outcomes may also be due to differences across firms with respect to branch of industry, firm size or composition of the workforce. Therefore, it is useful to control for these characteristics by estimating a multivariate linear model log (value added per employee) = β1 • Mean age + β2 • (Mean age)
2
+ β3 • Standard deviation of age + β4 • (Standard deviation of age)
2
+ X’δ + ε, where X represents a vector of other independent variables and ε an error term. A squared term of both age variables is included, because theory does not suggest a clear linear interrelation and the scatter plots show an inversely u-shaped link for both variables. Analyzing differences across firms, we first estimate this linear model with an ordinary least square approach (see Table 2). In general, the impressions of the scatter plots are confirmed. We find inversely u-shaped associations for both mean age and age dispersion. The coefficients for the linear (squared) terms are highly significantly positive (negative). However, there is a large amount of unobserved heterogeneity across firms. For instance, firms offer very different products or services even within a single industry. Taking the unobserved heterogeneity into account, we can make use of the panel data set and estimate a fixed effects model. In doing so, we virtually examine changes within firms. Again, we find inversely u-shaped interrelations for mean age and standard deviation of age with value added (see column (2) of Table 2). Using the coefficients, it is possible to calculate the max of the reserved u’s. Firms with a mean age of 37 years and a standard deviation of age of 9.5 years have the highest value added per employee.
11
Table 2: Regressions on firm performance Dependent variable: log (value added per employee) (1) OLS
(2) Fixed effects
0.065*** (6.79) -0.00089*** (6.92) 0.050*** (3.83) -0.0036*** (5.85) 0.739*** (15.7) -1.096*** (20.1) -0.0042*** (13.3) 0.0022*** (3.34) -0.011*** (6.63) -0.610*** (33.6) 0.0058*** (51.2) 0.0091*** (7.38) -0.0040*** (4.49) -0.0046*** (3.29) 0.0002*** (5.66) Yes Yes 4.550*** (26.1)
0.055*** (5.15) -0.00074*** (5.19) 0.040*** (3.24) -0.0021*** (3.61) 0.111 (1,58) -0.214** (2.44) -0.0006 (1.10) -0.0014** (1.97) 0.0261*** (11.0) -0.093*** (6.05) 0.0014*** (9.99) -0.031*** (7.38) 0.099*** (5.95) -1.553*** (5.66) 0.0001** (2.35) Yes Yes 4.950*** (23.36)
R²
0.280
0.051
Number of observations
29,863
29,863
Mean age (in years) Mean age squared Standard deviation of age Standard deviation of age squared Percentage females Percentage females squared Mean education (in months) Standard deviation of education Mean tenure (in years) Percentage blue collars Mean wage (in DKK 1,000) Firm size (# employees) * 100 Firm size squared * 1,000,000 Firm age Firm age squared Industry dummies (6) Year dummies (6) Intercept
Note: Absolute t-values in parentheses. *, ** and *** indicate significance at the 0.10, 0.05 and 0.01 level.
12
By dividing the sample with respect to firm size, we can see that the results are rather driven by small and medium-sized firms than by huge firms. There is less variation of firms’ age structures in large companies. Besides small firms – in contrast to large firms – have hardly any discretion with respect to the decision of who is supposed to work together with his or her colleague. Additionally, there are some differences between industries. In contrast to other industries, there are no significant results for the construction industry. The estimated max of the inverted u concerning mean age differs across the other industries between 35 and 40 years.
4. Conclusion
This contribution offers first hints for a general link between the age structure of firms’ workforces and firm performance. As a main result, we find inversely u-shaped interrelations between mean age and standard deviation of age with firm performance. Certainly, this is only a first step and much more has to be done in the future. First, the exact age distribution of firms should be analyzed. Pfeffer (1985) mentions a case study, “in which hiring of engineers between 30 and 45 in the spacecraft engineering area was advocated to flatten the current bimodal distribution of 40-60-year-olds and 25-30-yearolds, with a gap in the middle.” Currently BMW has begun to hire many older employees, because the management identifies an unbalanced age structure of the workforce in many parts of the company with too many young and only very few older employees (Niasseri, 2005). Using these indicators and perhaps the theoretical approach of Cremer (1986), it might be beneficial for firms to establish a workforce with uniformly distributed age cohorts. Given the results of our empirical study that firms with a mean age (standard deviation of age) of 37 years (9.5 years) have the highest values of value added, a uniform distribution would suggest an age span of employees from 20.5 to 53.5 years.5 This is,
5
Note that the standard deviation of a uniform distribution is given by upper and lower limits of age.
13
1 / 12 ⋅ (b − a ) , where b and a are the
however, only one possible distribution. A normal distribution with mean 37 and a standard deviation of 9.5 would suggest that 95% of the employees are between 18 and 56 years old. Besides, nothing is said with respect to a possible skewness of the distribution. If a firm uses the possibility to screen young employees and offers only the more talented ones a long-term contract, the age distribution is automatically skewed to the right.
Future research should also concentrate on long-term effects. It would be desirable to create data sets with a longer observation period, which would make it possible to analyze changes in firms over a longer time. This would also improve the possibility to ensure that there is really a causal effect and not only a correlation. Besides, it seems to be very interesting, whether our results hold for different countries with other institutional environments. In contrast to other European countries, Denmark has hardly any dismissal protection and a large amount of labor turnover, for instance.
Analyzing corporate age structures, the ongoing demographic change in Europe is necessarily worth mentioning. The baby boomer generation – the age cohorts born during the 1960s – will become the large fraction of older employees during the next 15 years. Neither before nor after that decade birth cohorts have been that large (see Figure 4). The number of births per year in EU-15 has declined from about 6 millions in the 1960s to less than 4 millions today.
This fact poses a huge challenge not only for the pension scheme of every country, but also for human resource management of firms. A lack of young specialists and executive staff in the near future is easily foreseeable. Therefore, firms should elaborate a proper strategy to react to this challenge already today. Possible measures include an increased employment of senior persons (with appropriate personnel development schemes) and an increased employment of women as well as foreigners. Additionally, an amplified contact to schools and universities might enable firms to recruit graduates before competitors. Increased labor piracy is also a conceivable measure. Anticipating this problem, firms
14
have also to think about appropriate measures to prevent raiding. The analysis of this issue represents another exciting task of future research. Figure 4: Age pyramid of EU-15 in 2002
Men
Women
Source: EuroStat 2004. Abscissa: Percent of total population. Ordinate: year of birth / age.
Appendix Figure A: An example for combined relevance of specific human capital and deferred compensation
W, V W V
t1
t*
t2
t
Note: W = wage profile, V = productivity profile. Relevance for the sharing rule of specific human up to t*. Relevance for deferred compensation from t* on.
15
References
Akerlof, G. (1976): The Economics of Caste and of the Rat Race and other Woeful Tales. Quarterly Journal of Economics 90, 599-617. Allison, P. D. (1978): Measures of Inequality. American Sociological Review (43), 865880. Becker, G.S. (1962): Investment in Human Capital: A Theoretical Analysis. Journal of Political Economy 70, 9-49. Bellmann, L.; Kistler, E.; Wahse, J. (2003): Betriebliche Sicht- und Verhaltensweisen gegenüber älteren Arbeitnehmern. Politik und Zeitgeschichte 20, 26-34. Cremer, J. (1986): Cooperation in Ongoing Organizations. Quarterly Journal of Economics 101, 33-49. Ely, R. J.; D. A. Thomas (2001): Cultural Diversity at Work: The Effects of Diversity Perspectives on Work Group Processes and Outcomes. Administrative Science Quarterly (46), 229-273. Fama, E.F. (1980): Agency Problems and the Theory of the Firm. Journal of Political Economy 88, 288- 307. Festinger, L. (1954) A theory of social comparison processes, Human Relations 7, 117-40 Holmström, B. (1982): Managerial Incentive Problems - A Dynamic Perspective. Essays in Economics and Management in Honor of Lars Wahlbeck, 209-230. Holmström, B. (1999): Managerial Incentive Problems: A Dynamic Perspective. Review of Economic Studies (66), 169-182. Johnson, W.R. (1978): A Theory of Job Shopping. Quarterly Journal of Economics (92), 261-277. Kilduff, M.; Angelmar, R.; Mehra, A. (2000): Top Management-Team Diversity and Firm Performance: Examining the Role of Cognitions. Organization Science (11), 21-34. Kochan, T; K. Bezrukova ; R. Ely; S. Jackson; A. Joshi; K. Jehn; J. Leonard; D. Levine; D. Thomas (2003): The Effects of Diversity on Business Performance: Report of the Diversity Research Network. Human Resource Management (42), 3-21. Lazear, E.P. (1979): Why Is There Mandatory Retirement? Journal of Political Economy 87, 1261-1284. Lazear, E. P.; S. H. Rosen (1981): Rank-Order Tournaments as Optimum Labor Contracts. Journal of Political Economy (89), 841-864. Lazear, E.P. (1998): Personel Economics for Managers, John Wiley and Sons. Niasseri, H. (2005): Arbeit für Alte. Spiegel-Online http://www.spiegel.de/wirtschaft/0,1518,druck-359262,00.html (06.06.2005) O’Reilly III, C.A.; Caldwell, D.F.; Barnett, W.P. (1989): Work Group Demography, Social Integration, and Turnover. Administrative Science Quarterly (34), 21-37.
16
Okazaki, K. (1993): Why Is the Earnings Profile Upward-Sloping? The Sharing Model vs the Shirking Model. Journal-of-the-Japanese-and-International-Economy (7), 297314. Pelled, L.H.; Eisenhardt, K.M.; Xin, K.R. (1999): Exploring the Black Box: An Analysis of Work Group Diversity, Conflict, and Performance. Administrative Science Quarterly 44, 1-28. Pfeffer, J. (1981): Some Consequences of Organizational Demography. In: Kiesler, S. B.; J. N. Morgan; V. K. Oppenheimer (eds.): Aging: Social Change. New York, 291329. Pfeffer, J. (1983): Organizational Demography: In: Cummings, L. L.; B. M. Staw (eds.): Research in Organizational Behavior (5). Greenwich/London, 299-357. Pfeffer, J. (1985): Organizational Demography: Implications for Management. California Management Review (28), 67-81. Simons, T.; Pelled , L.H.; Smith, K.A. (1999): Making Use of Difference: Diversity, Debate, and Decision Comprehensiveness in Top Management Teams. The Academy of Management Journal (42), 662-673. Wiersema, M.F.; Bantel, K. (1992): Top Management Team Demography and Corporate Strategic Change. Academy of Management Journal (35), 91-121. Wiersema , M.F.; Bird, A. (1993): Organizational Demography in Japanese Firms: Group Heterogeneity, Individual Dissimilarity, and Top Management Team Turnover. The Academy of Management Journal (36), 996-1025. Zenger, T.R.; Lawrence, B.S. (1989): Organizational Demography: The Differential Effects of Age and Tenure Distribution on Technical Communication. The Academy of Management Journal (32), 353-376.
17