Agent based Genetic Algorithm Employing Financial Technical Analysis for Making Trading Decisions Using Historical Equity Market Data Cyril Schoreels, Brian Logan, Jonathan M. Garibaldi University of Nottingham
[email protected] Abstract This paper investigates the effectiveness of an agent based trading system. The system developed employs a simple genetic algorithm to evolve an optimized trading approach for every agent, with their trading decisions based on a range of technical indicators generating trading signals. Their trading pattern follows a simple fitness function of maximizing net assets for every evolutionary cycle. Their performance is analyzed compared to market movements as represented by its Index, as well as investment funds run by human professionals to establish a relative measure of success. The results show that the developed system performs comparably to its human counterparts across different market environments, despite these agents being rather primitive in nature. Future forthcoming work will refine and explore the potential of this approach further.
used a genetic algorithm to create composite trading rules on which to base trading decision. In their work they found that when taking transaction costs into account their rules did not earn excess returns over a buy-and-hold strategy. Similarly, Kearns and Ortiz [8] have looked at interacting agents in a more complex trading system, with their main interest resting in developing agents using statistical modeling and machine learning. This paper focuses on demonstrating the effectiveness of an agent-based approach employing a genetic algorithm to trend based trading decision-making when using reallife time-series data compared to some mainstream funds and the DAX-30 Index. It will first introduce the system, followed by an analysis and discussion of test results.
2. System components The system evolves an agent population that uses technical indicators for making trading decisions, using a simple genetic algorithm.
1. Introduction 2.1. Agent description Much research has been done in areas ranging from price prediction to volatility and risk analysis [7, 10]. The research focus ranges from behavioral analysis of markets, aiming to provide understanding of how a particular market works, to optimization problems aiming to deduce an optimal trading pattern to create successful portfolios. Intelligent agent research has over recent years gained in momentum and is applied and studied in an increasing number of different fields [5]. These range from considering market behavior [9, 12] to exploring trading simulations such as this [2, 8]. Following from an agent based approach, genetic algorithms lend themselves well to evolve agent populations [3]. In financial markets, the tendency has been to employ neural networks [13], at times motivated by their ‘black box’ effect of keeping the internal workings hidden and not having to conceptualize rules. This research in part builds on previous experiments by Allen and Karjalainen [2], who developed a system that
The system is based on the concept of simulating traders in a financial market, with each individual agent representing one trader with their own personal portfolio. Each agent is provided with a set starting capital and is allowed to conduct as many trades as desired at the end of each day using the securities closing prices, with the aim of maximizing profits at the end of each generation cycle. An agent can perform three types of actions, which are to buy, sell or hold any security available given capital constraints. In order to determine any action, technical indicators are used to generate trading signals for each individual security using the agent’s genome as parameters in the calculations. Indicators in general generate individual signals from which buy, sell or hold actions can be deduced, which are often based on data covering closing price and/or trading volume for example. In this case, indicators based solely on closing price were used, namely: Simple Moving Average (MA), Relative
Strength Index (RSI), Bollinger Bands (BB), Stochastic Oscillator (SO), Price Rate-of-Change (ROC), Moving Average Convergence Divergence (MACD). Every security is then in turn weighted by the agent prior to selecting the strongest buy signals for acquisition of new securities, and selling off those securities that predominantly returned sell signals. For all other securities no action is taken, which translates into holding the security if it is currently held in the portfolio. There are no transaction costs, no interest is paid on capital holdings and the environment is assumed discrete and deterministic in a liquid market, meaning that an agent’s actions cannot affect prices.
2.2. Genetic algorithm
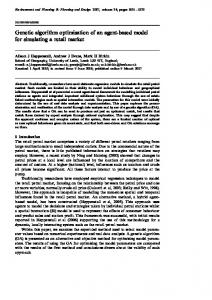
Performance
Elite Crossover Killed
Immigration
New Population
The genetic algorithm forms the core functionality of the system for handling agent reproduction. Specifically, the most successful agents will be selected and survive to the next generation, while the worst performers will be removed. The remaining mediocre majority will be replaced by offspring. An approximate diagrammatical representation can be seen in Figure 1.
Figure 1. Genetic algorithm representation To create the new population, the top performers, referred to as the elite, carry forward unaltered. The worst performers are replaced through randomly generated new agents using the concept of immigration, an approach previously suggested by Branke [4]. This maintains a continuous influx of new genetic material and avoids evolution solely based on the original base population’s gene pool. It is an alternative to using mutation to directly manipulate and introduce change into the population’s genome and avoid premature convergence. For the remaining population each agent selects a mate randomly from the whole population apart from those replaced through immigration, using a random one-point crossover to create an offspring. This offspring then replaces the parent from the remaining population in the new population. A population of 500 was used for training, with 20% belonging to the elite population and 20% being replaced through immigration at the end of each cycle. Fitness is defined as the total net assets at the end of each cycle. The genome is an integer string of varying cardinality, with Table 1 providing an overview of each genes use.
The design takes into account Goldberg’s argument, that although a bit string is optimal for genetic algorithms due to its low cardinality, higher cardinality genomes have shown great success [6]. Important to note is the re-use of various genes, in particular for similar operators, or where values are in theory predicted to be very similar (e.g. threshold values for the RSI and SO). To explain further, genes A and B for instance are general values used in multiple indicators, taking values ranging from 10-50 and 60-100 respectively, indicating the time duration. Table 1. Agent genome breakdown Gene A B C D E F G H I J K L
Description of value Short-term Long-term RSI buy/SO sell threshold RSI sell/SO buy threshold SO and ROC period Risk averseness (true/false) MA weighting RSI weighting BB weighting ROC weighting MACD weighting Signal ratio weighting
Value Range 1-5 1-5 1-5 1-5 1-5 1-2 1-3 1-3 1-3 1-3 1-3 1-3
2.3. Decision process The decision process connects genome and technical indicators to interpret signals generated, which consequently result in buy, sell or hold actions. For each cycle every agent analyzes each security individually using the technical indicators. The value(s) returned from each technical indicator are then interpreted according to analysis theory [1] and buy, sell or hold signals are generated. The signals for every security are then compiled and weighted by indicator, with an overall buy signal being generated if more buy signals than sell signals exist, or vice versa. As this process is repeated for every security individually, the agent compiles a list of all buy and sell securities. The agent then purchases all securities on the buy list using 2/3 of its current funds. The value of 2/3s was selected based on the opinion that some funds should be retained after every buy operation. Following this, any securities on the sell list are sold.
2.4. Historical market data The system uses historical financial data taken from the DAX-30, which is an index listing the top 30 capital weighted companies registered in the German market, with various weighting factors applied to each listed company to determine their impact on the Index. Data
used covers the time range from 26.02.1993 to 28.02.2002, however it does not include all securities from the DAX for its entire span. Due to changes in the DAX’s constituents, discontinued listings that were not listed in 2002 were not included in the data set.
3. Training
In Test B, groups 1 and 2 were exposed to new data in a boom environment. An interesting aspect that might be highlighted is whether the training duration of each would make a significant difference. This period could be described as generally profitable, where the DAX appreciated by 30.46%, with a downward turn already taking hold towards the end. Table 5. Agent performance in Test B
Three separate training groups of 500 agents each were used, covering three increasing and overlapping timespans as indicated in Table 2. This was done to analyze different factors that might influence agent performance. Table 2. Training data Trading days Time period Securities
Training A 261 01.03.02 to 28.02.03 30
Training B 522 01.03.01 to 28.02.03 30
Training C 1306 27.02.98 to 28.02.03 24
Training was terminated after performance appeared to have reached a plateau in each set, resulting in a differing number of generations per group.
To analyze agent performance, test data from different market environments was chosen, following a similar pattern as for training, with different time spans and general market conditions being used in each test. Table 3. Testing data
Time period Securities
Test A 261 01.03.01 to 28.02.02 30
Test B 784 27.02.98 to 28.02.01 30
Test C 1306 26.02.93 to 27.02.98 24
In the following tables, best performance refers to the best result found, average performance to the elites average and P/L ratio to the agent ratio that made a profit. Test A aimed to analyze performance using a completely new set of data. This period could be described as a general depression, where the DAX depreciated by 16.75%. Table 4. Agent performance in Test A Best performance Avg. performance P/L ratio
Group 1 8.82% -10.49% 3/50
Group 1 50.21% 14.18% 37/50
Group 2 113.99% 26.78% 34/50
Test C examined further whether training duration affects performance. Additionally, the data set used in this test was temporally further removed from training A and B, introducing a variance in the market environment. This period could be described as a general boom environment with securities across the board appreciating significantly, as the DAX gained 175.96%. Table 6. Agent performance in Test C Best performance Avg. performance P/L ratio
4. Testing
Trading days
Best performance Avg. performance P/L ratio
Group 1 158.51% 98.34% 50/50
Group 2 239.13% 114.43% 50/50
Group 3 226.93% 126.39% 50/50
5. Analysis and discussion Performance of the agent population only becomes meaningful when placed into context. First, it will be compared to the DAX and then compared to the performance of funds in the market to assess the agent population's success relative to real investors. The elites average performance will be used for comparison purposes. It is important to note that very few fund managers succeed in outperforming their Index [11], and this is reflected in these results, with both agents and funds displaying a worse performance in most instances. Table 7 summarizes results and provides comparison data on funds and the Index. Table 7. Index and test performance comparison DAX Consors DAX 30 Warburg-Daxtrend UBS Equity Fund Group 1 Group 2 Group 3
Test A -16.75% -18.79% -7.93% -20.03% -10.49% -
Test B 30.46% 35.10% 21.99% 14.18% 26.78% -
Test C 175.96% 139.41% 98.34% 114.43% 126.39%
An interesting observation that can be made from the results is that in Test A the trained agent population actually outperformed the Index, while in Tests B and C they did not perform quite as well. When seen in terms of boom or crash periods, Test A analyzed performance of agents trained on data from the same market environment while Tests B and C for groups 1 and 2 did the opposite. This indicates that proximity in training data and testing data is essential, as average performance seems to be highest for the agent group whose training data was temporally the closest to the testing data, hence maintaining consistency in the market environment. Due to frequent changes to the DAX constituents, only funds with recent listings were available for comparison of agent performance to that of funds run by human professionals in well-established institutions. In particular, Test C could only be compared to the UBS Equity Fund, as the other two selected funds did not extend that far back in time. The funds selected, based on their overlap with securities used in the simulation and historical data availability, are the Consors DAX 30, WarburgDAXTREND and UBS (D) Equity Fund – Germany UI. As can be seen in Table 7, the individual funds performed at mixed levels, with the Consors and UBS funds being fairly similar, while Warburbg managed to outperform the Index successfully each year. Promising results were that the agent population managed to perform similarly or in the same league as fund managers, and even in some instances outperformed the Index simultaneously. Given the restricted and simple technical analysis implementation employed with rather severely limited predictive capabilities and methodologies, this is a promising result.
6. Conclusions For every test run, the agent population performed similarly to the three funds. However, it could be argued that though the agent population performed adequately overall, there is significant room for improvement without much further refinement being required. There are various factors that could be considered to improve the system and provide more conclusive results in addition to those already obtained. In particular, availability of comparison data for funds and overlapping training and testing data sets, limited some of the testing and verification possible. Similarly, it could be argued that some of the groups had not yet reached a sufficient stage of optimization. Furthermore, a greater range of technical indicators might have allowed a more in-depth analysis of each security and increased the profit margin further. In conclusion, the different agent populations each managed to perform consistently well in the given market
situations. They outperformed major listed funds half the time, clearly demonstrating their ability to do so repeatedly. Future work will look at refining this approach to produce better results, forming a basis on which to conduct further research into agent behavior.
7. References [1] S.B. Achelis, Technical Analysis from A to Z, McGraw-Hill Trade, 2000. [2] F. Allen and R. Karjalainen, “Using genetic algorithms to find technical trading rules”, Journal of Financial Economics, 1999, Vol. 51, pp. 245-271. [3] W. Banzhaf, P. Nordin, R.E. Keller, and F.D. Francone, Genetic Programming - An introduction: on the automatic evolution of computer programs and its applications, Kaufmann, San Francisco, 1998. [4] J. Branke, "Evolutionary Approaches to Dynamic Optimization Problems - A Survey", GECCO Workshop on Evolutionary Algorithms for Dynamic Optimization Problems, 1999, 134-137. [5] J. Ferber, “Multi-Agent Systems - An Introduction to Distributed Artificial Intelligence”, Addison-Wesley, 1999. [6] D. Goldberg, Genetics Algorithm in Search, Optimization and Machine Learning, Addison-Wesley, Reading, USA, 1989. [7] T. Hellström and K. Holmström, “The Relevance of Trends for Predictions of Stock Returns”, International Journal of Intelligent Systems in Accounting, Finance & Management, Wiley & Sons, 2000, Vol. 9, pp. 23-34. [8] M. Kearns and L. Ortiz, “The Penn-Lehman Automated Trading Project”, IEEE Intelligent Systems, 2003. [9] B. LeBaron, “Agent-based computational finance: Suggested readings and early research”, Journal of Economic Dynamics and Control, 1998, Vol. 24, pp. 679-702. [10] A. Lipton-Lifschitz, “Predictability and unpredictability in financial markets”, Physica D, Elsevier, 1999, Vol. 133, pp. 321-347. [11] OnVista Media GmbH (2003). "Indexfonds". Downloaded from http://fonds.onvista.de/, April 2003. [12] S. Schulenburg and P. Ross, “An Adaptive Agent Based Economic Model”, Learning Classifier Systems: From Foundations to Applications, Springer-Verlag, Berlin, 2000, Vol. 1813, pp. 265-284. [13] B.K. Wong and Y. Selvi, “Neural network applications in finance: A review and analysis of literatures (1990-1996)”, Information & Management, 1998, Vol. 34, pp. 129-139.