Aggressive language identification using word embeddings and sentiment features Constantin Or˘asan Research Group in Computational Linguistics University of Wolverhampton, UK
[email protected]
Abstract This paper describes our participation in the First Shared Task on Aggression Identification. The method proposed relies on machine learning to identify social media texts which contain aggression. The main features employed by our method are information extracted from word embeddings and the output of a sentiment analyser. Several machine learning methods and different combinations of features were tried. The official submissions used Support Vector Machines and Random Forests. The official evaluation showed that for texts similar to the ones in the training dataset Random Forests work best, whilst for texts which are different SVMs are a better choice. The evaluation also showed that despite its simplicity the method performs well when compared with more elaborated methods.
1
Introduction
Social media has become a normal medium of communication for people these days as it provides the convenience of sending messages fast from a variety of devices. Unfortunately, social networks also provide the means for distributing abusive and aggressive content. Given the amount of information generated every day on social media, it is not possible for humans to identify and remove such messages manually, instead it is necessary to employ automatic methods. In an attempt to boost the research in this area, the First Workshop on Trolling, Aggression and Cyberbullying1 has organised the First Shared Task on Aggression Identification.2 The purpose of this shared task was to encourage the development of methods capable of classifying messages from social media (in the case of this task Facebook and Twitter) into three categories Overtly Aggressive (OAG), Covertly Aggressive (CAG) and Non-aggressive (NAG). The task was organised for English and Hindi. For each of the languages, the organisers prepared a training dataset containing texts and comments from Facebook. Participants were able to test their systems on two datasets. The first one was a dataset which contained text from Facebook and therefore it was similar to the training set. The second dataset consisted of tweets and gave the opportunity to test the systems on a dataset which was quite different than the training data. The systems were evaluated using a weighted macro-averaged F-measure. A detailed description of the task, the data used and an overview of the results can be found in (Kumar et al., 2018a). Recent years have seen an increase in the number of papers attempting to detect hate speech, offensive and abusive language. A high number of papers published in this area are from researchers who attempt to tackle the problem of cyberbullying (Dinakar et al., 2011; Xu et al., 2012; Dadvar et al., 2013). As is the case with many other fields in Natural Language Processing, the vast majority of the existing methods rely on machine learning. (Burnap and Williams, 2015) uses Support Vector Machines, Random Forests and a meta-classifier to distinguish between hateful and non-hateful messages. More recent papers focus on using Deep Learning for this task:(Gamb¨ack and Sikdar, 2017) train several classifiers based on convolutional networks and (Zhang et al., 2018) combine convolutional and gated recurrent networks to detect hate speech in tweets. A survey of recent research in the field is presented in (Schmidt and Wiegand, 2017) and the current challenges are discussed in (Malmasi and Zampieri, 2018) 1 2
https://sites.google.com/view/trac1/home https://sites.google.com/view/trac1/shared-task
113 Proceedings of the First Workshop on Trolling, Aggression and Cyberbullying, pages 113–119 Santa Fe, USA, August 25, 2018.
This paper presents a machine learning method which combines information from word embeddings, features derived from emoticos and information from a sentiment analyser to identify texts which contain aggression. The structure of the remainder of the paper is as follows: Section 2 describes the methodology used to train the machine learning methods and how the features were calculated. Section 3 presents the evaluation results, followed by conclusions in Section 4. The code corresponding to the research presented in this paper is available at https://github.com/dinel/aggression_ identification.
2
Methodology
The approach used in this research relies on machine learning to distinguish between the three categories of texts used in this shared task. The features used to train our algorithm are presented in Section 2.1, followed by a discussion of the machine learning algorithms employed in Section 2.2. They were applied to the data set provided by the organisers. The data collection methods used to compile the dataset used for training, development and testing are described in (Kumar et al., 2018b). 2.1
Features used
The approach explored in this research relies on three sources of information for extracting the features corresponding to a text: word embeddings, emoticons and the sentiment expressed in the text. In order to extract these features, our pipeline relies at the preprocessing stage only on NLTK3 to tokenise the texts. Analysis of the output of the tokeniser showed that it is not robust enough to deal with some of the data it had to process. This is particularly true in the case of Twitter data. Therefore, one way to improve the results reported in Section 3 could be to use a more accurate tokeniser. The reminder of this section describes the way each type of feature is determined. 2.1.1 Word embeddings The main purpose of the method proposed here was to investigate to what extent the semantic information encoded by word embeddings can be used to identify texts that contain aggression. For this reason, we used GloVe vectors (Pennington et al., 2014) to extract the vector representation of words. For the experiments presented in this paper, we used the pretrained word vectors obtained from the Common Crawl corpus containing 840 billion tokens and 2.2 million vocabulary entries. Each word was represented using a vector with 300 elements.4 We experimented with other versions of the word vectors which were trained on less data or had smaller dimensions, but they did not lead to better results. However, we did not experiment with word embeddings generated from Tweets. Given the significantly lower results obtained on the Social media data (see section 3) it would be interesting to train the system using these word embeddings and compare the results. In order to obtain the embedding features associated with a text, we add all the vectors corresponding to words in the text and divide them by the number of words in the text. The words which are not present in the GloVe vectors are ignored and not used for weighting the overall vector. Analysis of the data revealed that 12552 words from the training data and 3119 words from the development data do not appear in the GloVe vectors we used. In addition, 1499 words from the Facebook testing dataset and 3823 from the Twitter dataset are not present in the GloVe vectors. In most of the cases these words appear only once. The majority of these words are not English words or are badly tokenised words. Overall, the numbers reported above are small given the size of the data which makes us believe that the missing words had little influence on the performance of the system. 2.1.2 Emoticons In addition to word vectors, the proposed method also uses the emoticons in the training data to determine an ‘emoticon score’ for each of the classes to be predicted. The assumption is that some emoticons are more likely to indicate a type of aggression or the lack of aggression than others. To this end, we use the training data to calculate the TF*IDF score for each of the emoticons with respect to each class. This 3 4
http://nltk.org This file can be downloaded from http://nlp.stanford.edu/data/glove.840B.300d.zip
114
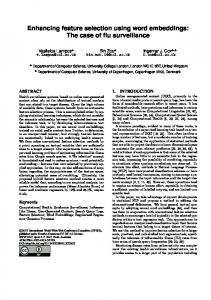
is achieved by calculating the frequency of each emoticon in a class and the number of classes in which the emoticon appears. After that, we apply a slightly modified TF*IDF formula to calculate the score where we consider that we have a total of four classes rather than three. In this way we do not end up with lots of emoticons with a score of zero. This was decided after initial experiments where the score was calculated considering three classes led to worse results. Table 1 presents the top 5 emoticons for each class as determined by our method. As can be seen in the table, some of the emoticons are highly ambiguous, with :face with tears of joy: appearing in top 5 of all three classes. Class 1 2 3 4 5
CAG :face with tears of joy: :grinning face: :clapping hands: :smiling face with horns: :OK hand:
NAG :heart suit: :cross mark: :anger symbol: :face with tears of joy: :hushed face:
OAG :face with tears of joy: :hatching chick: :cross mark: :pouting face: :joker:
Table 1: Top emoticons for each class For each new text we calculate three features, each corresponding to one of the classes to be predicted. The values of the features are the sum of the emoticons scores appearing in the text for the corresponding class. The values of these three features are normalised by the number of emoticons in the text. The emoticons are converted to their corresponding strings description using emoji library.5 This step was not really necessary this particular research, but was introduced in order to accommodate future extension of the proposed method in which we may try to group emoticons together on the basis of their meaning. One possible way of doing this is by using information from EmojiNet.6 2.1.3
Sentiment features
The third type of features used by our method are sentiment features as determined by SentiStrength7 (Thelwall et al., 2010). In contrast with other methods for sentiment analysis which indicate whether a text is positive or negative, or give a number corresponding to rating, SentiStrength returns two scores between 1 and 5 indicating the amount of positive and negative sentiments in a text. The intuition behind including this feature is that texts containing aggression are more likely to be negative. These features were not used in all the runs. 2.2
Machine learning algorithms
The approach used to determine whether a text contains aggression or not relies on machine learning. Several machine learning methods were evaluated during the development stage of the competition and Support Vector Machines (Vapnik, 1995) and Random Forests (Breiman, 2001) proved to be the most appropriate for the task. 2.2.1
Support Vector Machines
Support Vector Machines (SVMs) are a class of supervised machine learning algorithms that can be used for both classification and regression, and proved very useful in NLP applications. When used as a classification method, as is the case in this research, SVMs learn from the training data the parameters of a hyperplane which separates the data in the best way. When data is not linearly separable, a kernel function is employed in order to project the data in a different space which may make the data linearly separable. There are several kernel functions available such as the radial basis function (RBF), sigmoid function and the polynomial function. Experiments carried out during the development stage showed that the best results are obtained using the RBF kernel.8 5
https://pypi.org/project/emoji/ http://emojinet.knoesis.org/ 7 http://sentistrength.wlv.ac.uk/ 8 https://en.wikipedia.org/wiki/Radial basis function kernel 6
115
The accuracy of SVMs is influenced by the soft margin parameter C which determines the penalty of wrongly classifying an instance. In addition, the RBF kernel also has the γ parameter which is the inverse standard deviation of the RBF function. A grid search was performed in order to determine the best values of the C and γ parameters. The best results on the development dataset were obtained using C = 2 and γ = 0.5 when no sentiment features were used, and C = 5 and γ = 0.5 in the setting where the sentiment features were employed. 2.2.2 Random Forests Random Forests classifiers are ensembles of decision trees trained on random splits of the training data and which are used together to classify new instances. Random Forests also proved useful in NLP largely due to their ability to avoid overfitting. In contrast to SVMs, random forests have fewer parameters to estimate. In the case of this research, a grid search was performed to determine the number of trees used and their maximum depth. The best results on the development data set were obtained when 160 trees were considered with a maximum depth of 10.
3
Results
We participated in the shared task with three systems in order to test the performance of different combinations of machine learning methods and sets of features. These are: 1. SVM-no-sentiment: in this setting we used SVM as a classifier and we did not include the sentiment features. The parameters used were C = 2 and γ = 0.5 2. SVM-with-sentiment: in this setting we used SVM as a classifier and we included the sentiment features. The parameters used were C = 5 and γ = 0.5 3. RF-with-sentiment: in this setting we used random forests as a classifier and we included the sentiment features. The parameters used were 160 for the number of trees and 10 for the maximum depth. Tables 2 and 3 present the performance of the three systems on the unseen test data. The figures reported in the table are F1 (weighted), the official evaluation metric, Accuracy (on the test data) and Accuracy on dev, which is the accuracy of the method on the development dataset and which was used as reference when comparing various method during the development phase. The best performing setting on the Facebook dataset (RF-with-sentiment) ranked 13th out of 30 participants, whilst the best on the Twitter dataset (SVM-with-sentiment) ranked 18th out of 30 systems. As can be seen, for the Facebook dataset the best result is obtained by the Random Forest classifier, whereas for the Twitter data the best result is obtained by the SVM classifier. In both cases sentiment features are used. The performance of the three systems submitted is quite similar on the Facebook data. On the social media data, the performance of the system which uses random forests as a classifier is significantly lower than the other two. This is particularly surprising given that it led to the best results on the Facebook data and indicates that the system which uses random forests overfits to the domain and cannot be easily ported to a new domain. System Random Baseline SVM-no-sentiment SVM-with-sentiment RF-with-sentiment
F1 (weighted) 0.3535 0.5717 0.5672 0.5830
Accuracy 0.5295 0.5251 0.5579
Accuracy on dev 0.5768 0.5591 0.5459
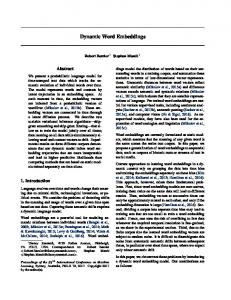
Table 2: Results for the English (Facebook) task. Figures 1 and 2 present the confusion matrices for the best system. As can be seen, in the case of the Facebook data, the most problematic class to identify is OAG with an F-score of 0.2692, followed by CAG with an F-score of 0.3353. Figure 1 shows that a large number of OAG are misclassified as CAG, 116
System Random Baseline SVM-no-sentiment SVM-with-sentiment RF-with-sentiment
F1 (weighted) 0.3477 0.4956 0.5074 0.3892
Accuracy 0.5441 0.5529 0.4749
Accuracy on dev 0.5768 0.5591 0.5459
Table 3: Results for the English (Twitter) task.
Confusion Matrix 0.6 OAG
28
74
42
0.5
True label
0.4 CAG
6
84
52
0.3 0.2
NAG
30
201
399
0.1
Predicted label
NAG
CAG
OAG
0.0
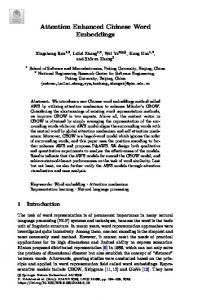
Figure 1: Confusion matrix for the SVM-with-sentiment system on the English (Facebook) task and most of the misclassifications of CAG are as NAG. The latter is to be expected given the difficulties of identifying covert aggression. Despite the large number of NAG instances misclassified, this class has the highest f-score: 0.7106. The picture is different for the Twitter data. The class with the lowest f-score is CAG (0.3247) followed by OAG (f-score 0.4424) and NAG (f-score 0.7122). Interestingly enough, the proposed method has over 97% recall on the NAG class, but only 56% precision. The same method had only 56% recall and 82% precision on the NAG class on the facebook data.
4
Conclusion
This paper has briefly presented our participation in the Aggression Identification Shared Task. Several systems were developed and the code corresponding to these systems was made available at https: //github.com/dinel/aggression_identification. When testing on a dataset similar to the one used for training (i.e. Facebook data) the best system is one which uses Random Forests as a classifier. On a dataset which contains tweets, and therefore is different from the training data, the best classifier is the one which uses Support Vector Machines. The features used by the two systems are the same. In both cases the inclusion of features which capture the sentiment of the texts helped. The core of the methods is the use of features extracted from word embeddings. Despite their simplicity the methods performed well ranking 13th out of 30 participants on the Facebook dataset and 18th out of 30 systems on the Twitter dataset. Analysis of the pipeline used in this research revealed several avenues to 117
Confusion Matrix
True label
OAG
119
126
116
0.8 0.6
CAG
NAG
57
107
249
0.4 0.2
1
13
469
Predicted label
NAG
CAG
OAG
0.0
Figure 2: Confusion matrix for the SVM-with-sentiment system on the English (Twitter) task improve its performance. This includes better tokenisation of the texts and use of domain specific word embeddings. However, the most likely way to improve significantly the results is to use more powerful learning architectures (e.g. use neural networks) and more informative features.
References Leo Breiman. 2001. Random forests. Machine Learning, 45(1):5–32, October. Pete Burnap and Matthew L Williams. 2015. Cyber hate speech on twitter: An application of machine classification and statistical modeling for policy and decision making. Policy & Internet, 7(2):223–242. Maral Dadvar, Dolf Trieschnigg, Roeland Ordelman, and Franciska de Jong. 2013. Improving cyberbullying detection with user context. In Advances in Information Retrieval, pages 693–696. Springer. Karthik Dinakar, Roi Reichart, and Henry Lieberman. 2011. Modeling the detection of textual cyberbullying. In The Social Mobile Web, pages 11–17. Bj¨orn Gamb¨ack and Utpal Kumar Sikdar. 2017. Using Convolutional Neural Networks to Classify Hate-speech. In Proceedings of the First Workshop on Abusive Language Online, pages 85–90. Ritesh Kumar, Atul Kr. Ojha, Shervin Malmasi, and Marcos Zampieri. 2018a. Benchmarking Aggression Identification in Social Media. In Proceedings of the First Workshop on Trolling, Aggression and Cyberbulling (TRAC), Santa Fe, USA. Ritesh Kumar, Aishwarya N. Reganti, Akshit Bhatia, and Tushar Maheshwari. 2018b. Aggression-annotated Corpus of Hindi-English Code-mixed Data. In Proceedings of the 11th Language Resources and Evaluation Conference (LREC), Miyazaki, Japan. Shervin Malmasi and Marcos Zampieri. 2018. Challenges in Discriminating Profanity from Hate Speech. Journal of Experimental & Theoretical Artificial Intelligence, 30:1–16. Jeffrey Pennington, Richard Socher, and Christopher D. Manning. 2014. Glove: Global vectors for word representation. In Empirical Methods in Natural Language Processing (EMNLP), pages 1532–1543.
118
Anna Schmidt and Michael Wiegand. 2017. A Survey on Hate Speech Detection Using Natural Language Processing. In Proceedings of the Fifth International Workshop on Natural Language Processing for Social Media. Association for Computational Linguistics, pages 1–10, Valencia, Spain. Mike Thelwall, Kevan Buckley, Georgios Paltoglou, Di Cai, and Arvid Kappas. 2010. Sentiment in short strength detection informal text. Journal of the American Society for Information Science and Technology, 61(12):2544– 2558, December. Vladimir N. Vapnik. 1995. The Nature of Statistical Learning Theory. Springer-Verlag, Berlin, Heidelberg. Jun-Ming Xu, Kwang-Sung Jun, Xiaojin Zhu, and Amy Bellmore. 2012. Learning from bullying traces in social media. In Proceedings of the 2012 conference of the North American chapter of the association for computational linguistics: Human language technologies, pages 656–666. Association for Computational Linguistics. Ziqi Zhang, David Robinson, and Jonathan Tepper. 2018. Detecting Hate Speech on Twitter Using a ConvolutionGRU Based Deep Neural Network. In Lecture Notes in Computer Science. ESWC 2018, Heraklion, Greece.
119